

Pijitra Phomkham/iStock via Getty Images
Investment summary
After carefully digesting the moving parts involved with previous analyses, there remains no change to the thesis on Inogen, Inc. (NASDAQ:NASDAQ:INGN). I’m reiterating a hold on INGN after: a). The company’s most recent set of numbers and; b). Uncertainties to FY22 guidance from ongoing supply-chain headwinds.
I’ve covered INGN at lengths previously both here and here and noted the following thematic has remained consistent after the second quarter:
- INGN’s direct-to-consumer (“DTC”) and business-to-business (“B2B”) segments have been adversely impacted by the pandemic – in 2020, a combination of limited salesforce expansion, reduced volume and purchase order cancellations; by Q1 FY2 – lagging growth in the DTC and B2B businesses clamped margin growth.
- “Pricing dynamics are more extreme in the portable oxygen concentrator (“POC”) market relative to others. INGN’s product mix is the most expensive option within the segment.”
- The wind-back of COVID-19 protocols combined with this less benign pricing environment are key headwinds set to impact INGN’s business model looking ahead.
- Fluidity in supply of semiconductors and semiconductor inventory are key challenges until POC redesign efforts are realized.
With that, trends remain unchanged and supply chain disruptions in particular have blurred management’s ability to provide full-year guidance.
INGN Q2 earnings walkthrough illustrates challenges
INGN came in with a mixed set of second quarter numbers vertically down the P&L. Revenue of $103.4 million (“mm”) saw a marginal year-on-year increase, with growth of ~180bps at the top line. The bulk of the upside was underpinned by a 22% YoY gain in rental revenue to $14.08mm, whereas sales revenue tightened ~110bps YoY to ~$89.3mm.
Certainly, Medicare and various commercial payors have reduced the bureaucratic overhang for oxygen therapy since the onset of the pandemic. This may inflect positively to revenue on INGN’s rental business. At the same time, however, its B2B channels have continued to narrow as COVID-19 continues to play havoc on travel, physician office restrictions, and labor shortage in hospitals.
Most notably are the supply chain issues INGN continues to incur as a result of global semiconductor shortages. In Q1 FY22, it had to temporarily suspend operations for ~6 weeks due to this issue. The shortages have limited the company’s ability to produce and sell systems and batteries and may potentially hurt FY22 numbers if it happens again. This is coupled by the surging gas price, hurting margins for semiconductor manufacturers and buyers downstream. To offset, management had started to re-engineer some POC components to overcome this hurdle, but this will take time.
INGN has, per the 10-Q:
“attempted to mitigate the impact of this increased supply shortage, but it has and will likely continue to negatively impact [its] ability to manufacture product, and [it] could be forced to slowdown or temporarily halt production again.”
However, the impact was still felt at the cost of revenue (“COR”) line, with the COR margin in Q2 FY22 spiking 5 percentage points YoY to 55.2% on quarterly COR of $57.1mm ($2.50/share). Important for INGN, is that it saw some upside in its international B2B segment, with a c.71.5% YoY gain in sales to $37.4mm for the quarter.
Domestically, however, B2B sales narrowed 59.3% to $11.2mm YoY, but the company gained traction towards the back end of the quarter as it began to fulfil backlog demand within the channel. Moreover, B2B receivables increased 39.2% YoY to $25.6mm, as seen in Exhibit 1. The segment also contains one customer with a receivable balance of $3.8mm as of 30 June, that has received extended payment terms via an offered direct financing plan.
Exhibit 1. INGN net accounts receivable – note c.39% YoY gain to ~$25.7mm in B2B receivables
Data: INGN Q2 FY22 10-Q; pp.13 – Accounts receivable and allowance for bad debts, returns, and adjustments.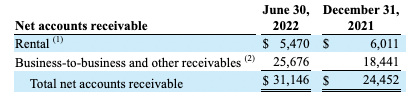
Further evidence of the same is seen when moving down the P&L. Gross margins for sales and rental revenue declined 510bps and ~440bps YoY to 43.3% and 58.6% respectively. It bought this down to a GAAP net loss of $2.8mm, following an $11.6mm profit the same time last year.
Fair view of Inogen’s fundamentals
Diving deeper into INGN’s numbers and the risk/reward calculus remains balanced. As seen in Exhibit 2, quarterly FCF and FCF return on equity (“FCF ROE”) have both drifted lower off peaks in FY18 in a cyclical fashion across the time period. Prints have narrowed on a sequential basis, with FCF now on a TTM loss of $18.3mm after the second quarter.
Keep in mind, the narrowing FCF and FCF yield isn’t a negative feature, especially as INGN’s TTM return on investment (“ROIC”) has pushed north into the double digits since FY20 and easily covers the WACC hurdle by 1.8 turns. This is in fact a desirable characteristic and suggests the company is reinvesting more money than it’s made and is generating sufficient return on these investments. No doubt, this adds a bullish tilt to the risk/reward calculus.
Exhibit 2. INGN FCF Analysis: Whilst FCF prints have drifted lower since FY18′, the company has generated sufficient return on its invested capital across the pandemic.
- LHS – Free Cash Flow (Qrtly)
- RHS – All others
- There’s certainly more meat on the bones when examining how/where INGN invests its capital and the return it generates as a result.
Note: All figures in $mm or (%). Return on invested capital calculated as (NOPAT/Invested Capital) and is derived from GAAP earnings with no reconciliations. Free Cash Flow calculated as (NOPAT – Investments) on quarterly basis. FCF ROE is a function of Quarterly free cash flow. Free cash flow yield calculated as a function of enterprise value. All figures are derived from GAAP earnings with no reconciliations. (Image: HB Insights, Data: INGN SEC Filings)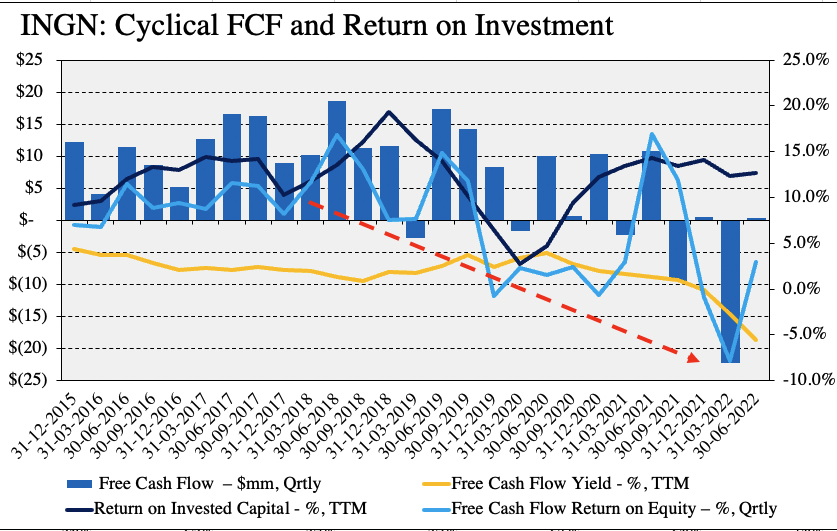
Conclusion
As I had pointed out in the previous analysis, the internal team noticed INGN presents with an ‘unhappy triad’ of narrowing FCF, tightening margins in its B2B and D2C segments and ongoing supply chain headwinds. In that analysis, I had called for a revenue per rep of $902,000 to meet FY22 guidance. There’s questionability on this number in my estimation, and I’m not too interested in paying 1.75x book value without the earnings and cash flow to back up the company’s reasonably high ROIC. With these points in mind, I rate INGN a hold and recommend investors to consider the points laid out in this report.
Be the first to comment