

Drew Angerer/Getty Images News
By Jeff Spiegel
Key Takeaways
- Many infrastructure stocks are proving resilient to inflation due to their value characteristics, inflation-adjusted contracts, and fixed interest rate debt, as has been the case historically. They could also stand to benefit from reshoring efforts amid global supply chain disruptions, garnering new investment and greater usage.
- Infrastructure public equities should benefit from public sector spending. In the U.S., the Infrastructure Investment and Jobs Act (IIJA) is directing $1.2 trillion in government spending to rebuild and enhance U.S. infrastructure. At the same time, global infrastructure spending is accelerating as countries grapple with supply chain pressures, look to stimulate economic activity, and adapt to climate change.
- We believe investors can capitalize on infrastructure opportunities by investing in both infrastructure enablers (companies that generate revenue from construction products and services) and infrastructure asset owners (companies that generate revenue by operating infrastructure, like utilities and ports).
Interest rates are rising to manage inflation, we are experiencing a regime shift in equity markets, and supply chains are unprecedently strained. Yet, this does not mean there are no Megatrend opportunities available to investors. In fact, moments of permanent change can often spark periods of exponential growth — for infrastructure, that moment could be now.
Infrastructure Stocks Tend To Outperform Other Asset Classes In Inflationary Environments
Infrastructure stocks may prove resilient amid high inflation and rising rates. They tend to hail from value-oriented sectors like utilities, industrials, and materials, where valuations are driven primarily by near-term cash flows rather than long-term growth expectations. Many infrastructure asset owners have additional lines of defense against inflation, including: 1) 10- to 20-year contracts that reset their pricing in parallel with changes in inflation; 2) long-term fixed interest rate debt that erodes in relative cost as inflation rises (i.e. their interest payments remain the same, even as the dollar loses its value); and 3) a tendency to pay large dividend payments — dividends often increase during inflationary periods.1 Because of these features, infrastructure stocks have historically performed well in inflationary environments like the one we find ourselves in today.
Global infrastructure stocks historically outperformed the broader market and other asset classes in inflationary environments
Chart description: Column chart of average of annualized returns during periods of high inflation for global infrastructure stocks, global stocks, global IG bonds, and global real estate. The chart shows how global infrastructure stocks historically outperformed the broad market and other asset classes during periods of high inflation, on average. (Asset classes represented by S&P (Global Infrastructure: S&P Global Infrastructure Total Return Index), MSCI (Global Stocks: MSCI ACWI Net Total Return; Global Real Estate: MSCI World Real Estate Net Total Return Index), Bloomberg (Global IG Bonds: Bloomberg Global Aggregate Index); Bloomberg data as of 5/31/22 (monthly data since 2/2007).)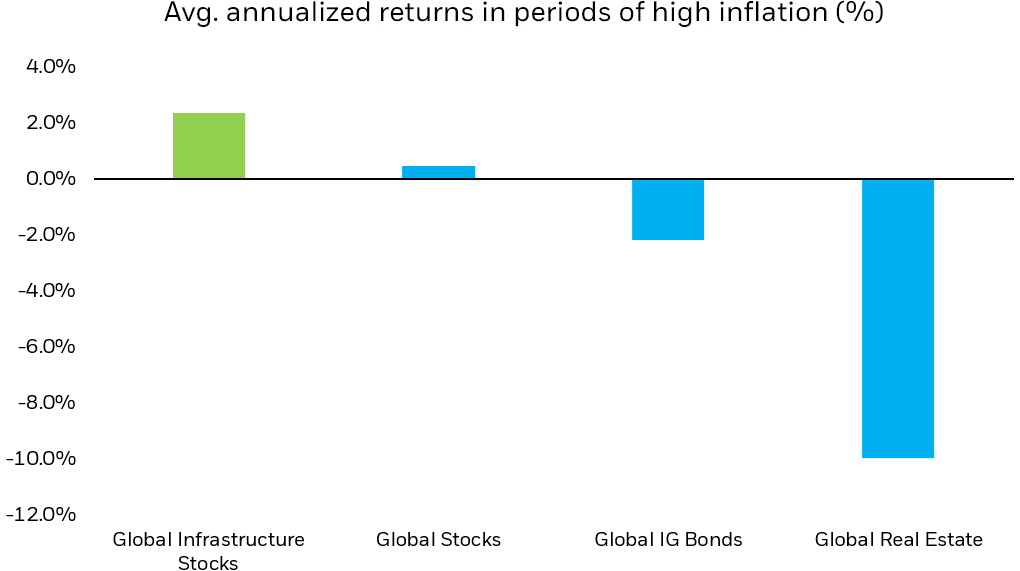
Note: Past performance is not indicative of future results. You cannot invest directly in an unmanaged index. High inflation periods are when monthly year-over-year U.S. CPI > 2.5% . Returns represent the avg. of annualized returns across these periods (using end of month values), excluding periods < 3 months.
Infrastructure Companies Could Accelerate And Benefit From Supply Chain Reshoring
Beyond infrastructure’s near-term resilience, there are several tailwinds that appear supportive of long-term growth. Global supply chains are re-orienting against unprecedented change — input shortages, logistical bottlenecks, and geopolitical crises are challenging the world’s multi-decade reliance on globalization. At the end of 2021, 90% of firms surveyed by McKinsey said they would re-orient towards regionalization in the next three years.2 Building new infrastructure, whether funded through government policies or private investment, can facilitate and accelerate these efforts. Improving roads, airports, seaports and waterways is essential to ensuring seamless supply chains, reshoring and an amelioration of today’s pressures. We believe key segments across the infrastructure value chain are well-positioned to benefit from projects of this variety, including both infrastructure enablers and asset owners.
Which Areas Will Benefit From Infrastructure Spending?
Last November, President Biden signed the Infrastructure Investment and Jobs Act into law, cementing the single largest infrastructure investment in U.S. history, allocating $1.2 trillion of spending (including $550 billion of new spending) over the next decade.
The IIJA will invest $550 billion of new spending across most facets of U.S. infrastructure
Chart description: Bar chart showing new spending in billions from the IIJA, across various facets of U.S. infrastructure. The chart shows that many billions of dollars will be invested across most facets of U.S. infrastructure. (U.S. Congress, November 2021)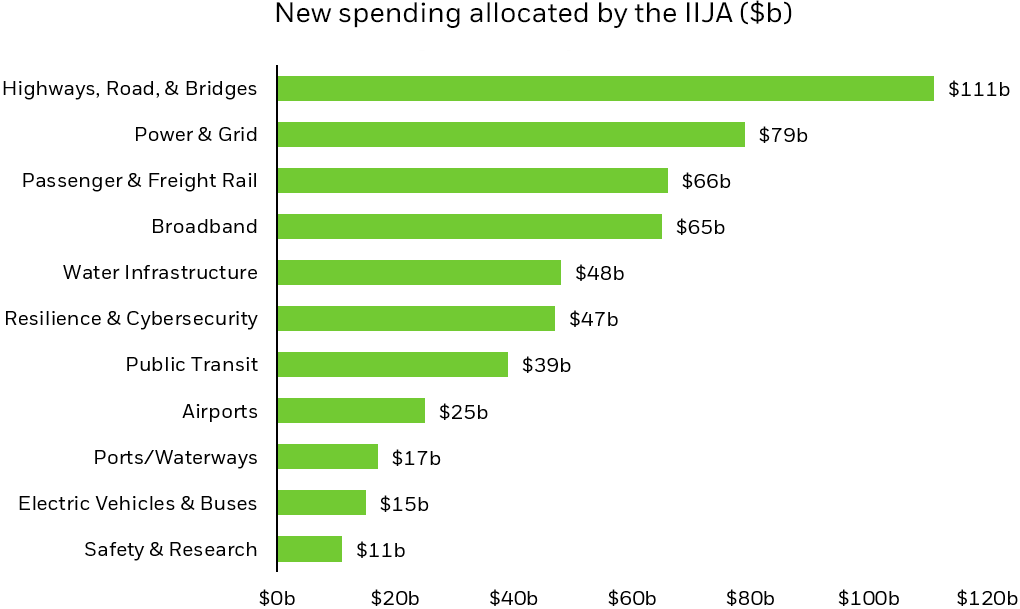
In the short time since the infrastructure bill’s enactment, the federal government awarded, announced, or initiated funding processes for over $110 billion of spending across 4,300+ projects.3 This includes:
Transportation: $52.7 billion for highways, $20.5 billion for public transit, $5.3 billion for bridges, and $14 billion for ports and waterways.
Power infrastructure and clean technologies: $3.2 billion for energy efficient homes, $3 billion for advanced batteries, $4.8 billion for power grids, $20 billion for clean energy and $9.5 billion for clean hydrogen.
Water infrastructure and environment: $8 billion to improve pipes and drive cleaner, more efficient water distribution.
Digital infrastructure and resilience: $45 billion Internet for All Initiative, opening a wide range of funding opportunities, including applications to access $3.2 billion for rural broadband deployment.
Constructive Outlook for U.S. Infrastructure Investments
We expect immediate spending from the infrastructure bill to translate to near-term revenue increases for enablers as they provide the products and services that comprise infrastructure projects, from raw materials all the way to project development. U.S.-based companies are particularly well positioned given the bill’s “Build America, Buy America” provisions. The White House recently issued guidance to this end, outlining new standards to “ensure that federally funded infrastructure projects use American-made [materials and products].”4
Over the medium term, we expect U.S. infrastructure asset owners to enjoy freed-up capital from government-funded improvements that should reduce initial and ongoing capital expenditure needs and improve margins. We also anticipate that these companies will experience service improvements that should expand their overall markets and revenues. Rail operators, for example, should benefit from expanded and faster routes, while electric and water utilities should benefit from safer and more reliable service.
And long-term, we expect U.S. infrastructure enablers and owners to benefit from continued spending and resulting infrastructure improvements. Infrastructure spending is not a one-off investment — it will take more than a decade for the government to fully disperse the infrastructure bill’s funds, with the Act’s final dollars being spent after 2031.
A $130 Trillion Global Infrastructure Boom
For developed market countries, expanding and revitalizing infrastructure is essential to remaining competitive and raising the ceiling of productivity at the national level. Take the development of the Channel Tunnel that links the United Kingdom to France. Prior to its completion in 1994, trade and tourism between the U.K. and the rest of Europe were subject to logistical challenges and speed limitations. Over two decades later, more than 20 million passengers and $187 billion of trade travel through the tunnel by car and train every year.5
Infrastructure development is also a fundamental part of modernizing emerging market (EM) economies. China, for example, spent generously on public infrastructure from 1992 to 2011, averaging 8.5% of annual GDP and helping to catalyze the country’s tremendous growth.6 Over that same period, China’s GDP grew at an average annual rate of 17% and, in 2021, was estimated to be 14 times greater than at the turn of the millennium.7,8 China’s infrastructure boasts some of the fastest rail, most efficient ports, and largest airports in the world.
EM infrastructure spending could exceed $65 trillion over the next two decades
Chart description: Column chart showing total estimated infrastructure spending across emerging market regions from 2021 to 2040. The chart shows that $65 trillion could be invested across all regions, with emerging Asia receiving the most investment. (Swiss Re Institute estimates using data from G20 & Oxford Economics, 2020.)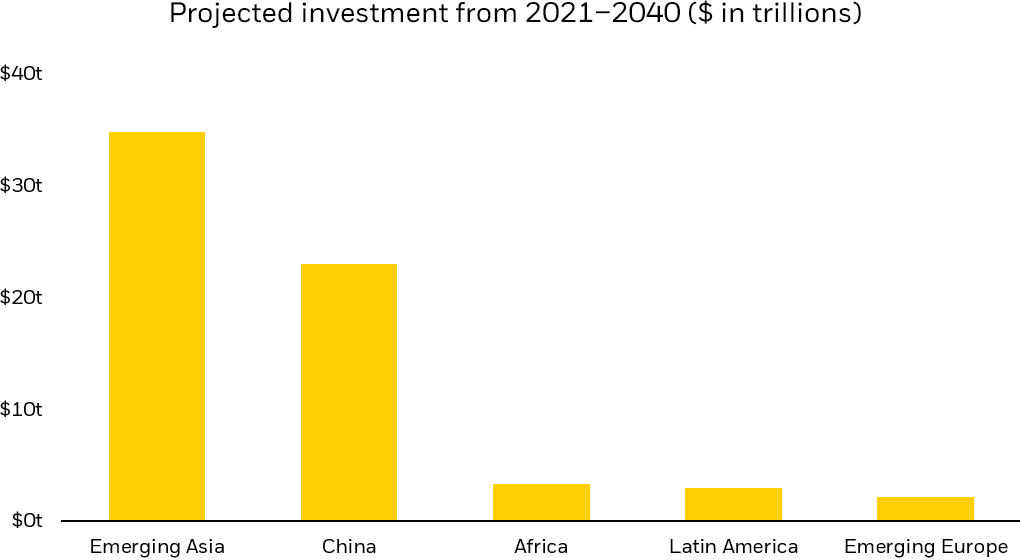
The same story is beginning to unfold in emerging markets more broadly. Supply chains are diversifying away from significant reliance on China as demands for greater resiliency mount. In fact, at current rates, global infrastructure assets may garner as much as $130 trillion of investment over the next five years.9 This is in no small part driven by local investment to capture opportunities in “near-shoring” to broader Asia, Latin America and Eastern Europe. And established economies are explicitly helping. The European Union announced its Global Gateway initiative, which seeks to direct $320 billion to transport, clean energy, and other infrastructure projects of partner countries.10
Key Infrastructure Segments For Investors: Enablers And Asset Owners
Investors looking for exposure to infrastructure via public equities may want to consider looking at ETFs invested in companies that generate a majority of their revenues from infrastructure-related business activities, firms across both infrastructure enablers and asset owners.
Infrastructure enablers — Enablers are cyclical exposures, spanning companies involved in producing construction materials, products, and equipment, and providing construction/engineering services.
- Construction Product/Equipment: Transportation (e.g., mixing/paving asphalt, highway components, rail/railcars, construction equipment), traditional and clean energy (e.g., electrical wiring, electric controls); water infrastructure (water pipes, pumps, filtration components); and digital infrastructure (cables and telecommunication structures).
- Materials: Transportation (e.g., concrete, asphalt, steel); traditional and clean energy (e.g., copper, nickel, aluminum, and insulating plastics); as well as water (thermoplastic, concrete, chemicals used in distribution, storage).
- Construction/Engineering Services: Transportation, power, clean energy, water and digital infrastructure.
Infrastructure asset owners — Asset owners are non-cyclical exposures involved in operating various facets of completed infrastructure, including water, electric, and gas utilities; railroad companies, and pipeline operators.
Conclusion
Inflation and supply chain disruption are top-of-mind for investors, making infrastructure a compelling port in the storm. After years of anticipation, and many months of debate, significant public sector funds are ramping up to support U.S. infrastructure in ways that could create meaningful investment opportunities for years to come. And global infrastructure development is a critical story over the next decade. Pure-play infrastructure ETFs have the potential to help investors navigate today’s turbulence, while capturing the structural growth opportunities of tomorrow.
© 2022 BlackRock, Inc. All rights reserved.
1 IHS Markit, “Inflation impact on dividend distributions,” March 28, 2022.
2 McKinsey & Company, “How COVID-19 is reshaping supply chains,” November 23, 2021.
3 The White House, “FACT SHEET: Biden-Harris Administration Hits the Ground Running to Build a Better America Six Months into Infrastructure Implementation,” May 16, 2022.
4 The White House, “How Build America, Buy America Guidance Strengthens Made In America Requirements,” April 20, 2022.
5 EY, “Economic Footprint of the Channel Tunnel in the EU,” June 2018. *Converted to USD using 2018 average EUR/USD conversion rate and adjusted to 2022 $
6 Barron’s, “What America Can Learn from China about Infrastructure Investment,” March 15, 2021.
7 China Briefing, “China’s Most Productive Provinces and Cities as per 2021 GDP Statistics,” February 7, 2022.
8 IMF, 2022.
9 McKinsey & Company, “Here comes the 21st century’s first big investment wave. Is your capital strategy ready?” March 18, 2022.
10 European Commission, “Global Gateway,” December 1, 2021.
Carefully consider the Funds’ investment objectives, risk factors, and charges and expenses before investing. This and other information can be found in the Funds’ prospectuses or, if available, the summary prospectuses, which may be obtained by visiting the iShares Fund and BlackRock Fund prospectus pages. Read the prospectus carefully before investing.
Investing involves risk, including possible loss of principal.
International investing involves risks, including risks related to foreign currency, limited liquidity, less government regulation and the possibility of substantial volatility due to adverse political, economic or other developments. These risks often are heightened for investments in emerging/ developing markets or in concentrations of single countries.
Funds that concentrate investments in specific industries, sectors, markets or asset classes may underperform or be more volatile than other industries, sectors, markets or asset classes and than the general securities market.
This material represents an assessment of the market environment as of the date indicated; is subject to change; and is not intended to be a forecast of future events or a guarantee of future results. This information should not be relied upon by the reader as research or investment advice regarding the funds or any issuer or security in particular.
The strategies discussed are strictly for illustrative and educational purposes and are not a recommendation, offer or solicitation to buy or sell any securities or to adopt any investment strategy. There is no guarantee that any strategies discussed will be effective.
The information presented does not take into consideration commissions, tax implications, or other transactions costs, which may significantly affect the economic consequences of a given strategy or investment decision.
This material contains general information only and does not take into account an individual’s financial circumstances. This information should not be relied upon as a primary basis for an investment decision. Rather, an assessment should be made as to whether the information is appropriate in individual circumstances and consideration should be given to talking to a financial professional before making an investment decision.
The information provided is not intended to be tax advice. Investors should be urged to consult their tax professionals or financial professionals for more information regarding their specific tax situations.
The Funds are distributed by BlackRock Investments, LLC (together with its affiliates, “BlackRock”).
The iShares Funds are not sponsored, endorsed, issued, sold or promoted by Bloomberg, BlackRock Index Services, LLC, Cohen & Steers, European Public Real Estate Association (“EPRA®”), FTSE International Limited (“FTSE”), ICE Data Indices, LLC, NSE Indices Ltd, JPMorgan, JPX Group, London Stock Exchange Group (“LSEG”), MSCI Inc., Markit Indices Limited, Morningstar, Inc., Nasdaq, Inc., National Association of Real Estate Investment Trusts (“NAREIT”), Nikkei, Inc., Russell or S&P Dow Jones Indices LLC or STOXX Ltd. None of these companies make any representation regarding the advisability of investing in the Funds. With the exception of BlackRock Index Services, LLC, which is an affiliate, BlackRock Investments, LLC is not affiliated with the companies listed above.
Neither FTSE, LSEG, nor NAREIT makes any warranty regarding the FTSE Nareit Equity REITS Index, FTSE Nareit All Residential Capped Index or FTSE Nareit All Mortgage Capped Index. Neither FTSE, EPRA, LSEG, nor NAREIT makes any warranty regarding the FTSE EPRA Nareit Developed ex-U.S. Index or FTSE EPRA Nareit Global REITs Index. “FTSE®” is a trademark of London Stock Exchange Group companies and is used by FTSE under license.
© 2022 BlackRock, Inc. All rights reserved. BLACKROCK, BLACKROCK SOLUTIONS, BUILD ON BLACKROCK, ALADDIN, iSHARES, iBONDS, FACTORSELECT, iTHINKING, iSHARES CONNECT, FUND FRENZY, LIFEPATH, SO WHAT DO I DO WITH MY MONEY, INVESTING FOR A NEW WORLD, BUILT FOR THESE TIMES, the iShares Core Graphic, CoRI and the CoRI logo are trademarks of BlackRock, Inc., or its subsidiaries in the United States and elsewhere. All other marks are the property of their respective owners.
iCRMH0622U/S-2247958
This post originally appeared on the iShares Market Insights.
Editor’s Note: The summary bullets for this article were chosen by Seeking Alpha editors.
Be the first to comment