

DNY59
Has inflation peaked?
I don’t think I am going out on a limb by stating inflation has now peaked in the US and across much of the developed world, at least on a headline basis. Whilst services inflation continues higher, energy, food, and goods inflation is rolling over. If we examine inflation through the lens of not just headline CPI, but Core CPI, Sticky Prices CPI, Trimmed Mean PCE, and Core PCE, these measures confirm this dynamic. We can see below how headline inflation pressures have likely peaked, but, the stickier measures of inflation are yet to materially inflect lower.
Acheron Insights, St. Louis Fed, BLS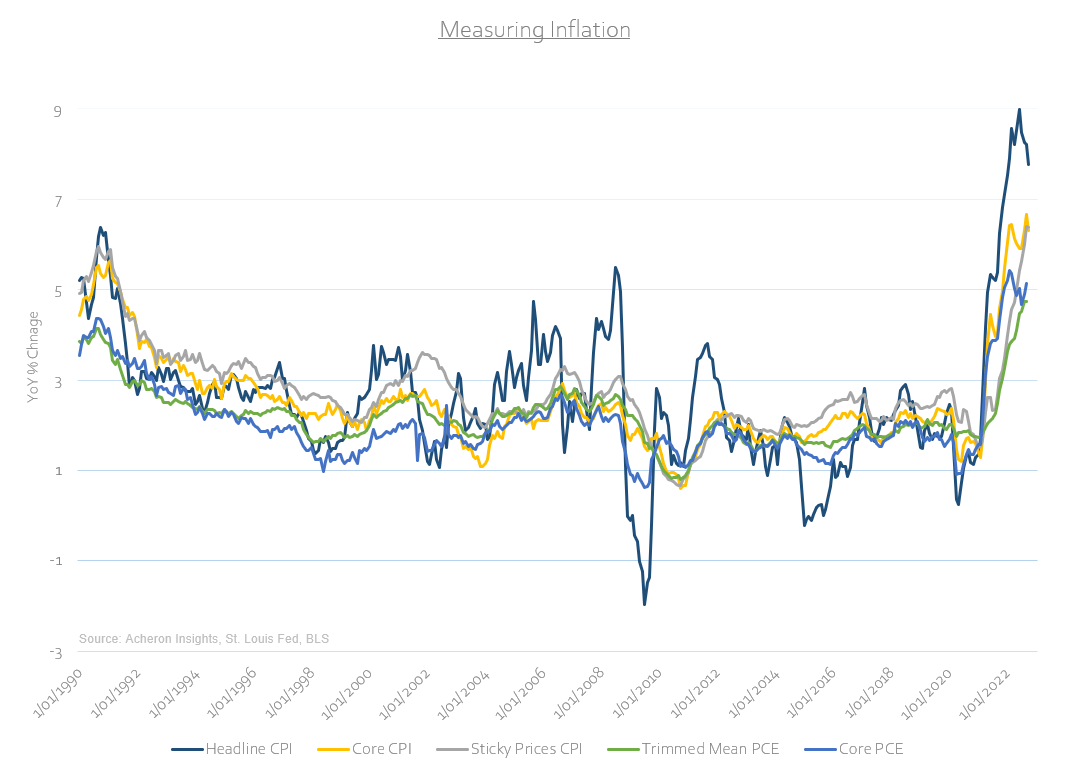
We can further break down the recent drivers of inflation by examining the relative contribution of services (both shelter CPI and ex-shelter services CPI), goods, energy, and food prices. This is illustrated below. The glaring observations are that the recent inflection lower in headline CPI has come about as a result of a deceleration in both energy prices and goods prices. Commodity inflation (ex-food and energy) peaked in Q1 this year, while energy inflation looks to have peaked around the beginning of Q3. Food inflation also appears to be peaking as we speak, but, services inflation on the other hand looks to be accelerating still.
Acheron Insights, St. Louis Fed, BLS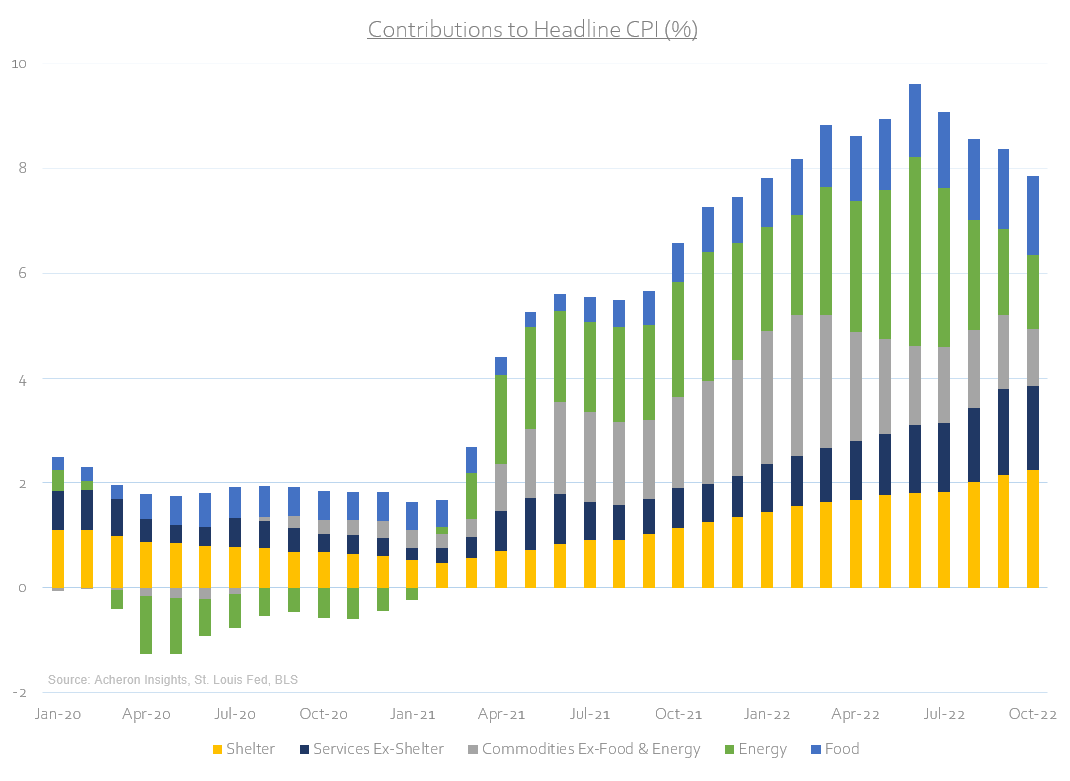
Fortunately, the outlook for goods, food, and energy inflation appears favourable. While falling goods inflation will drive headline CPI lower in the months ahead, the longevity of higher inflation will be largely driven by the trends in services inflation. This stickiness in services inflation is an important dynamic we must keep an eye on. Goods disinflation is all well and good, but the Fed’s reaction function depends on services inflation. Let’s dig in.
The outlook for inflation
First and foremost, it is important to reiterate that inflation is inherently cyclical and is by and large driven by the whims of the business cycle, at least on a directional basis. This is very much the case for goods inflation and is also true for services inflation to a certain degree. As I have been doing my utmost to convey to investors for some time now, the business cycle is slowing and will continue to decelerate well into 2023. A slowing economy is very much a cyclical headwind for inflation.
Acheron Insights, St. Louis Fed, ISM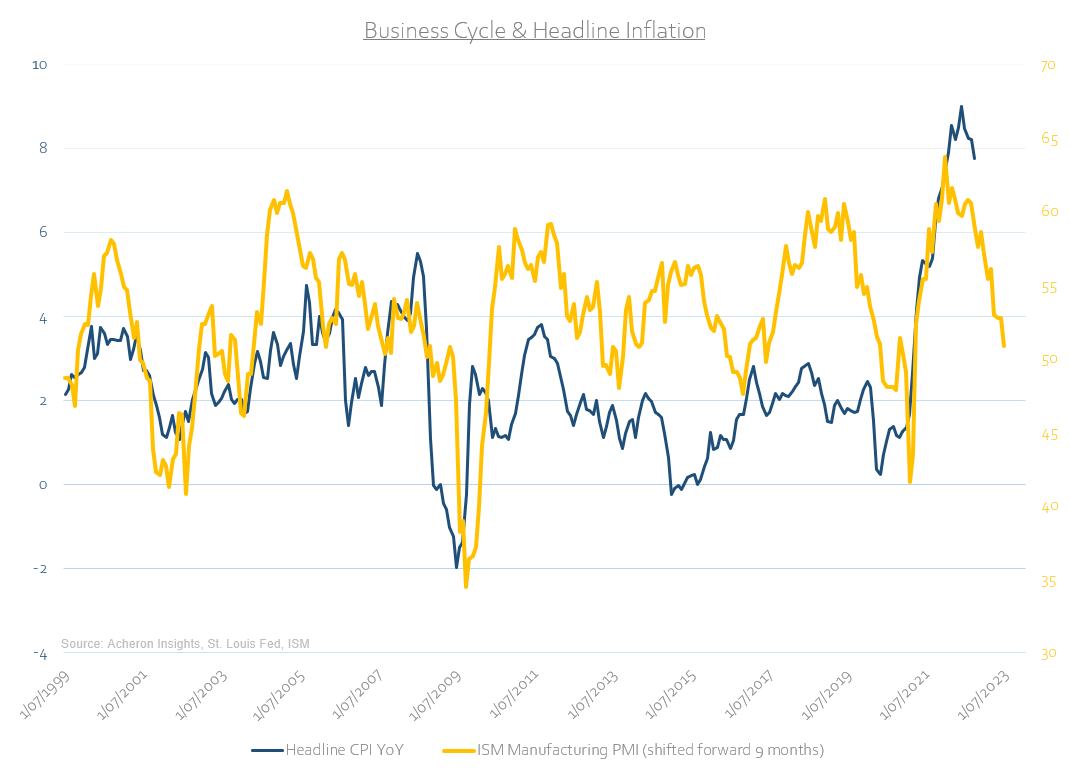
A slowing economy is an ultimate way to stifle demand. And, demand destruction is a recipe for goods disinflation.
Goods disinflation, right here, right now
Goods inflation is the most volatile component of headline CPI and is made up of food (13.7% of headline CPI), energy (8% of headline CPI), and commodities ex-food and energy (21% of headline CPI). Food and energy prices are particularly volatile, hence why they are excluded from many measures of core inflation. This volatility is grounded in the cyclicality of the business cycle, with commodities inflation (ex-food and energy) being particularly connected to this dynamic.
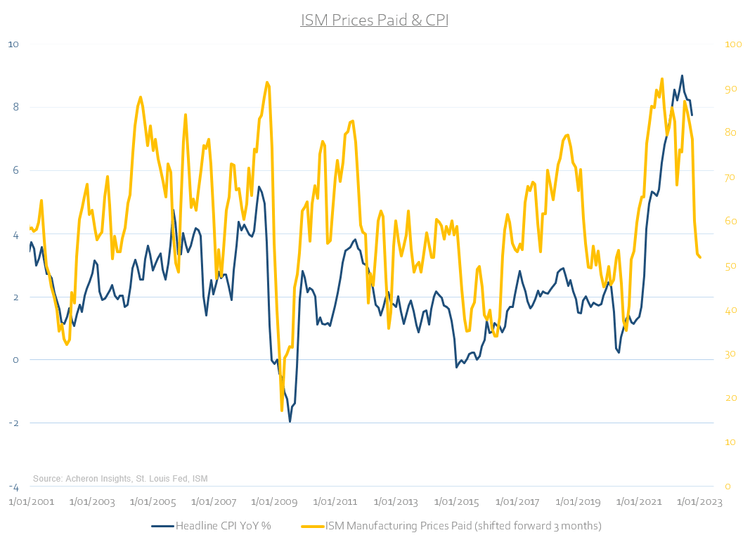
Indeed, we can observe this cyclicality through the lens of manufacturing activity. A build-up of inventories relative to sales equates to lower prices. The best representation of this can be seen via the ISM Manufacturing Survey’s New Orders less Inventory spread and Prices Paid subcomponents. Both provide a solid three months lead on headline inflation and are clearly signaling disinflation is imminent.
Acheron Insights, St. Louis Fed, ISM Acheron Insights, St. Louis Fed, ISM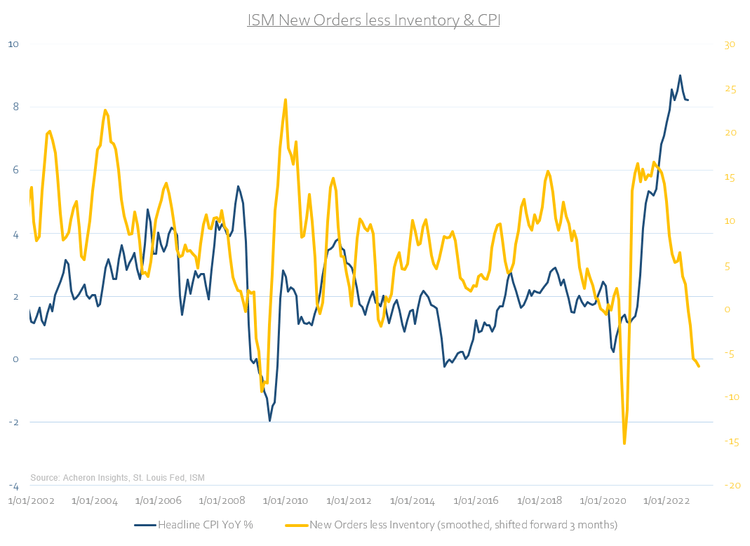
When demand for manufactured goods is rising relative to inventory, manufacturing companies respond by building up inventories, which in turn sees the consumption of raw materials and industrial commodities rise followed by a commensurate response in prices. This dynamic works both ways. When inventories are stocked but sales declining, there is less need for the consumption of related raw materials and industrial commodities, and prices growth will inflect lower accordingly. Industrial commodities are thus highly demanded sensitive and are heavily linked to both goods consumption and therefore goods inflation.
Acheron Insights, St. Louis Fed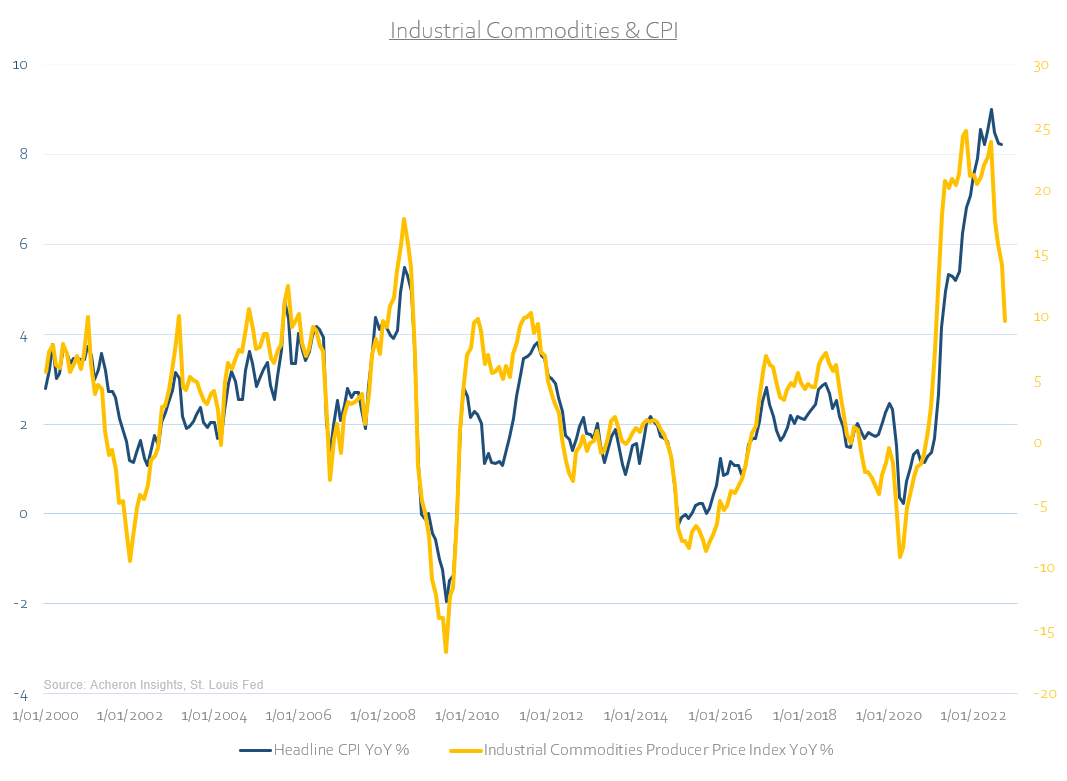
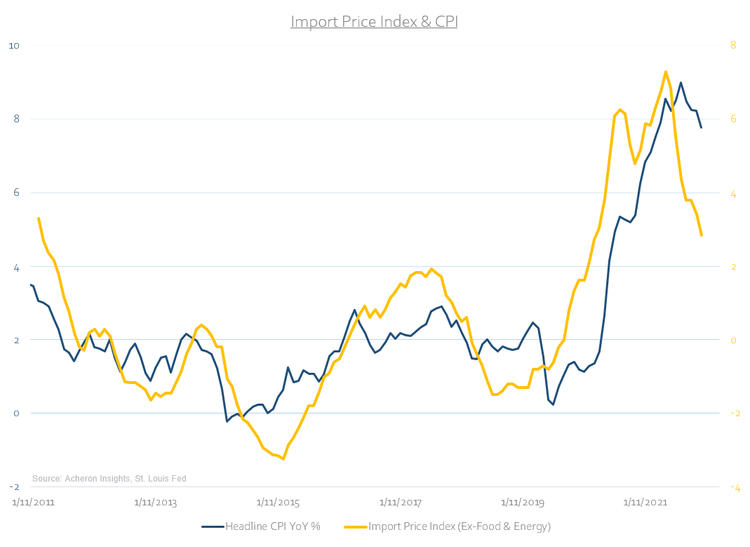
It is not just this deceleration in industrial commodities weighing down manufacturing input prices, but both the depreciation in the Chinese yuan and a deceleration in import prices for commodities (ex-food and energy) that should also lead to goods inflation lower in the months ahead.
Acheron Insights, St. Louis Fed, ISM Acheron Insights, St. Louis Fed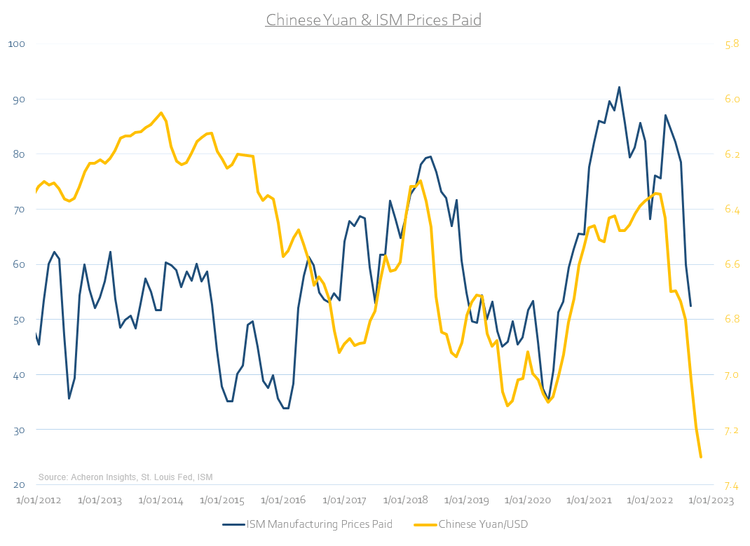
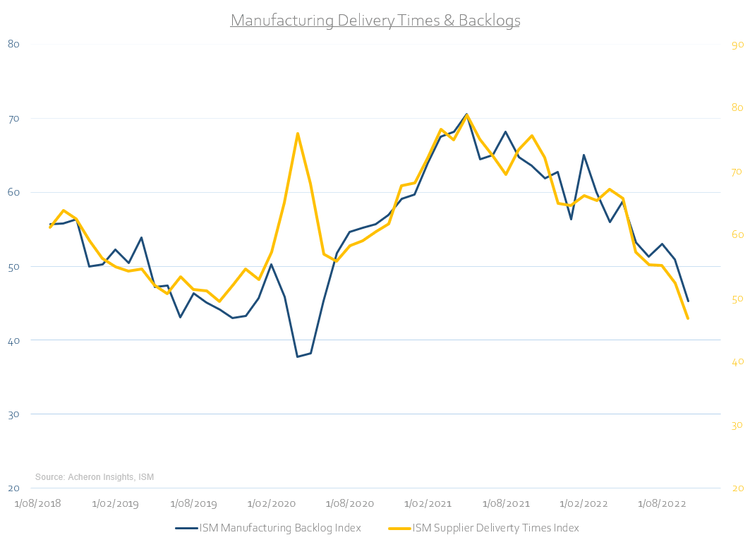
Likewise, supply chain constraints are now no longer a headwind for goods inflation. Shipping rates are normalising and nearing pre-COVID levels while manufacturing delivery times and order backlogs are now at or near their lowers levels in years.
Ole Hansen – Saxo Bank Acheron Insights, ISM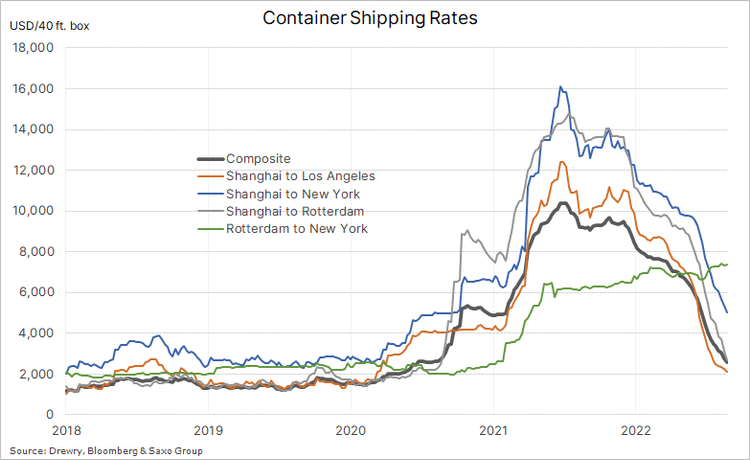
If we utilise the New York Fed’s Supply Chain Pressure Index as a gauge for overall supply chain pressures, the significant decline in this index points to severe goods disinflation over the next six months. Though by this measure supply chain pressures are still not yet at their pre-2020 levels.
Acheron Insights, St. Louis Fed, New York Fed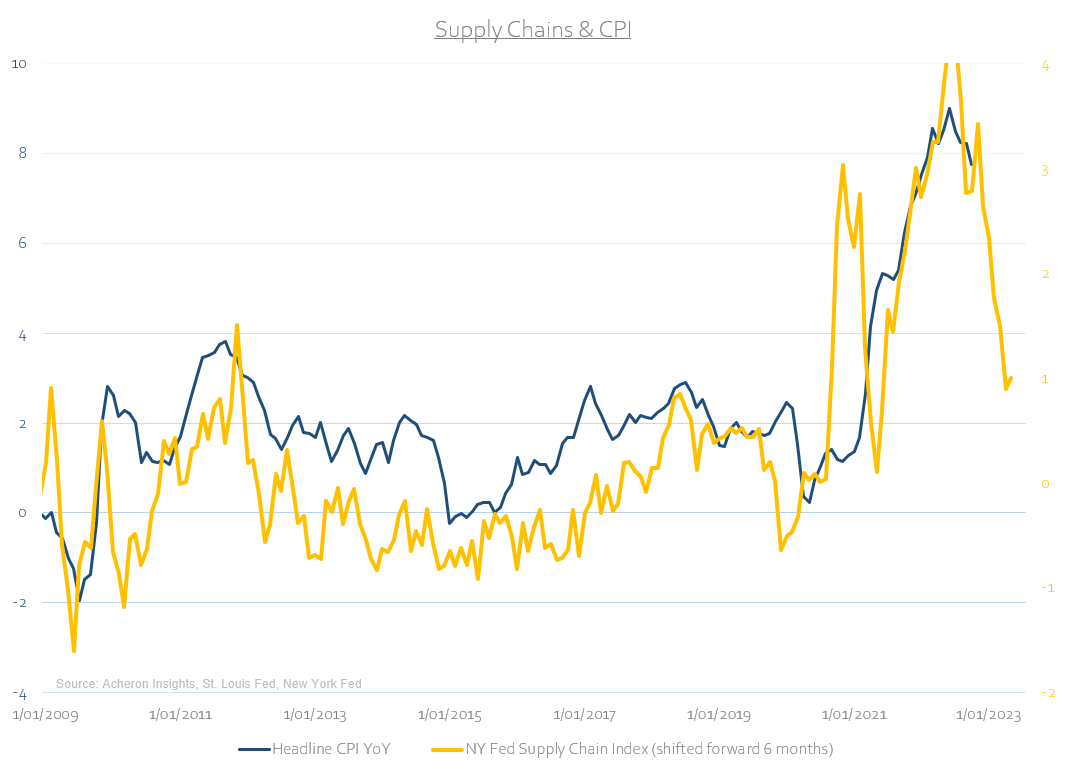
If we turn now to the dollar which is perhaps representative of all these dynamics in one, it is generally negatively correlated to inflation with a lead of around six to nine months. A higher dollar equates to greater import prices for US-based manufacturers, allowing the US to export inflation abroad. The dollar is also highly correlated with global growth and global trade given its status as the world’s reserve currency. When we see a slowdown in both we see a shortage of dollars worldwide and a subsequent appreciation of the dollar. The majority of the world’s trade invoicing is still denominated in dollars. The world needs dollars. And, when there is not enough, it is not good for growth or inflation.
Acheron Insights, St. Louis Fed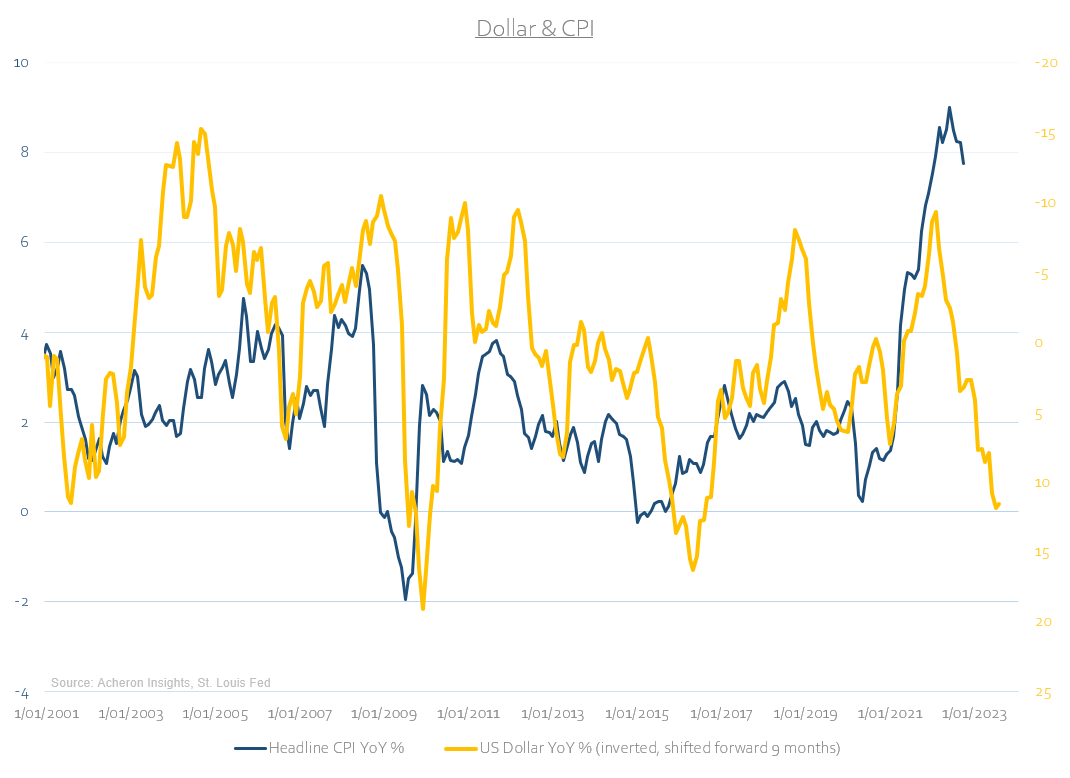
Whether we see outright deflation in some goods remains to be seen. But, one candidate for potential deflation is in used car prices. Used car inflation tracks the Manheim Used Vehicle Value Index closely with around a four-month lag, and with this index now in negative year-over-year growth territory, expect used car CPI to follow suit. However, given the used car component of CPI only constitutes around 3.8% of the headline number, the overall impact of used car deflation is likely to be minimal.
Acheron Insights, St. Louis Fed, Manheim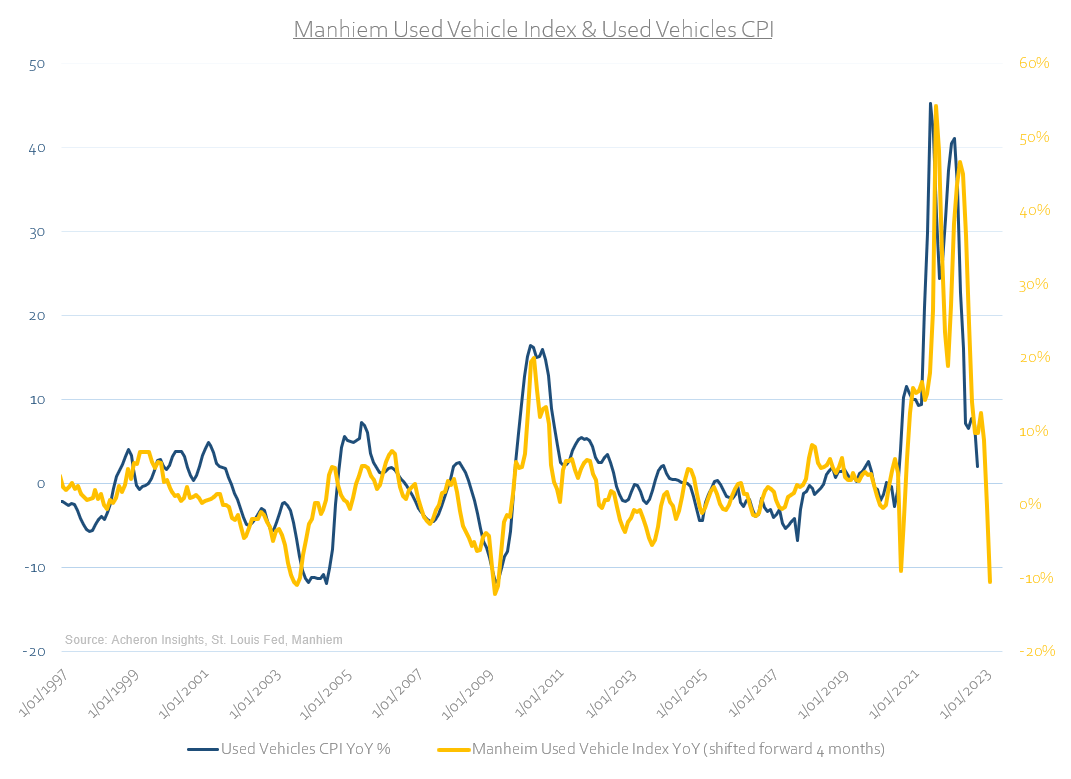
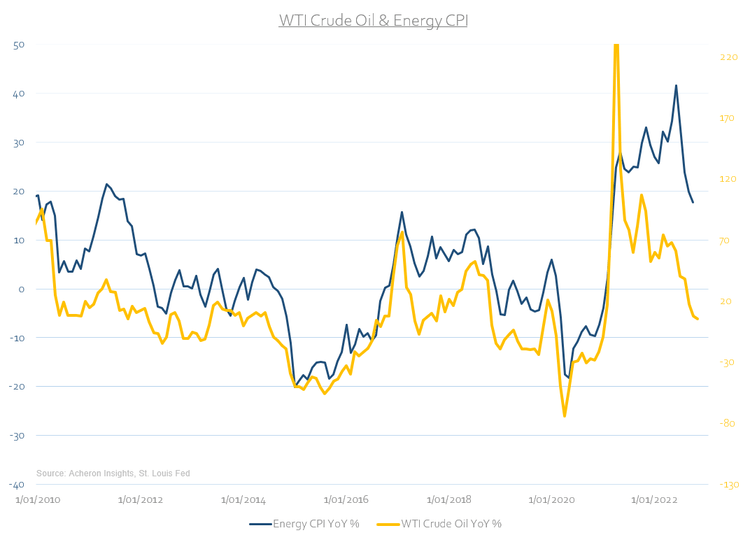
What is impactful and will continue to be so over the coming months is the trend lower in food and energy inflation. Energy disinflation has been the biggest contributor to the recent deceleration in headline CPI, and, given how closely energy inflation is tied to US gasoline prices as well as crude oil prices, energy CPI is likely to continue lower over the short term at the very least.
Acheron Insights, St. Louis Fed Acheron Insights, St. Louis Fed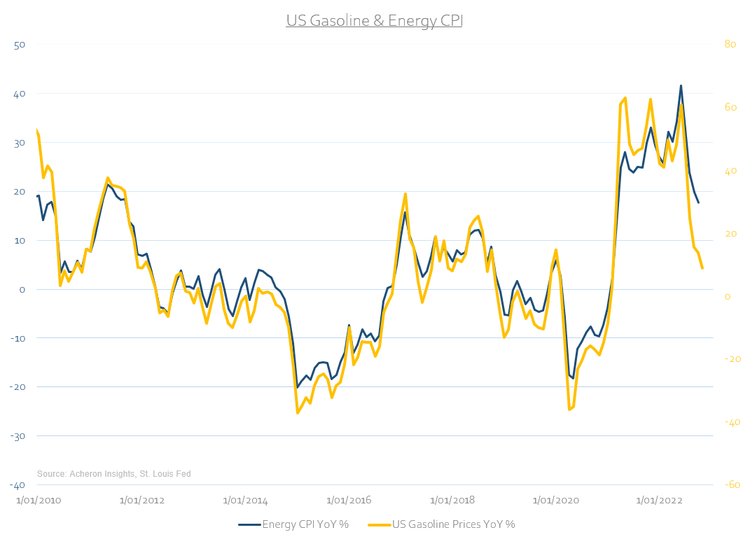
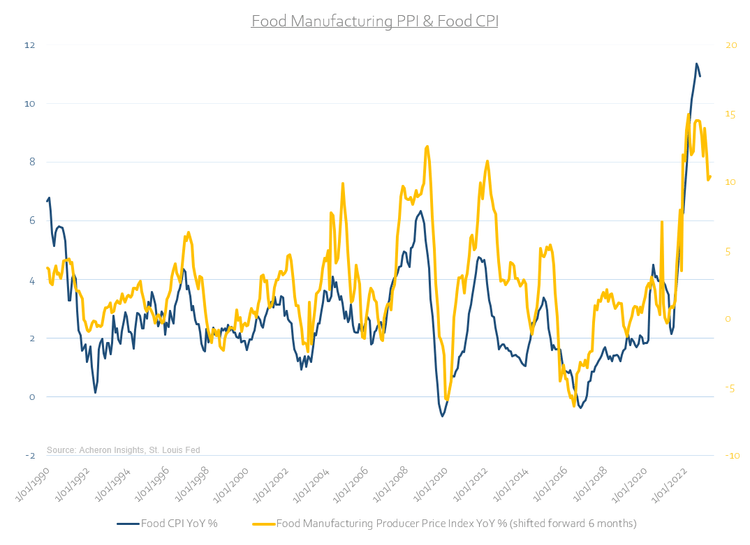
Food on the other hand is yet to materially move lower, but according to the leading indicators of food inflation, it could well be one of the largest drivers of disinflation in headline CPI over the next six months. Both the FAO Food Price Index and the Food Manufacturing Producer Price Index have historically provided a solid lead for the food CPI by around eight and six months respectively. Both are beginning to decelerate and as a result, food price inflation should follow suit.
Acheron Insights, St. Louis Fed, FAO Acheron Insights, St. Louis Fed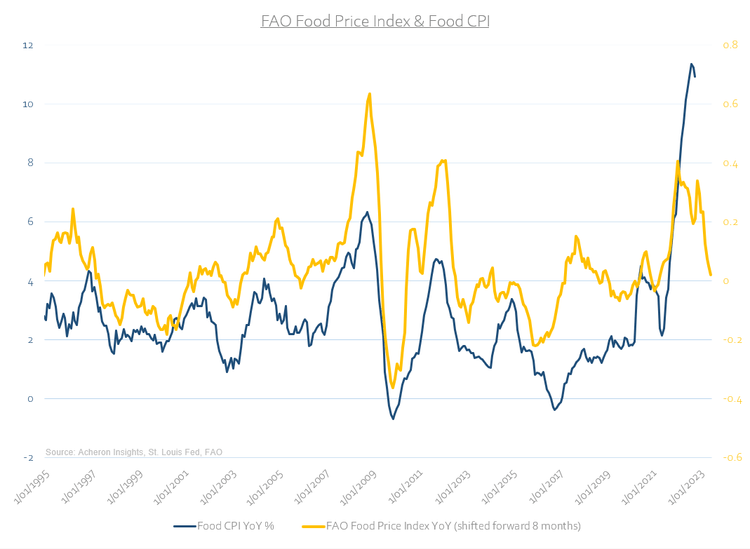
When it comes to actually measuring inflation, what matters most is the direction of the rate of change. In determining the rate of change, base effects have significant implications. A $50 increase in crude oil from $50 to $100 matters a lot more from a rate-of-change perspective than a move from $100 to $150 and thus will have a significantly lower impact on inflation, despite both being a $50 increase. As we can see below, for energy inflation in particular the base effects are now a significant headwind to higher inflation and will likely result in continued disinflation for goods even if prices continue going up. This will be the case for at least the first half of 2023.
U.S. Bureau of Labor Statistics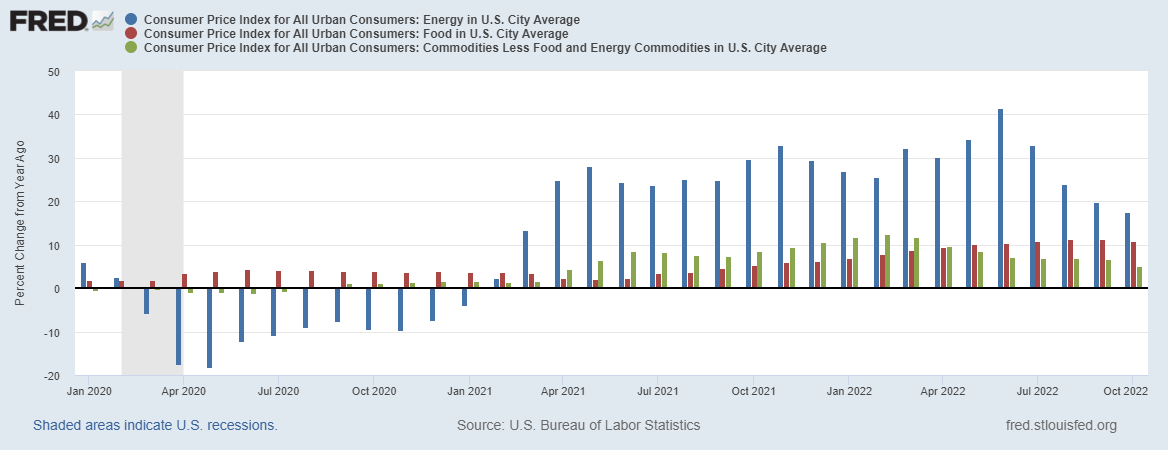
Services Inflation is likely to be sticky, but the signs of a top are there
While it is evident goods inflation is in the process of peaking and on its way to a material bout of disinflation over the next six to 12 months, things are far less sanguine for services inflation.
Often ignored and overlooked services inflation matters. Though much less volatile than goods inflation, it tends to be sticky. Making up around 57% of the headline CPI basket, the direction of services inflation generally determines the overall trend in inflation. If services inflation does not move lower in a material way in the next six months, it will be very difficult for inflation to get anywhere near the Fed’s targeted range of 2%.
The primary constituent of services inflation is Shelter, which itself is primarily made up of Rent of Primary Residence (7% of headline CPI) and Owners’ Equivalent Rent (24% of headline CPI). Other notable subcategories of the services CPI are Medical Care Services (6.9% of headline CPI), Transportation Services (5.9%), Recreation Services (3%), and Education Services (5.3%) along with a number of other sundries.
Clearly, shelter inflation is the most important variable for not only services inflation, but CPI as a whole. When it comes to forecasting the direction of shelter inflation, both the Rent and Owners’ Equivalent Rent subcomponents, there are a number of solid leading indicators. While useful, these leads tend to be long and variable. It is thus very difficult to determine the actual inflection points for shelter inflation.
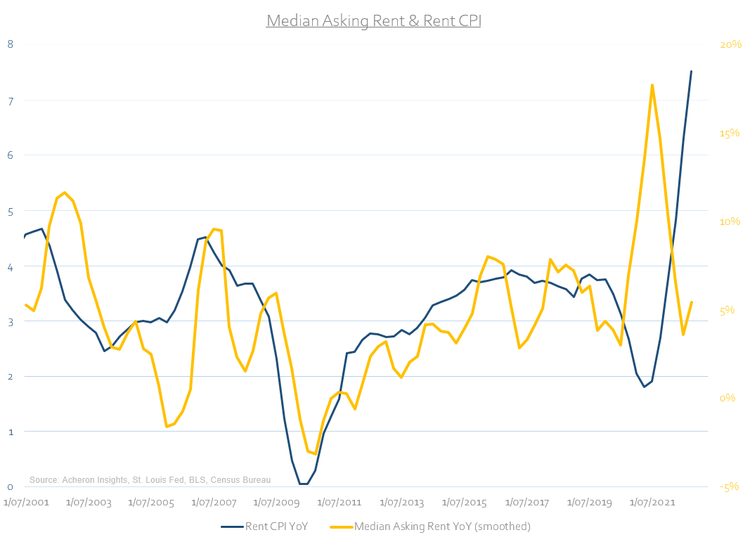
In terms of Rent inflation, the Zillow Observed Rent Index (ZORI) and Census Bureau’s Median Asking Rent both tend to lead Rent CPI. As we can see below, both the ZORI and Median Asking Rent have declined materially over the past few months. Rent inflation will follow suit eventually, but it is likely not for some time still until we see a material deceleration.
Acheron Insights, St. Louis Fed, Zillow Acheron Insights, St. Louis Fed, BLS, Census Bureau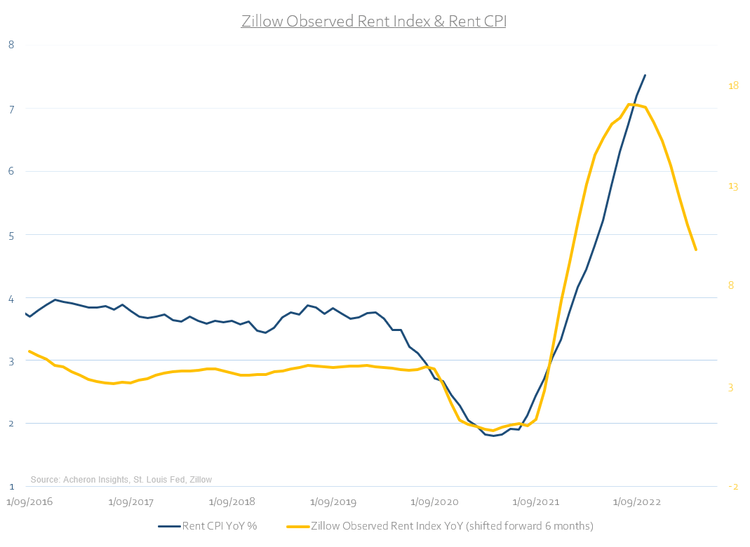
Much of the variable lag from Rent inflation to the ZORI is a result of the former being made up of around 80% new leases and 20% renewed leases, whilst the ZORI only considers new leases. As noted by 3Fourteen Research’s Warren Pies, though new lease prices are likely to inflect lower per the ZORI, renewed leases are generally slower to respond to changes in new lease prices and are likely to act as a minor drag on Rent inflation for some time still.
Another excellent leading indicator of Rent inflation (and services inflation as a whole, as we will see shortly) is wage growth. When it comes to the direction of rental prices, though house prices play a significant role, it is wage growth that perhaps matters most. Ultimately, landlords will adjust rents in line with what the tenants can afford. Fortunately, we are slowly seeing signs of peaking wage growth. The latter will eventually show up in rent inflation, though this is a story for 2023.
Acheron Insights, St. Louis Fed, Atlanta Fed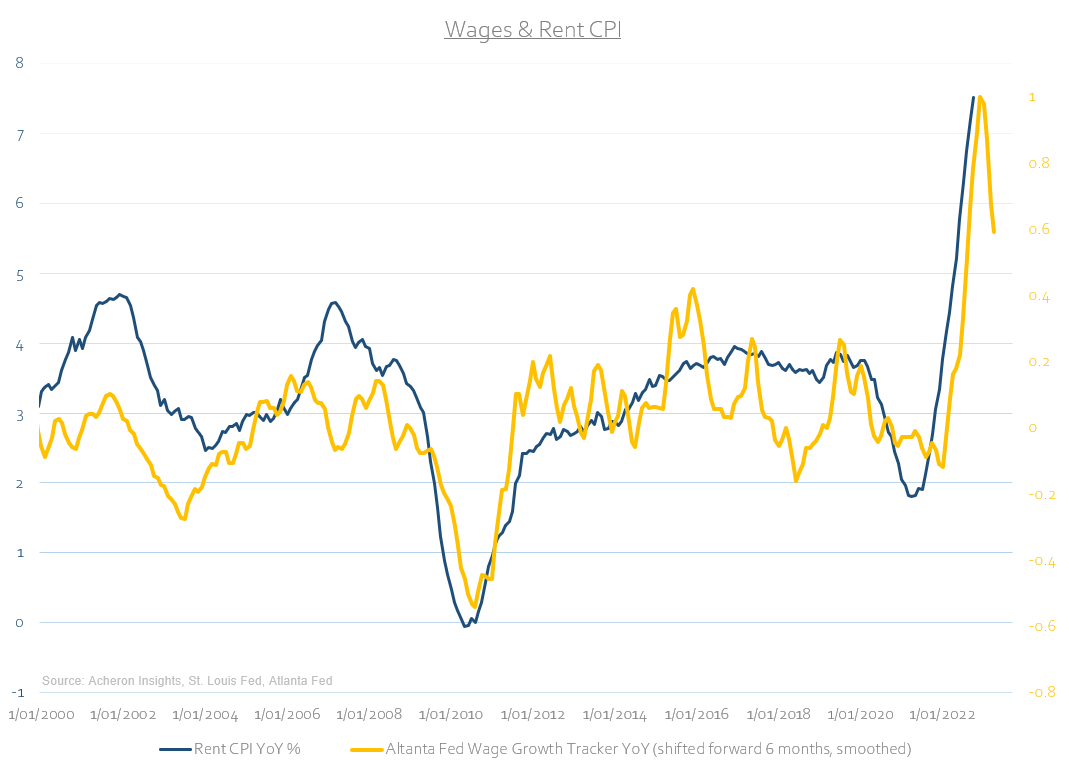
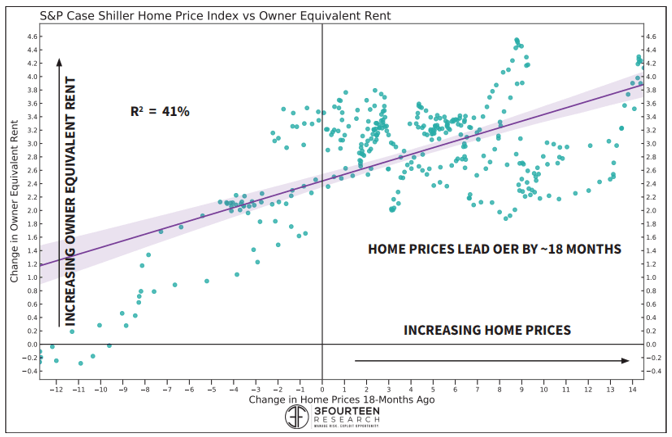
Where house prices do play a significant role is in the Owners’ Equivalent Rent (OER) component of CPI. As we can see below, house price growth tends to provide a good read on OER inflation by around 12-18 months in advance. The good news is house prices are contracting (and are likely to continue to do so, as I opine here). The bad news is the lag between house price growth and OER inflation is long and variable. As such, OER inflation, the biggest component of CPI, is likely to continue to accelerate for some months still and any material decline is unlikely to occur for at least another two quarters. Again, this is a story for 2023.
Acheron Insights, St. Louis Fed 3Fourteen Research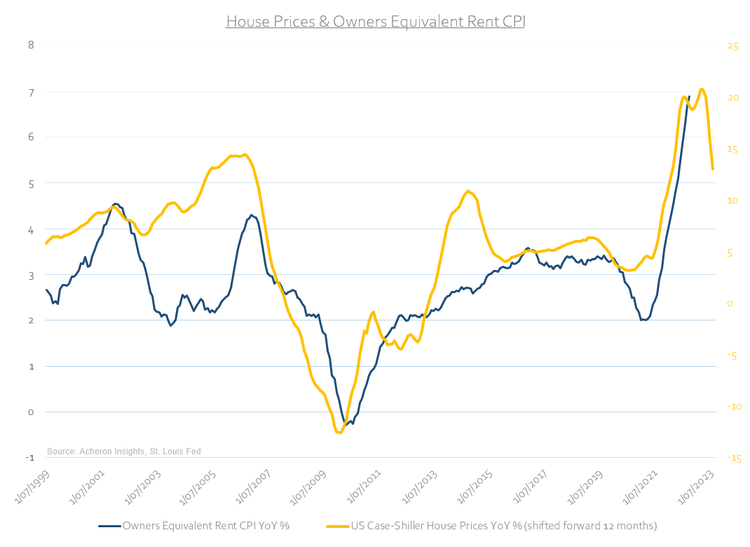
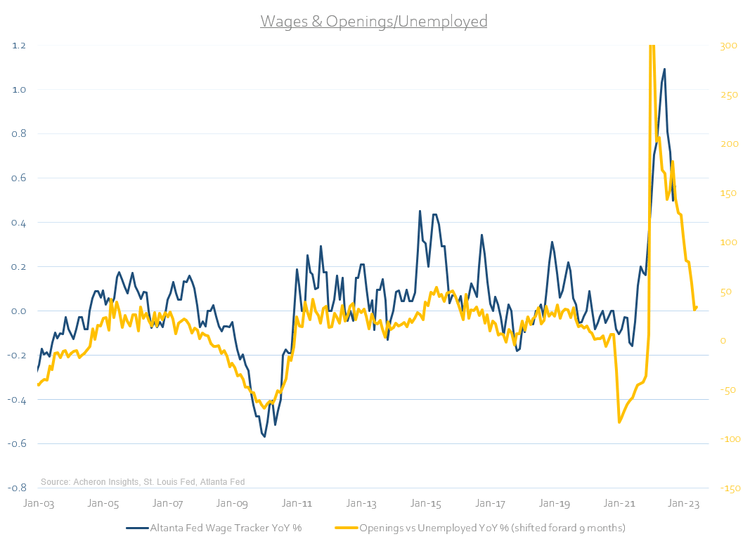
Outside of house price growth, what will matter for services inflation as a whole is wage growth. As I mentioned, wage growth is beginning to roll over as wages look to be peaking on an absolute basis (a dynamic that has been on the cards for a while now), and as such this will eventually begin to show up in the services CPI data.
Acheron Insights, St. Louis Fed, Atlanta Fed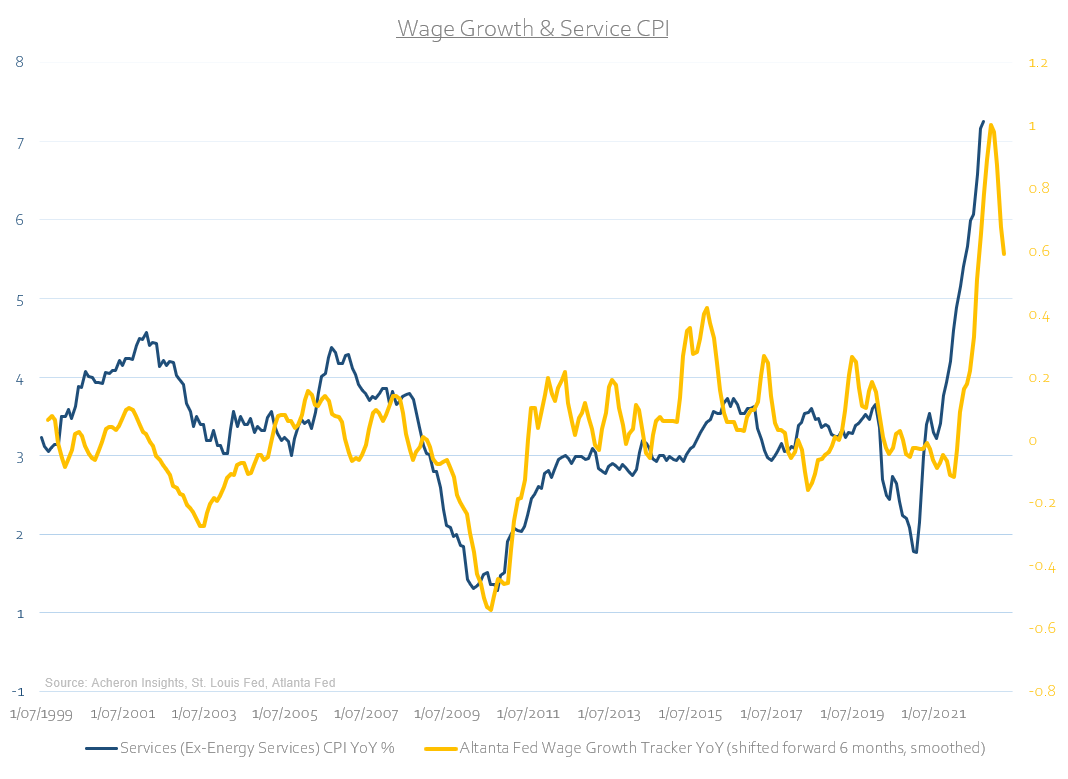
We could actually see a material decline in wage growth in Q1 of next year. Once again, however, given the lags between the leading indicators of wage growth, the actual movements in wage growth and thus services inflation, don’t expect this to show up in the CPI data any time soon.
Acheron Insights, St. Louis Fed, Atlanta Fed Acheron Insights, St. Louis Fed, Atlanta Fed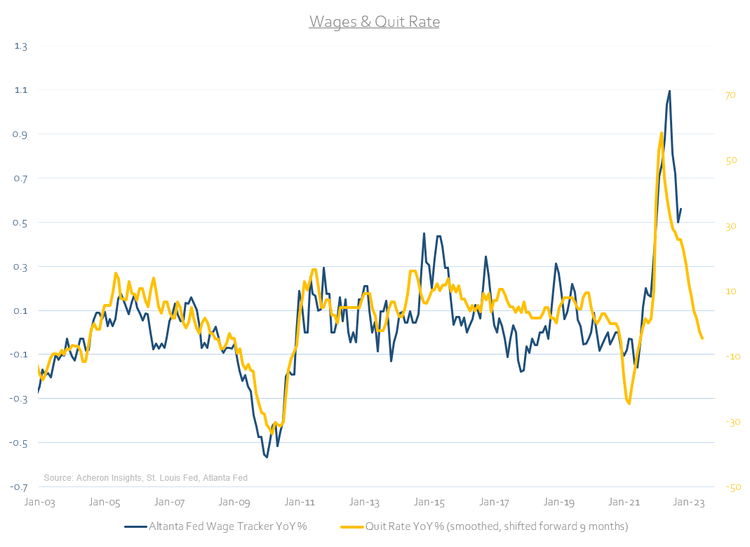
While there are constructive signs for services inflation suggesting it could peak in the months ahead, we are not there yet.
Why inflation may be stickier than expected
While everyone is pointing to a material decline in goods inflation, few are asking the question: “What if inflation is far stickier than expected?” Indeed, supply chain bottlenecks and freight rates have collapsed, demand is plummeting and goods inflation is rolling over. This is all very true, but it misses the point. The huge spike in goods over services consumption we saw during lockdown is reversing, and since mid-2021, consumption trends have very much favoured services over goods.
Acheron Insights, St. Louis Fed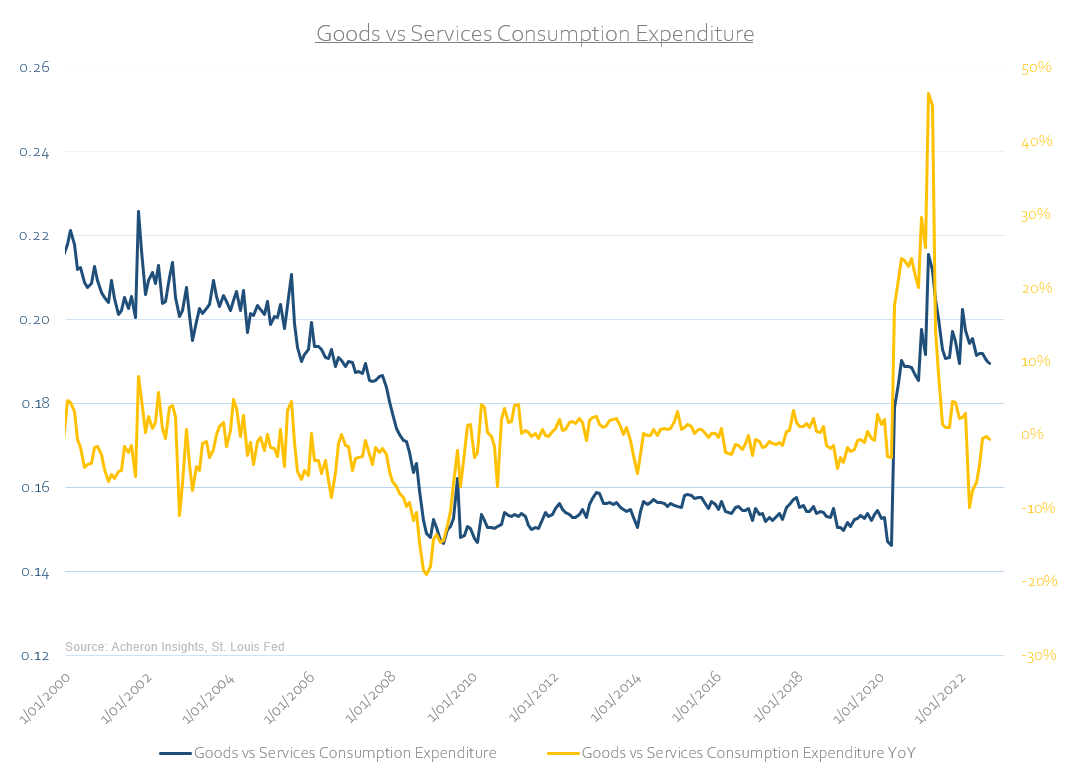
Gerard Minack, one of the best macro minds in the business, highlighted this important dynamic in a recent interview with Grant Williams and Bill Fleckenstein. Noting, “why this matters is if you spend a dollar less on goods and a dollar more on services, that’s GDP neutral, but it is not labour market neutral because services are much more labour intensive. This will continue to drive services inflation despite the current goods inflation.”
What matters more for inflation? Goods inflation or services inflation? Unfortunately, it is the latter. As I have mentioned, services inflation makes up nearly two-thirds of the CPI basket. Not only do services inflation, therefore, define the overall trend (with the goods components driving the volatility), but services inflation is generally far stickier than goods inflation. Should it remain sticky over the next six to 12 months, expect inflation to stubbornly persist anywhere from the 4-6% level. This is a number far above the Fed’s desired target.
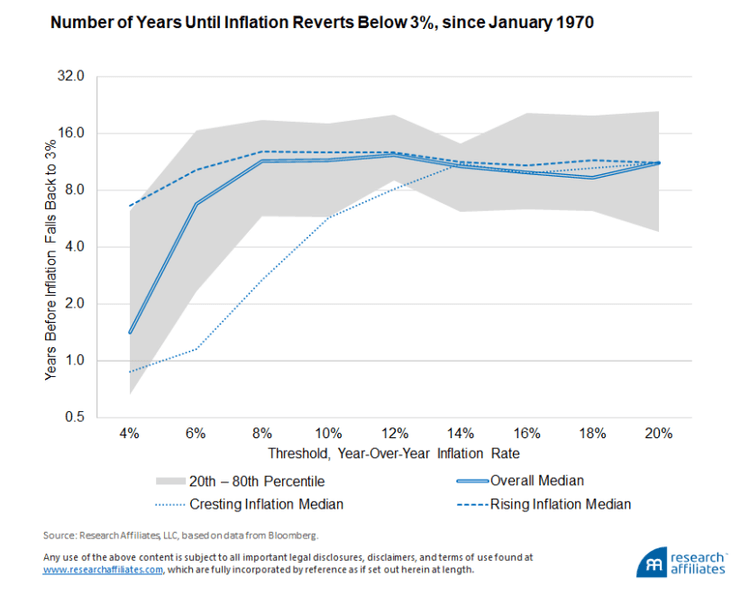
While history does not repeat, we can use history as a guide to assess just how long inflation may take to revert back to an acceptable level. In a recent analysis on the historical stickiness of inflation undertaken by Research Affiliates, when starting from a 6% level, “the median number of years for inflation to fall back below 3% has been seven and a half years. From inflation levels of 8% to 20%, the median span required to bring inflation below 3% is from nine to 12 years.” Though I suspect a recession in 2023 will bring inflation down sooner than history suggests, these numbers are shocking nonetheless. We must consider the possibility of significantly sticky inflation.
Research Affiliates Research Affiliates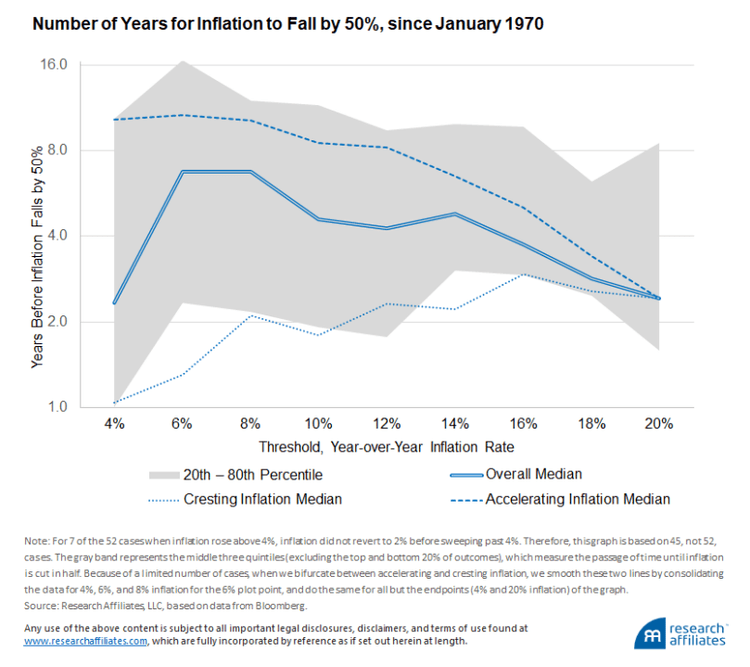
And if it is sticky?
Policymakers won’t like sticky inflation, and neither will the stock market. The Fed won’t be able to declare victory until we see services inflation decline meaningfully. This is unlikely to occur with the labour market remaining as tight as it is. The inflation momentum is still too strong.
Indeed, through observing the momentum of various measures of inflation below, though headline CPI momentum appears to be inflecting lower, this is not yet the case for the stickier measures of inflation in Core CPI, Sticky Prices CPI, Trimmer Mean PCE or Core PCE.
Acheron Insights, St. Louis Fed, BLS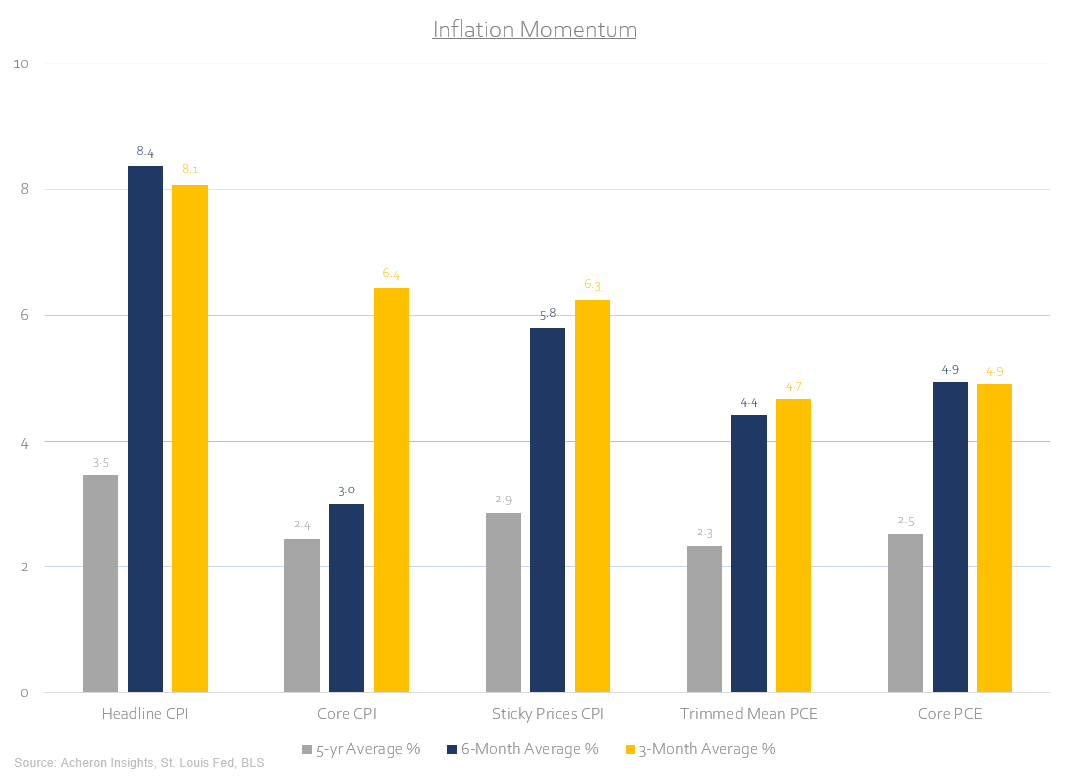
Unfortunately, until we see inflation momentum across the board begin to trend lower, do not expect any form of a dovish pivot from the Fed. Yes, they may cease hiking rates in the months ahead as the economic toll begins to assert itself in the data, but even holding the policy rate at a higher level for a sustained period of time is an incremental tightening and represents a very different set of monetary conditions that markets have been accustomed to for some time. Though I am hoping for one, I do not see a soft landing being a realistic possibility.
Everyone knows inflation is going down, it is now a matter of how far it goes down and how sticky it remains.
Be the first to comment