


Ibrahim Akcengiz
Accommodative monetary policy and highly stimulative fiscal policy during the pandemic contributed to the current bout of inflation. Monetary policy is tightening, while fiscal policy is trying to grapple with the political cost of hurting consumers. Recent data has probably reinforced the Federal Reserve’s world view, and further tightening of monetary policy seems likely. The global economy is already showing signs of weakness and there are indicators of increasing financial stress. A recession does not appear to be priced into equity markets though, creating further downside risk.
Monetary Policy
The Federal Reserve has rapidly increased interest rates this year and appears set to continue large rate hikes. Equity markets have been grappling with what the terminal rate will be and hence what a fair valuation for the market is. While interest rates may appear fairly low relative to the highly abnormal 1970s-1980s period, they are now in a fairly normal range for the 20th century. There seems to be a narrative that once inflation exceeds 5%, interest rates must be raised higher than the inflation rate if inflation is to be tamed. There is also an expectation that once inflation reaches these levels it takes many years to normalize. These generalizations are based off one event in the 1980s that really has no relevance to the current situation.
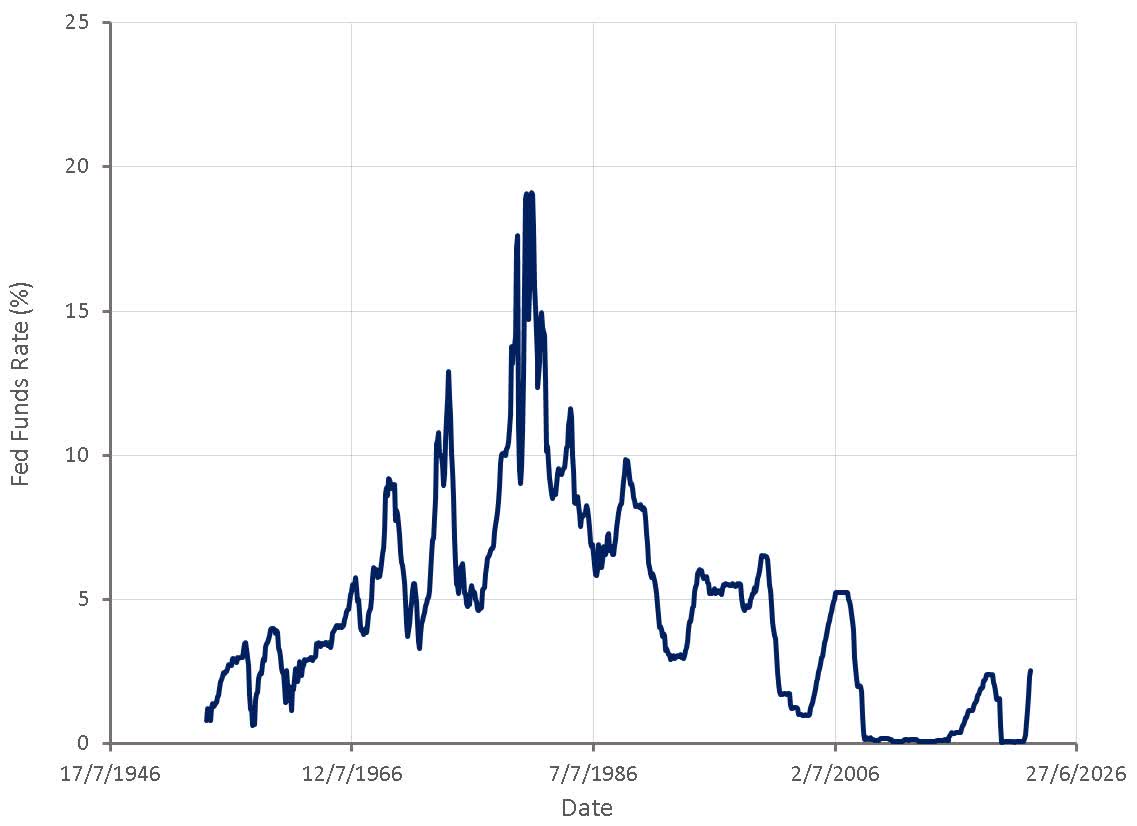
Figure 1: Fed Funds Rate (source: Created by author using data from The Federal Reserve)
It should also be noted that relative to inflation expectations, bond yields are relatively high, indicating that financial conditions are tighter than they appear on the surface. This tightening has only really occurred in the last few months though and its impact will not be felt until next year. The Fed appears intent on enacting pro-cyclical monetary policy (loose when the economy is booming and tight entering a recession), which has contributed to inflation, asset price distortions, volatility and will likely contribute to financial stress and a recession.
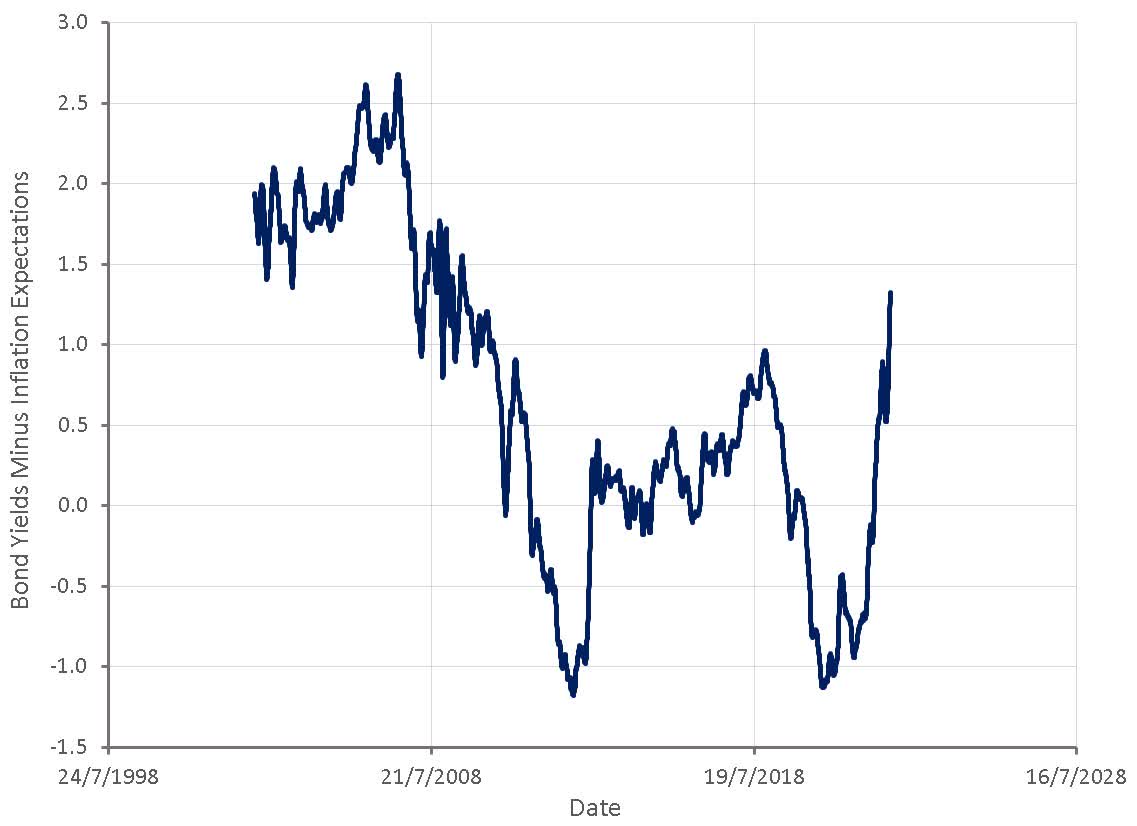
Figure 2: Bond Yields Minus Inflation Expectations (source: Created by author using data from The Federal Reserve)
The Federal Reserve is also in the process of reducing the size of their balance sheet, undoing some of the quantitative easing that occurred through the pandemic. Quantitative easing is aimed at controlling long-term interest rates and hence quantitative tightening should be expected to primarily influence longer-term rates.
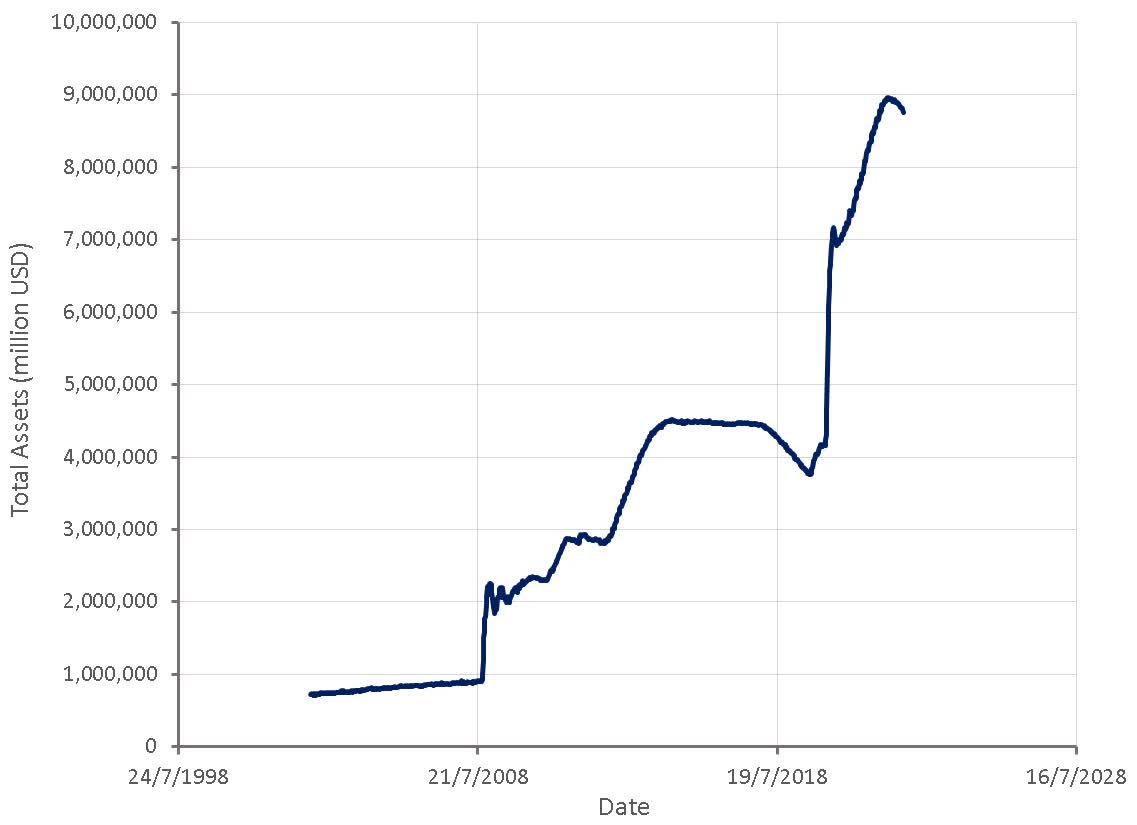
Figure 3: Federal Reserve Total Assets (source: Created by author using data from The Federal Reserve)
Tightening monetary policy, along with a rapidly cooling economy has meant that the pace at which the money supply is growing has contracted significantly.
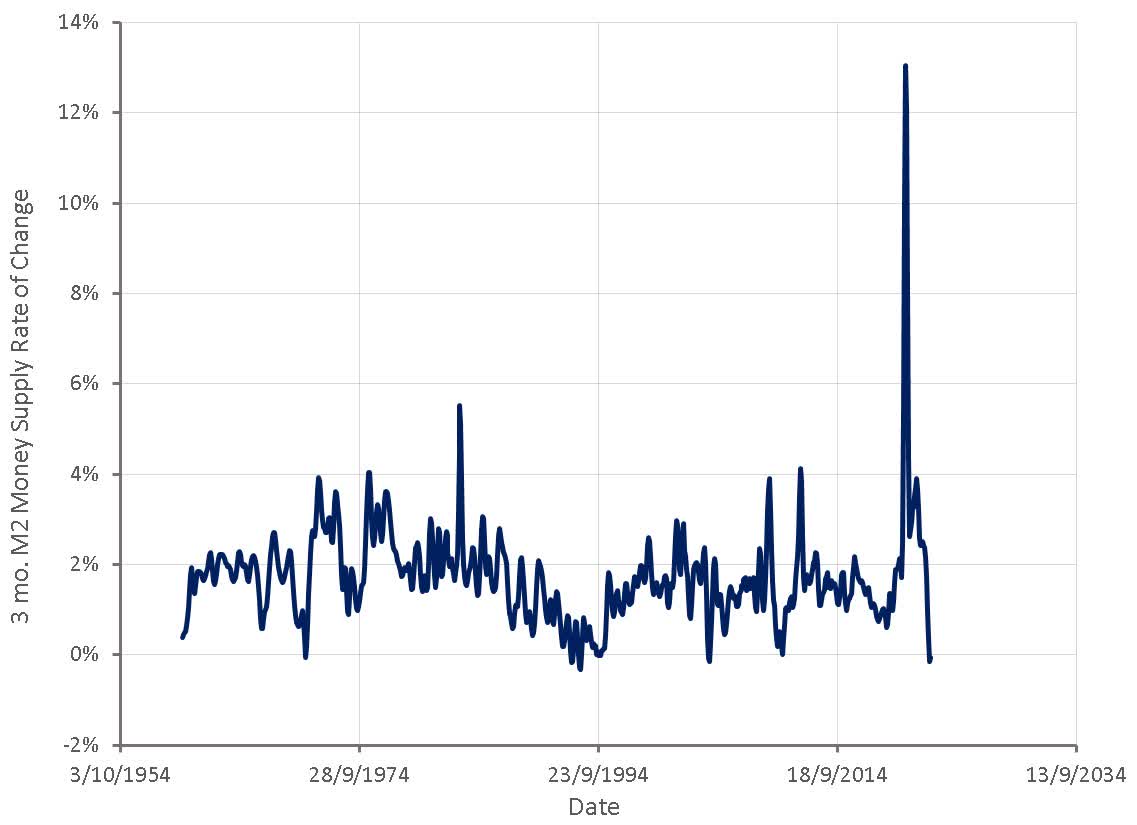
Figure 4: 3 Month M2 Money Supply Rate of Change (source: Created by author using data from The Federal Reserve)
Debt Levels
It is meaningless to compare current monetary policy with past monetary policy without considering the high debt levels in most developed economies. Most developed economies are now characterized by aging populations with low population growth and governments that contribute a significant share of economic activity. The recent rise in interest rates is completely unprecedented in highly leveraged economies and hence the impact is uncertain. While many people / businesses / governments have locked in lower interest rates long-term, new financing at current levels will be extremely difficult for many.
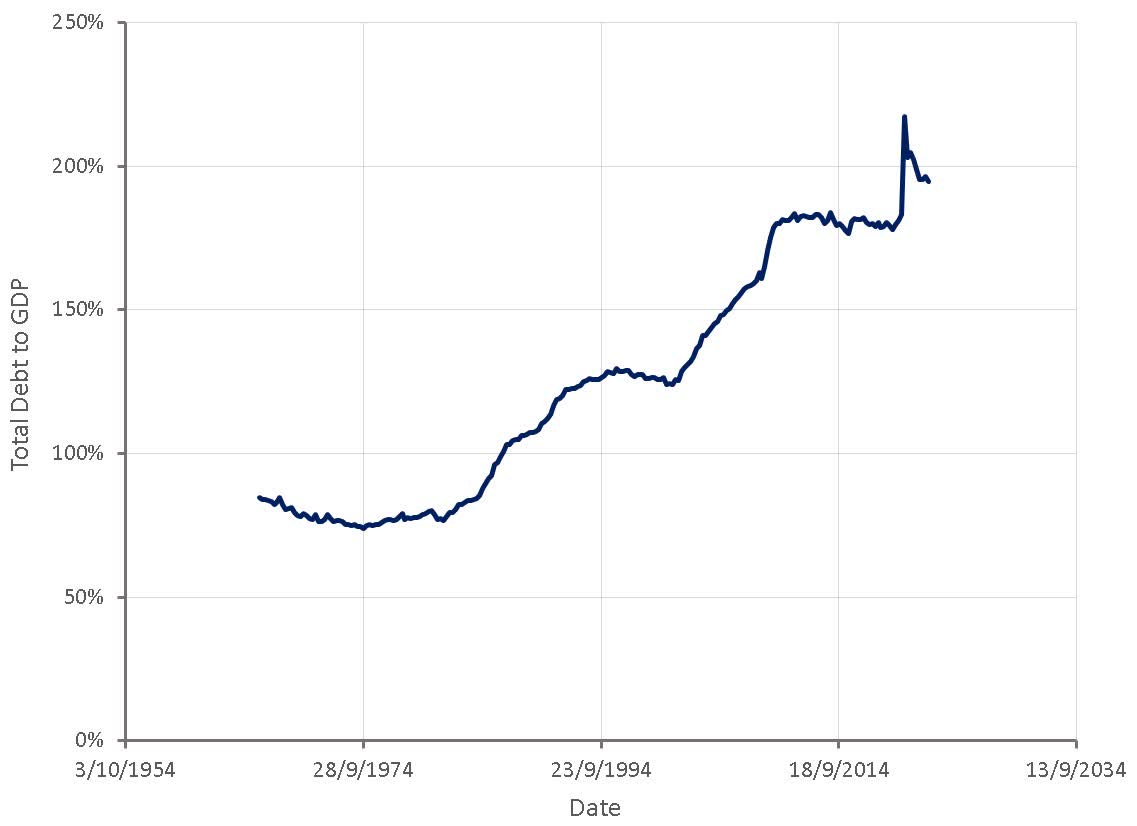
Figure 4: US Total Federal Debt + Household and Non-Profit Organization Debt Securities and Loans to GDP (source: Created by author using data from The Federal Reserve)
Financial Conditions
Cracks are already beginning to show, with financial conditions as tight as they have been over the past 30 years outside of crisis periods. The Chicago Fed’s National Financial Conditions Index is based on financial conditions in money markets, debt and equity markets and the traditional and “shadow” banking systems.
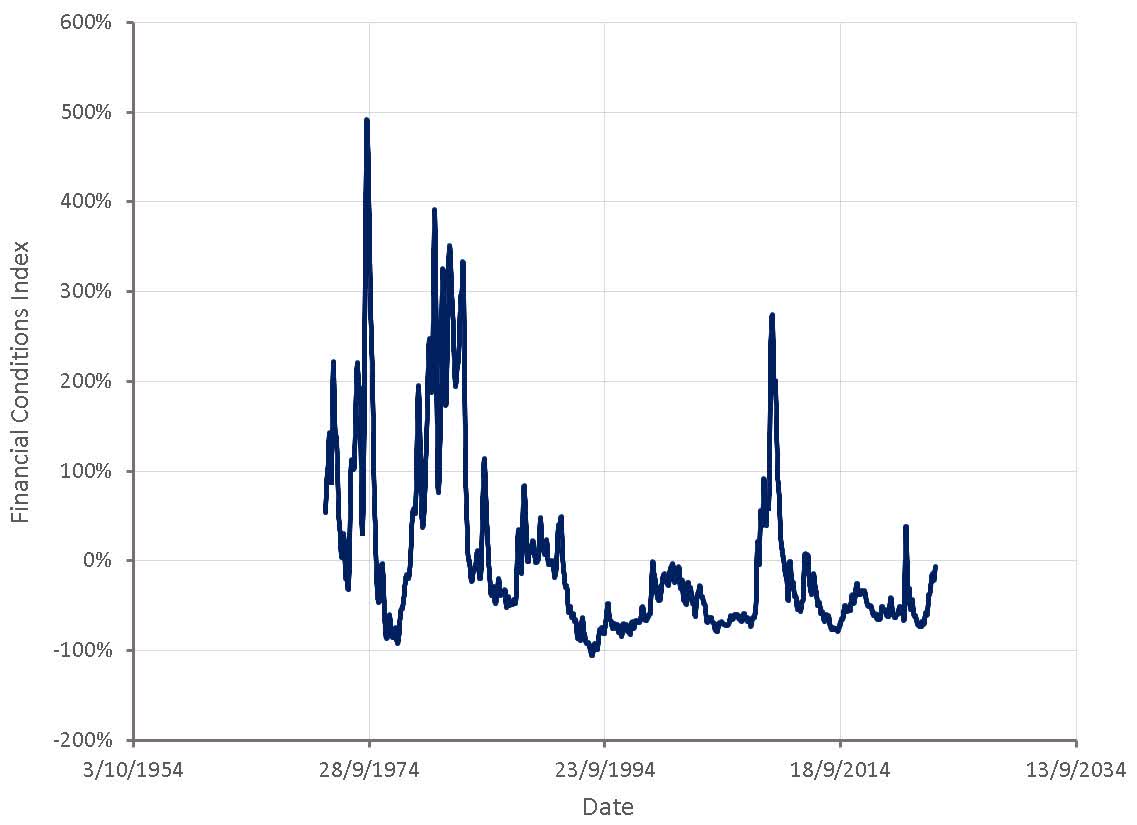
Figure 5: Chicago Fed National Financial Conditions Index (source: Created by author using data from The Federal Reserve)
Indicators of financial stress are also rising and appear set to rise further as economic fundamentals deteriorate and monetary policy continues to tighten. The OFR Financial Stress Index is constructed from 33 financial market variables across five categories (credit, equity valuation, funding, safe assets and volatility).
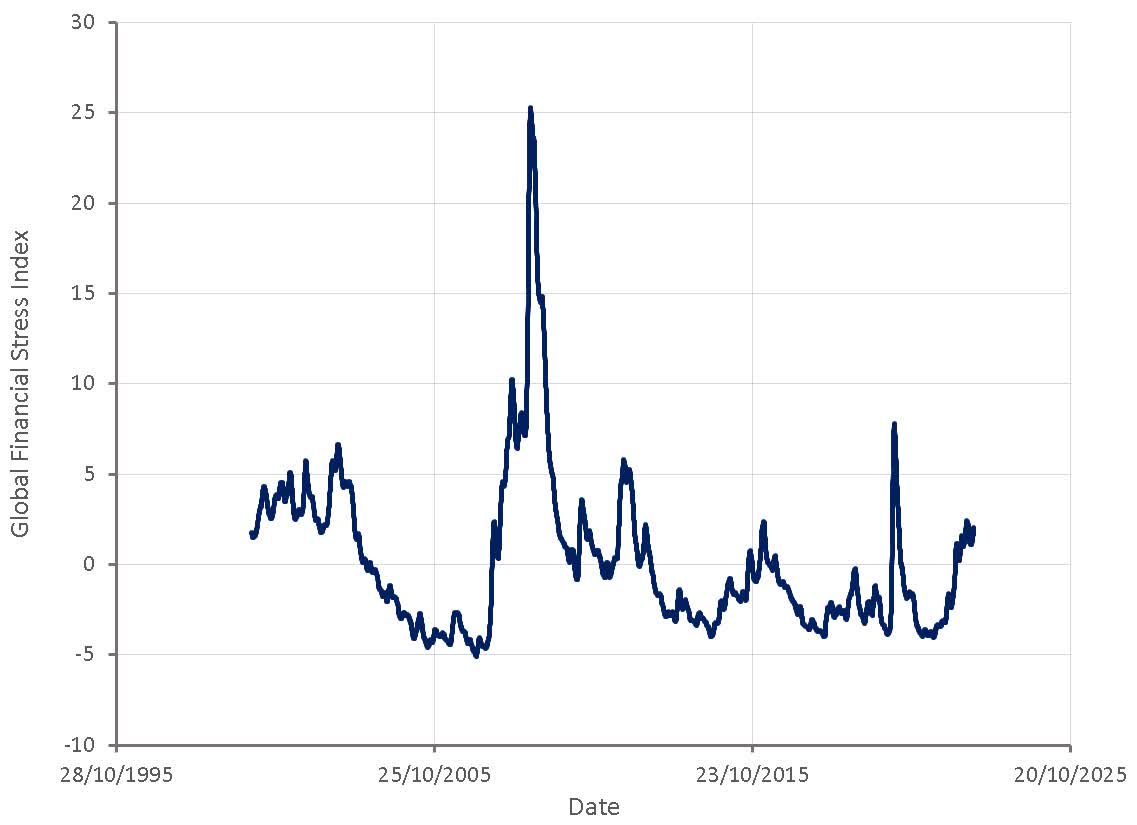
Figure 6: Global Financial Stress Index (source: Created by author using data from The Federal Reserve)
Phillips Curve
Monetary policy appears to be focused on labor market conditions and the possibility of a wage-price spiral. Despite wage growth continuing to moderate, belief in the Phillips curve, and the potential for low unemployment to drive wage growth, may spur central banks to tighten policy further.
It is debatable to what extent there is actually a relationship between unemployment and wage growth though. Past data certainly does not support the existence of a strong relationship. Proposed reasons for this include:
- Inflation expectations impacting wage growth
- Globalization providing access to alternative pools of cheap labor
- Non-stationary relationship
- Non-linear relationship
The unemployment rate is a poor indicator of labor market tightness and hence it is not surprising it is not predictive of wage growth. The labor force participation rate also needs to be considered as there is potential labor that has been discouraged out of the labor force by a lack of prospects. Quit rates are also indicative and far more predictive of wage inflation. These have been elevated over the past 12 months, but are beginning to return to more normal levels.
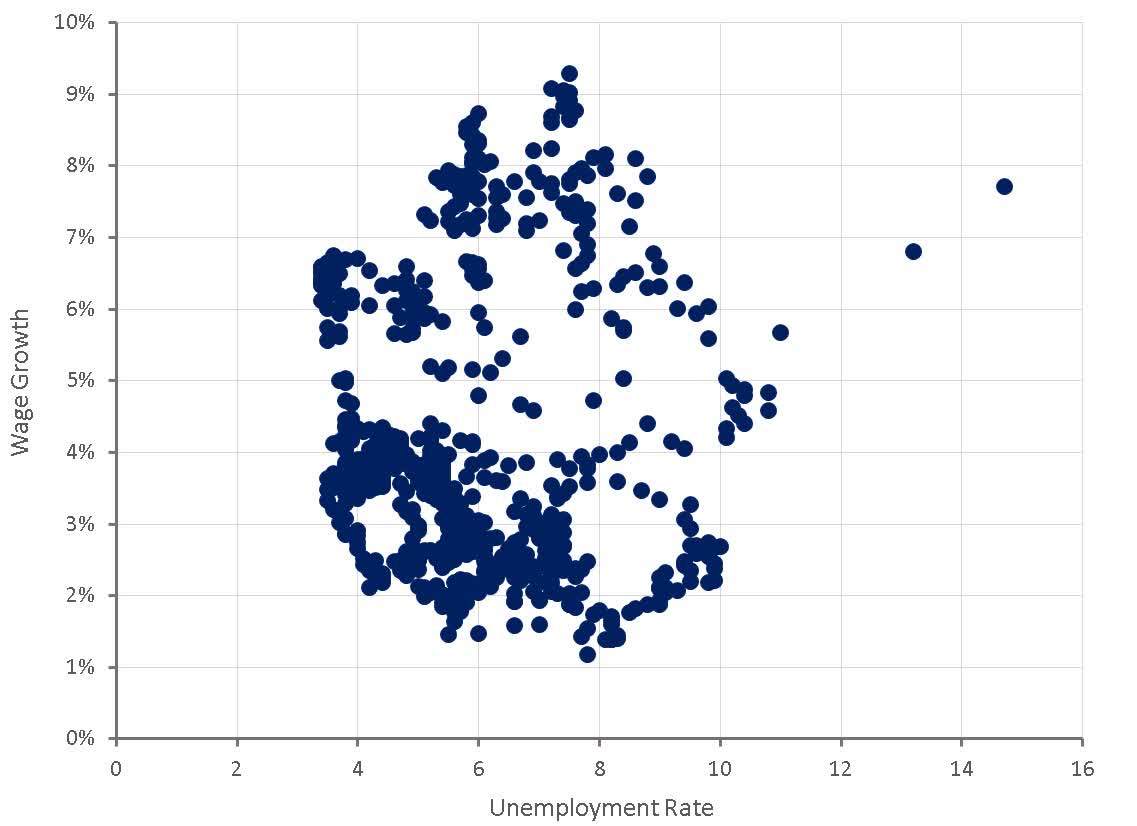
Figure 7: US Phillips Curve (source: Created by author using data from The Federal Reserve)
Beveridge Curve
The Federal Reserve is also likely basing policy off the Beveridge Curve, and may believe that they can still achieve a soft landing while job openings remain high and the unemployment rate remains low. The expectation is that when the unemployment rate is low and the number of job vacancies is high, wage inflation increases, as it is harder to fill open positions. Under these conditions, if economic activity can be reduced slightly, wage growth can be reduced without significantly impacting the unemployment rate.
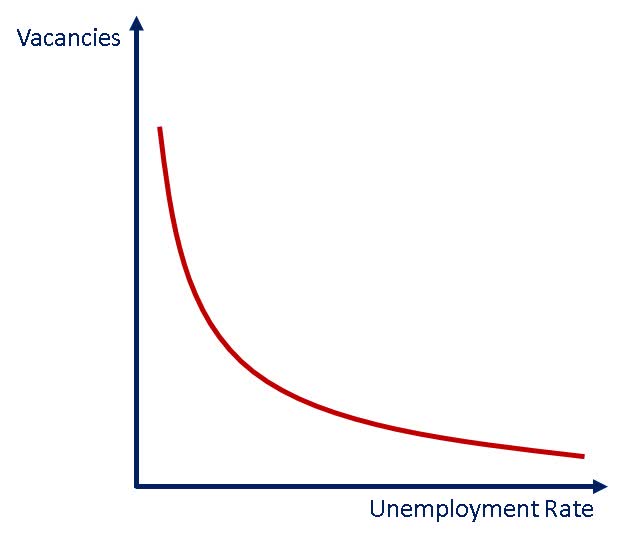
Figure 8: Illustrative Beveridge Curve (source: Created by author)
The Fed was likely encouraged by recent data that showed a large drop in job openings and a low unemployment rate. Interest rates appear set to rise until the number of job openings has normalized and the unemployment rate begins to increase.
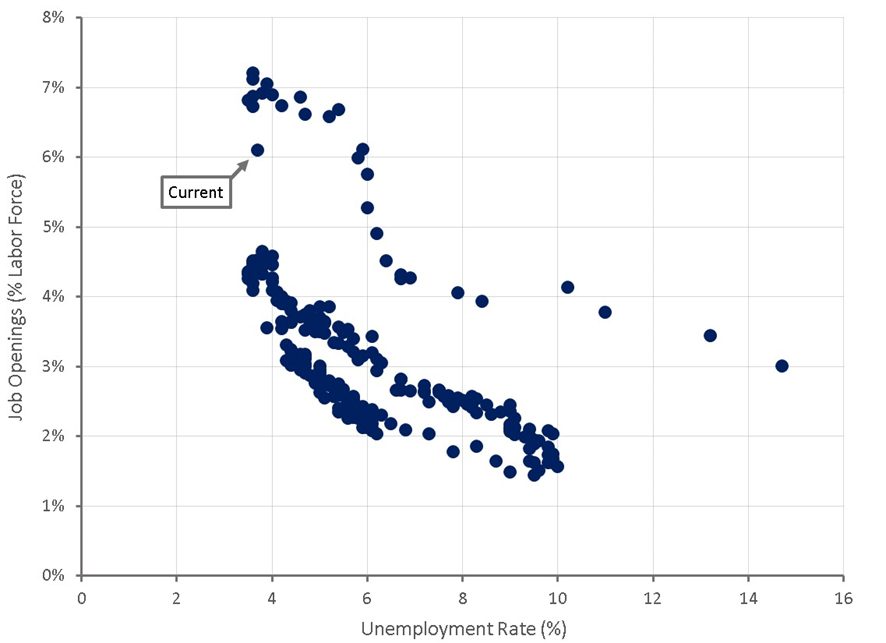
Figure 9: US Beveridge Curve (source: Created by author using data from The Federal Reserve)
The validity of these numbers should be questioned though. The labor force participation rate remains below pre-pandemic levels and significantly below the peaks of the late 90s. There is also concern that the number of job openings is not truly reflective of employment opportunities due to potential double counting of openings and a lack of hiring intent. Declining labor productivity also raises the specter of businesses hoarding labor they do not need due to fear of a tight labor market. If this is a case, an economic slowdown could cause an unexpectedly large increase in layoffs.
Aside from potential issues with the estimation of job openings and the unemployment rate, it is doubtful that monetary policy is precise enough to cool economic activity without overshooting and creating a large amount of unemployment.
Structural Fiscal Inflation
Weighed against tighter monetary policy is the impact of fiscal policy, which appears set to try and protect the voter base from economic hardship in the leadup to elections. While fiscal policy is no where near as expansionary as it was during the pandemic, governments seem intent on enacting policies that contribute to inflationary pressures. The inability to formulate good policy and allow the voter base to suffer hardship where necessary is probably the biggest upside risk to inflation in coming years.
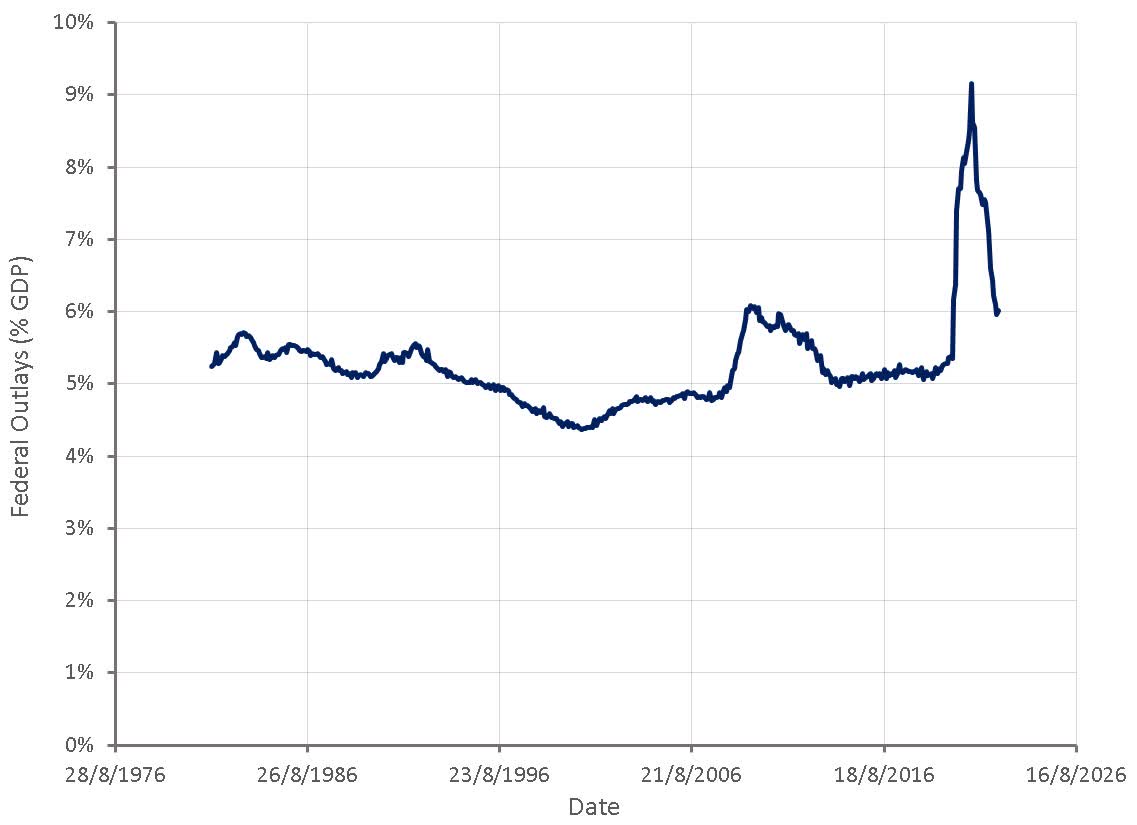
Figure 10: Federal Outlays (% GDP) (source: Created by author using data from The Federal Reserve)
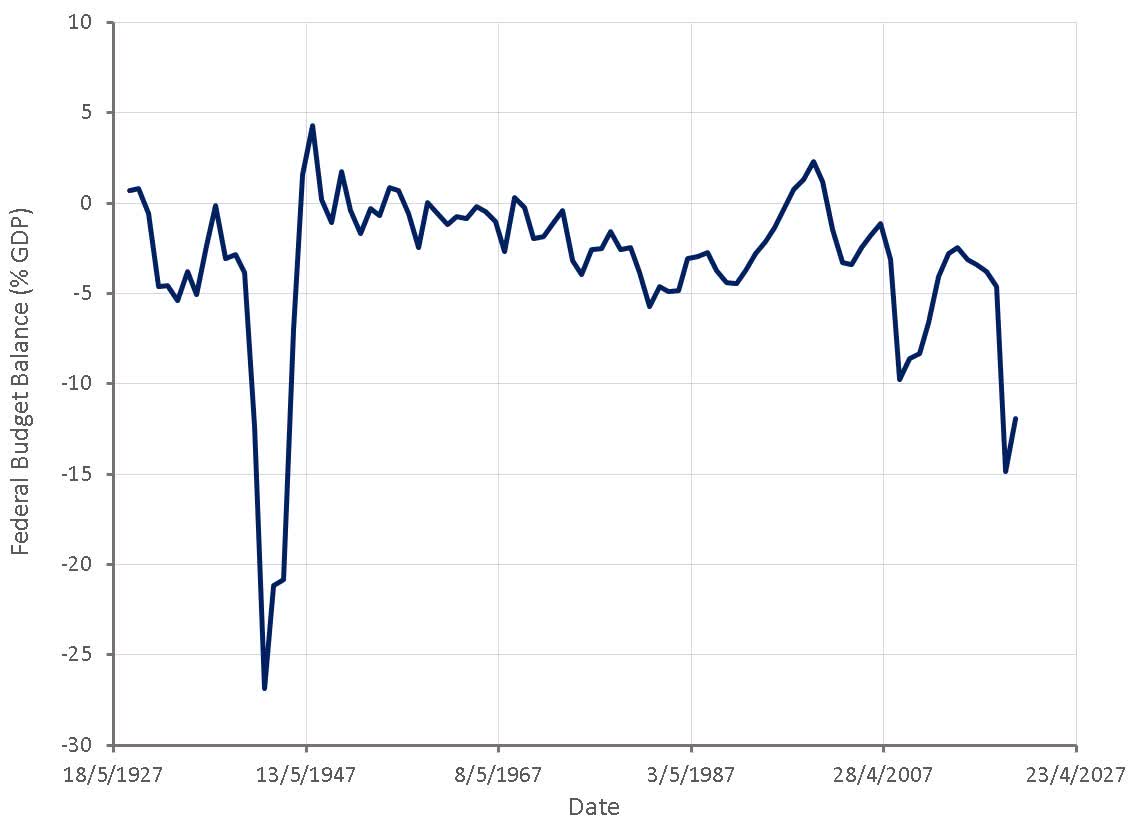
Figure 11: Federal Budget Balance (% GDP) (source: Created by author using data from The Federal Reserve)
For example, the Inflation Reduction Act is far more focused on climate change than inflation, and while it is expected to increase taxes, it will also increase spending. The Inflation Reduction Act is supposed to reduce the fiscal deficit, lower prescription drug prices, and increase investment into domestic energy production. The probability of projected tax revenues being realized is also most likely lower than the probability of projected spending increases occurring. The non-partisan Congressional Budget Office estimated that the bill would have no statistically significant effect on inflation. The Penn Wharton Budget Model also estimated that the bill would have no statistically significant effect on inflation.
The Biden administration is also looking to forgive student loans, which could cost 400-600 billion USD and add an estimated 0.15% to the personal consumption expenditure price index. Economists at the Roosevelt Institute and The Center for American Progress believe that the impact of debt forgiveness on inflation will be minor.
Another example is California’s attitude towards gas prices. The state has taken a position that the use of fossil fuels must be minimized due to the threat of climate change. Policies have been implemented to discourage the use of fossil fuels, often with the intent of driving prices higher for consumers and lowering profits for fossil fuel companies. The US, and California in particular, are now in a position where refinery capacity is insufficient and gas prices so high that it is hurting consumers. Rather than accept the impact of past policy choices or enacting policies that would help fix the current situation, California wants to introduce a new tax on oil companies and send rebates to taxpayers, thereby suppressing supply and increasing demand.
Fiscal policy which subsidizes demand and / or discourages supply growth could be a serious inflationary threat in coming years, particularly as the shift away from fossil fuels accelerates.
Conclusion
Monetary policy is tighter than it appears on the surface and is already beginning to strain a vulnerable global economy. The Federal Reserve appears focused on labor markets and is likely happy with recent data points. Interest rates look set to rise until inflation declines meaningfully, labor markets weaken or a financial crisis is created. This probably needs to be weighed against fiscal policy that will likely remain more expansionary than it should be. Markets appear to be pricing in higher for longer interest rates, as broad market indices’ PE ratios are continuing to decline. It is not clear that a normalization of corporate profits is priced in yet though, presenting further downside risk.
Be the first to comment