

The “streaming wars” isn’t a winner takes all. mphillips007
Media stocks simply can’t stop declining this year, and I think they present a compelling opportunity. Comcast Corporation (CMCSA) is the best-performing stock this year among the group I’ll discuss, declining by almost a third, while Lions Gate Entertainment Corp. (LGF.A) declined by 55%. The plunge in media stocks this year is driven by three factors: 1) The decline in cable subscribers. 2) The softness in the ad scatter market. 3) The apparent failure of streaming to generate enough profit for media companies if at all, due to its low margin profile.
This article will argue that instead of focusing on distribution-related problems (cable Vs. streaming), investors will be wise to evaluate media companies based on their content libraries and its quality. It will provide a simple, yet effective framework, to approach library value. It will then argue how each media stock presents a unique opportunity for investors.
I’ll also illustrate this approach using Q2 TTM results for The Walt Disney Co. (DIS), Netflix (NFLX), Comcast Corporation, Warner Bros. Discovery Inc. (WBD), Paramount Global (PARA), Sony Group Corporation (SONY), Lions Gate Entertainment Corp., and AMC Networks Inc. (AMCX).
The Framework
It all starts with this:
Media companies are in the business of monetizing their libraries (created by author)
It sounds obvious, but media companies are primarily in the business of making content first and foremost, not distributing it. In the golden age of cable, most of the media companies focused on making content and selling channels to cable distributors, rather than invest to try and reach subscribers’ homes. This model was disrupted with the introduction of streaming, now almost all media companies (Sony being the exception) are investing to reach their customers directly. The market is punishing media companies in part for the move to streaming. I personally view it as a great shift for investors, especially at the current stock prices, for two reasons: 1) Streaming winners will have a userbase of 100-400 million that they can generate a lot of profit from just by increasing their prices a few cents, and by building on that direct relationship to sell more services in the future. 2) The so-called losers can sell content and IP to the winners for potentially more money than what their stock sells for in the market today.
That means, in the long-term, streaming is a threat only to media companies that have no demand for their library, not ones who do but don’t have the resources to build a streaming service at scale. Rather than just dwell on whether a media company will be able to build a streaming service at scale, investors will be better served to focus on each media company’s ability to monetize their library as well.
I present a relatively simple framework that tries to measure two things: 1) The value of the company compared to the value of its content library. 2) How good is the company at making content people love.
The starting point for me is to use content assets listed on the balance sheet of media companies as a proxy for the value of the content library. Content assets are the amount of money a company paid for produced/in-production content. While the value of a content library should theoretically be all the future cash, this content library produces discount at an appropriate rate, the amount of money spent on content is a nice, objective starting point. Content liabilities should also be added when calculating a library’s value, but unfortunately, not all companies disclose their content liabilities (content they were delivered but are yet to pay for). As a result, I’ll exclude content liabilities for all companies whether they disclose it or not to get a uniform measure of library value and monetization ability across all of them. So, the first metric I’ll use is Market Cap to Content Assets (M/CA). That tells us how much an investor would be paying for each company’s content library.
The real issue with using content assets is that not every dollar spent on a piece of content is equal. The quality of the content is the most important. That’s why the second metric is more focused on measuring the value of the content, let’s call it Return on Content Assets (R/CA). That is basically the operating income a company has generated after adding back content amortization for the period measured, divided by the company’s content assets after adding back content amortization for the same period.
A valid question is why add back content amortization for this metric, and it’s a legitimate question. In my opinion, adding back content amortization to EBIT is more relevant than depreciation and amortization in terms of understanding the profitability of a media company’s content library. Content amortization is a non-cash expense based on management’s estimates of the useful life of a content asset. I am not trying to know the longevity of the assets. What I want to know is: 1) What is the total dollar value a media content deployed for the library it is monetizing in a given period? 2) How much cash did it roughly generate from that library? Content amortization is part of both answers. That serves as a foundation for understanding a given management team’s strategy, evaluating their ability of making content that customers engage with, and helps me make a judgement on their ability to redeploy that cash in the future to make more engaging content.
Investors shouldn’t consider R/CA as a profitability metric per se, for that I still prefer GAAP net income while understanding the nuances of management estimates for content amortization in particular. R/CA basically tells us how much cash was generated on the total amount of cash deployed to content. It provides investors with an objective number that they can use to compare between the different media companies in this regard. It can also serve as the foundation for a subjective evaluation of how well a given company is spending those proceeds on building up its library.
There should be a positive relationship between the two metrics I mentioned. The higher the return a company generates on its content library, the more valuable the library and the income it generates. The following examples are using second quarter data and market caps before the announcement of Q3 earnings.
The Walt Disney Co.
Amortization expense: $23,673 m.
Content Assets: $35,979 m.
Operating income: $5,249 m.
Market cap: $193,358 m.
R/CA: 48.5%
M/CA: 5.37x
Here is a look at Disney’s performance on these metrics over the past four fiscal years:
Fox Acquisition has affected Disney’s content monetization (Created by author using regulatory filings)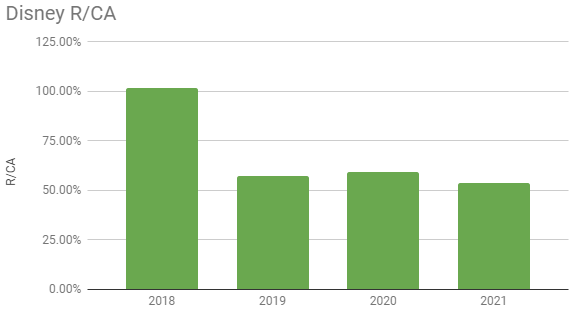
You can see the decline in Disney’s R/CA following the merger with 21st Century Fox. Disney’s return on its content library declined after acquiring 21st Century Fox mainly because the increase in its content assets didn’t see a corresponding increase in operating income. The rise in the cost of sports rights and pursuing a streaming strategy played a role in the decline as well. One cause for optimism is that important assets Disney acquired like Avatar and X-Men are yet to be monetized.
Created by author using regulatory filings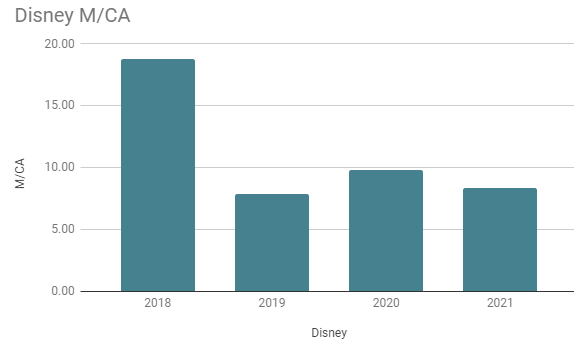
It’s clear here that the multiple assigned to Disney’s content contracted after the merger with Fox. This should be expected given the return generated from the content declined as well. You can see from the graphs that there is a relationship between R/CA and M/CA.
To sum up, Disney’s content is trading at the cheapest levels now compared to the previous four years. That was accompanied by a deterioration in its ability to monetize its content. Note that this deterioration isn’t just a result of ramping up of content spend, given R/CA adds back content amortization expense and so that isn’t a major factor. It’s mainly that Disney hasn’t been able to generate the return to match that increased investment.
An important caveat is that I didn’t include operating income from parks. There is an argument, probably a fair one, that parks are part of monetizing content. Investors who feel that’s the case should add operating income and depreciation from parks as well as fixed assets from the parks to get the R/CA.
Netflix
Amortization expense: $13,922.6 m.
Content Assets: $32,777.3 m.
Operating income: $5,714.7 m.
Market cap: $133,162.71 m.
R/CA: 42.05%
M/CA: 4.06x
The immediate observation is that Netflix is worse than Disney at monetizing its content, but its content is also selling at a discount to Disney’s. Both have a similar size of content assets, but Disney has a much higher content amortization expense mainly due to the mix of sports rights. This seems to confirm Warner Bros. Discovery CEO David Zaslav’s opinion that “sports is more of a rental.” If you think about it, having the sports rights of the NBA 2021 season is probably only valuable for 2021. But Encanto probably remains valuable for a few years after hitting theaters.
Here is a look at Netflix’s performance on these metrics over the past four fiscal years:
Created by author using regulatory filings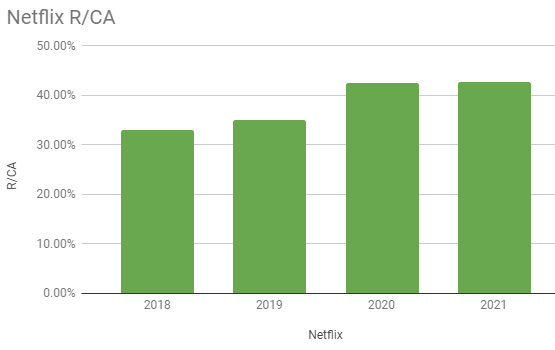
Unlike Disney, Netflix was on an upward trajectory since 2018. They seem to have hit a peak starting in 2020. Part of that was because the ramp in content spend went mainly to in-production content that is yet to be monetized, a theme common among many of the media companies in the article. If the release of those in-production content is accompanied by a moderation in content reinvestment, many of the companies in the article will see significant margin expansion that is not priced in their stocks. Netflix’s move into advertising will also be positive for R/CA, given it will increase operating income for the same amount of produced content.
Created by author using regulatory filings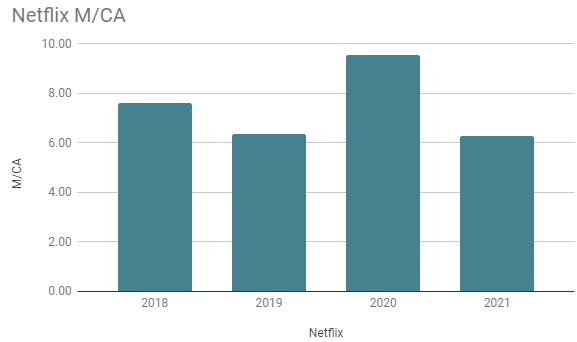
Despite Netflix improving the monetization of its content, the value of the company’s content library seems to be trading in a range. This might suggest Netflix could be a better opportunity compared to Disney if it can keep improving its monetization. Netflix needs to execute better on its advertising strategy. Disney for its part will need to execute on its advertising tier, but also on movie theaters. Even after that, it will need to deal with the decline of cable.
If Netflix can succeed in growing its advertising tier, it is not a stretch to see it go back to trading at 6x times content assets.
To sum up, Netflix is not as good as Disney in terms of monetizing content, but its library trades at a discount that reflects its inferiority compared to its rival. Netflix has made progress in terms of its ability to monetize content, introducing an advertising tier will probably enhance that ability even more with good execution.
Comcast
Amortization expense: $26,399 m.
Content Assets: $11,622 m.
Operating income: $3,127 m.
Market cap: $144,120 m.
R/CA: 77.66%
M/CA: 12.4x
This is a much trickier comparison because Comcast isn’t a pureplay like Netflix and Disney. These are the results for NBCU (excluding theme parks) and Sky. Now Comcast is monetizing its content better than Netflix and Disney, but a big chunk of Comcast’s content assets are sports rights that lose their value once the season ends. So, Comcast will always need to pay for sports compared to Netflix and Disney, because there is little value to Comcast’s library without it. The M/CA multiple is obviously higher at Comcast, given it is not a pure play and there are other businesses like broadband that contribute to the market cap.
So, Comcast indeed is better at monetizing its library than Netflix or Disney, but it is in constant need of replenishing that library because it loses a big chunk of its value once a sports season is over.
Think of it this way, let’s say X and Y borrow $30 billion at 2% interest each to produce content. X spends it on obtaining a 5-year sports rights deal, and Y produces scripted content. Both basically have a cost of capital of at least $600 million. Even if X monetizes its content assets at twice the rate of Y, X does not know what these rights will renew for after the deal ends. Y meanwhile can always adjust its cost by changing the ratio of movies to shows, blockbusters to small films, American-made shows to international ones…etc. That added uncertainty for X means it should demand a higher return on its capital compared to Y.
So just because Comcast monetizes its library better than Netflix and Disney doesn’t mean that Comcast has a better library because it is structured differently. But it also doesn’t mean that they are worse, or a “loser” of the streaming wars.
Just to showcase the difference, Disney’s content assets excluding sports are $30.5 billion, Comcast’s is $7.2 billion.
Here is a look at Comcast’s performance on these metrics over the past four fiscal years:
Created by author using regulatory filings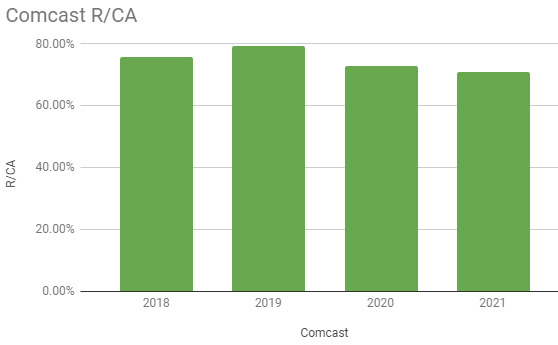
This includes both NBCU (excluding parks) and Sky. Comcast’s library generated higher returns than both Netflix and Disney, although the latter did have higher returns before the 21st Century Fox acquisition. Comcast’s content assets haven’t grown much if at all since 2018. The majority of returns are coming from content amortization rather than operating income which has contracted over the period, a non-cash expense. That’s why I think NBCU/Sky would make a good spin-off, it generates high returns (about $30 billion between non-cash content amortization expense and operating income, and the acquirer can redirect those sums across a wide variety of content options if they so choose). Comcast could also choose to keep the media assets and focus on being the one with the most resources to acquire live content in general like news and sports.
Note some of the content assets I used in the calculation belong to the cable segment. Comcast didn’t break out content assets by segment. So, the return is likely slightly higher than the numbers I shared.
Created by author using regulatory filings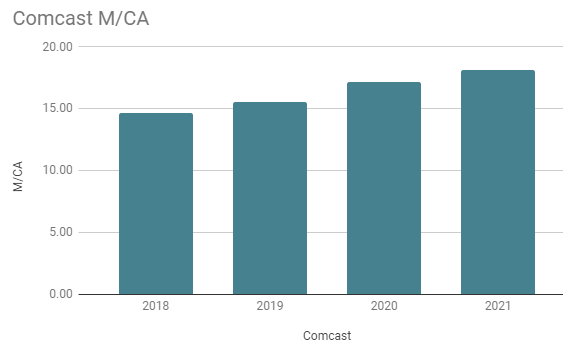
The multiple on Comcast’s content library has been steadily increasing over the past four years. The library does deserve to trade at a premium multiple to Disney and Netflix, given it generates higher returns. The caveat though is that Comcast is not a pure play, so M/CA reflects the performance of other businesses as well. This year the multiple has declined for example even though there was a rebound in R/CA compared to 2021 (as of Q2).
To sum up, Comcast earns higher returns on its content assets compared to both Disney and Netflix. Its library is subscale compared to its two competitors, meaning consolidation with another rival is probably needed if the company is to emerge as a winner from the streaming wars. NBCU and Sky would be attractive targets given they have high returns and generate large profits that a buyer could redeploy in the new combined business. Sky will probably be kept inside Comcast given it has a broadband offering. But a spin-off of its media component could be engineered if needed, similar to what BT Group plc (OTCPK:BTGOF) did with BT Sport.
Warner Bros. Discovery
Amortization expense: $19,910 m.
Content Assets: $30,120 m.
Operating income: $2,457 m.
Market cap: $28,163 m.
R/CA: 44.71%
M/CA: 0.94x
WBD’s valuation is definitely the most striking aspect of the stock. The company is stunningly cheap to me. Just for perspective, as of Q2, WBD has essentially the same library size as Netflix, monetizes it better, but the library is selling for a quarter of Netflix’s library. Surely, there is more than enough margin of safety here for the company’s exposure to cable revenues.
Investors should note that for WarnerMedia’s TTM figures, I used the numbers disclosed by AT&T (T) in their quarterly fillings. There is certainly room for the combined company to improve returns as they fully integrate with one another.
A look at WBD’s historical data for the method’s metrics makes little sense now since the company was just formed. It might be useful down the line to see how the merger worked out for Discovery.
Sony Group
Sony Pictures is usually praised for having the best streaming strategy, serving as an arms dealer in the streaming wars. A look at its historical data shows that it has the highest R/CA among the companies discussed so far, with the exception of Comcast. This could be indicating that there is a relationship between having a flexible content strategy and achieving high returns. Sony’s library is also the smallest among the companies reviewed so far. Its total content assets were $10.8 billion according to the company’s quarterly filing. Unfortunately, Sony doesn’t break out content assets by type in quarterly fillings, but the annual report showed that the library’s size for films and TV was actually just less than $5 billion, or less than half of total content assets (the other half is music). This also means there is no way of measuring Sony’s TTM performance since management doesn’t disclose the library value on a quarterly basis.
Here is a look at Sony Pictures’ performance on these metrics over the past four fiscal years:
Created by author using regulatory filings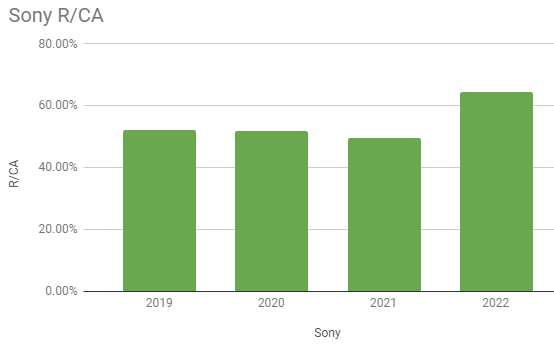
Sony’s R/CA has been roughly stable around the 50% mark in the last four years. The last fiscal year saw a big jump thanks to the performance of theatrical releases, most prominently Spider-Man: No Way Home. The increase in returns was accompanied by an increase in content assets as well. Sony shows that there is an alternative to Netflix’s strategy and that smaller players can continue to earn a decent return in a streaming world.
Created by author using regulatory filings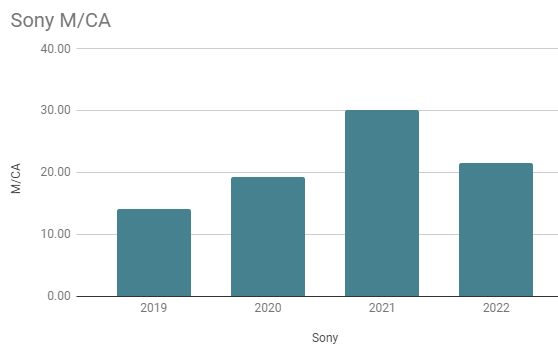
Like Comcast, the multiple on Sony’s content library is of little use given it’s not a pure play. The performance of PlayStation in any given year is far more important to Sony than its pictures segment. But at least the multiple does deserve to be trending upwards given the improvements made in monetizing the content. If it were an independent company, the multiple on Sony Pictures’ library would deserve to be trading at a premium to both Netflix and Disney, given it monetizes its library better than both companies.
Paramount Global
Amortization expense: $12,476 m.
Content Assets: $15,655 m.
Operating income: $2,820 m.
Market cap: $12,733 m.
R/CA: 54.37%
M/CA: 0.81x
Adding Paramount to the mix reveals two intuitive outcomes: 1) Live content monetizes better than scripted content. Both NBCU and Paramount Global have a higher portion of their library dedicated to live content than the rest, and both are clearly ahead of everyone else in terms of monetization. 2) Companies with high exposure to cable revenues are priced at a discount to peers by the market. Both Paramount and WBD have high exposure to cable, and they are the cheapest libraries among the group discussed in the article so far. This reflects worry over cord-cutting. As I’ve written before, media companies should be valued based on content quality and not distribution. Good content will always find its way to fans and companies creating it will get paid for it. This article from Bloomberg shows that:
Not long before the pandemic, Netflix explored a deal for Paramount Pictures, the studio behind “The Godfather” and “Top Gun,” according to two people familiar with the talks. Netflix wanted the studio’s library and its lot. But it wasn’t interested in buying the cable networks owned by the same company, so talks didn’t go anywhere, said the people, who declined to be identified.
Investors who pay a good price for companies with cable exposure can still do well even if cable ceases to exist because the content library can be monetized with a different method of distribution. Looking at cable subs vs. streaming subs won’t help in figuring that out but looking at things like R/CA can be a good starting place for evaluating those stocks. Just as a mental exercise, if Netflix were to buy Paramount studios, it doesn’t seem likely that they will do so for less than the cost of the investment made in Paramount’s non-live library net of the debt, otherwise they will be buying the library for less than 100 cents on the dollar. Paramount’s scripted library value was slightly more than $11 billion according to the latest quarterly filling, or $17 a share. Add to that a control premium and net a few dollars a share depending on the amount of debt it will assume, and it seems extremely unlikely for an investment in Paramount today to lose money even under a very bearish scenario.
Here is a look at Paramount’s performance on these metrics over the past four fiscal years:
Created by author using regulatory filings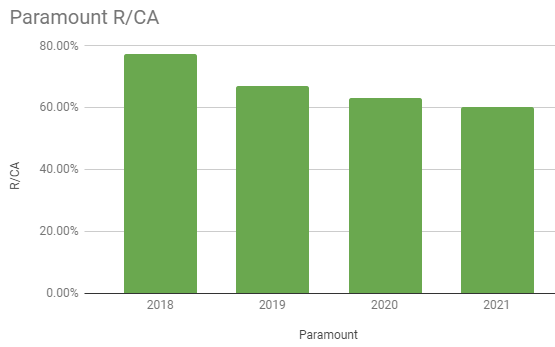
Paramount’s R/CA has been declining consistently over the past four years as the company pivots from a content library relying on live content and content sales, to developing its own streaming platform. It is still monetizing its content better than pureplay streamers like Netflix and even Disney, thanks to the higher live content mix in its library. The challenge facing Paramount and WBD is whether they find an inflection point in monetization at a similar level to pureplay streamers? Paramount’s monetization of its library is only a few percentage points better than Disney, but they are nowhere near the scale of Disney in streaming. The good news for investors is that Paramount’s content is selling for a fraction of Disney, so once or if returns from streaming improve and start becoming a factor, that spread in multiples will start contracting.
Created by author using regulatory filings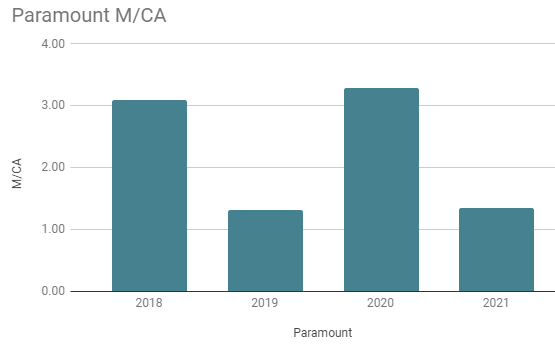
Paramount’s M/CA has been declining since 2018. The jump in 2020 is a result of the Archegos saga more than anything else. The decline is driven by the switch to building a streaming platform. While a decline in R/CA should merit a decline in M/CA, Paramount’s multiple is criminally low.
Lions Gate
Amortization expense: $1,668.6 m.
Content Assets: $3,148.8 m.
Operating income: $-79.5 m.
Market cap: $1,744 m.
R/CA: 32.99%
M/CA: 0.55x
Probably the most fascinating company among all that is set to be discussed in the series. Lions Gate is the worst at monetizing its content library, primarily as a result of the company’s efforts to grow the Starz streaming platform. The company is trading for almost half the investment it made in content, which is astonishingly low. They announced earlier this year that they plan to spin off Starz. They then announced last month that they are now going to spin off the studio business. The updates in Q3 on the spin-off are beyond the scope of the article given it focused on the tax benefits of the spin-off and the benefit adding back eliminations would have on operating margins. In my opinion, the spin will be an important test of the thesis that valuing these companies based on content rather than distribution is the way to go for investors. The spin-off in a lot of ways could serve as either a validation or a dismissal of this article’s thesis. Consider this quote by CEO Jon Feltheimer when asked about whether the value of the library was still $3-4 billion like it was when they did an independent, third-party valuation for it:
In terms of library value, frankly, if anything, the library is well more valuable than it was in that time period and continues to grow — it grows for two reasons. One, obviously, we’re filling the pipeline with a lot of content. And the more renewals we get, particularly in the television business, the more valuable that content is. And the second thing is, and we’ll see in a recessionary environment if it’s quite the same, but we are finding huge increases in demand with so many new buyers for our content.
And frankly, again, such a significant portion of our content is scripted and premium. And frankly, that’s what has the longest lifetime value and the most demand right now.
You can see in the quote a very similar approach to content like the one in this article. Note that the reason the library is more valuable was because of the investment made in content. He didn’t think of amortization as a cost of goods sold spent to bring in revenue like cheese is for McDonald’s, for example, rather it was an investment made to enhance the value of that library for the long term. Current margins tell investors very little about the value of a media business, it all depends on the value of the library, especially at these stock prices. You can have a studio with very small profit margins, but that would be immensely lucrative if the small margins are a result of investing in premium, durable content.
Consider another quote by WBD CEO David Zaslav on the advantages his company will reap from launching a free ad-supported streaming TV (FAST) service:
There’s also a huge amount of content that’s not even on that platform that’s sitting with us that hasn’t been put to monetize in the marketplace. Some of that we will sell, which we’ve talked about, and we’ve started to sell. Some of it we’ll sell not exclusively, some of it, but we have the ability on the FAST side to build a service without buying content, most of the players in that space, are out buying content and then looking to sell that content and create a wig effectively, where they get a return on that content based on what they spent on it.
It’s another quote that shows media management teams, across different media companies, not just WBD, are focusing on optimizing returns from their content library at a time when Wall St. analysts and investors are focusing only on the distribution side of the business in terms of cable subs losses vs. streaming subs ARPU. Investors who put the effort into delving into each content library could end up finding something the market is missing as they are looking where no one currently is.
Here is a look at Lions Gate’s performance on these metrics over the past four fiscal years:
created by author using regulatory filings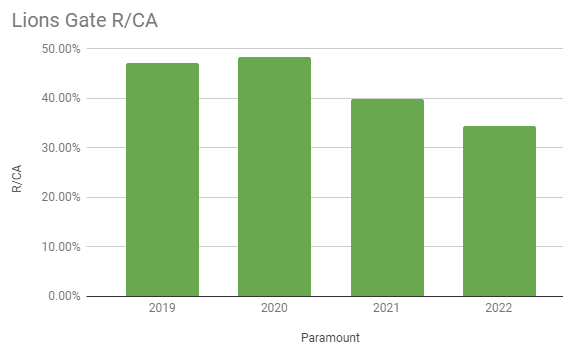
Lions Gate’s R/CA has been declining since 2020 when it had returns on library similar to peers. Now it has the worst return compared to any other company in the article. There are three reasons for this sharp decline: 1) The pandemic took away theatrical releases, which is an important avenue for the company. This seems to be a temporary situation and the company has a slate of big films set to be released in theaters over the next two years. 2) The investments being made in streaming. 3) The company increased the investment in its content library by 50% since 2019 fiscal year, but two-thirds of the library is either still being filmed or hasn’t been released, so they aren’t being monetized.
created by author using regulatory filings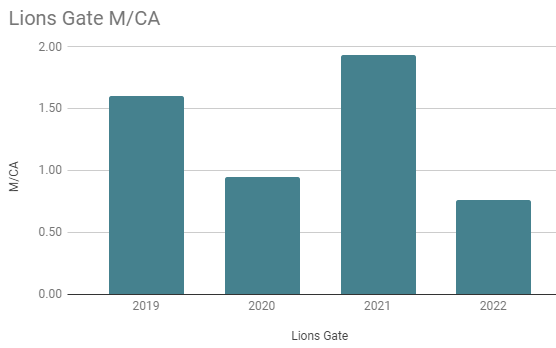
Lions Gate market cap to content assets multiple is trading at the lowest level compared to any of the past four fiscal years. Content assets grew 50% while the market cap declined 50% approximately as well. My position is that the company is valued irrationally, and the spin-off of the studio could be a boon for investors. Of course, the interest rate environment doesn’t make financing deals easy, so it’ll be interesting to see how that situation unfolds.
AMC Networks
Amortization expense: $972.9 m.
Content Assets: $1955.7 m.
Operating income: $579.8 m.
Market cap: $971.01 m.
R/CA: 53.02%
M/CA: 0.5x
AMC Networks is a similar playbook to Lions Gate Entertainment. It is really cheap compared to the investment made in its content library; it is also doing a terrific job with its niche streaming offering as well. I would say AMC Networks is monetizing its library better than Lions Gate mainly due to its lack of a theatrical business, which took a hit since the pandemic. Investors wouldn’t even know the company was facing challenges if they just looked at Q2 GAAP accounting without considering anything else. Cable subs are declining, but distribution revenue is growing nicely nonetheless, with streaming growing very strongly. All that while also increasing GAAP operating income in the last fiscal year. Free cash flow is obviously challenged, negative in the first six months of 2022 as the company beefs up its content library. If these investments are good, the stock is probably a great buy because the library would be worth a lot more to any of the bigger media players than what the stock is trading for.
Here is a look at AMC Networks’ performance on these metrics over the past four fiscal years:
created by author using regulatory filings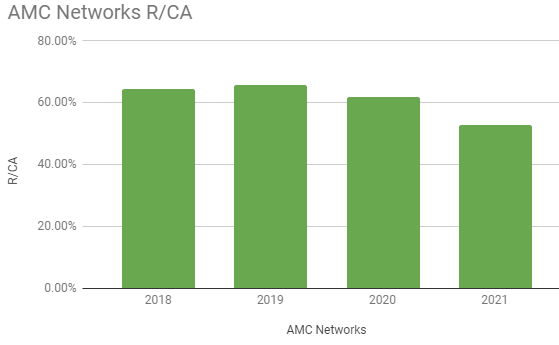
AMC Networks’ monetization of its library, like many of the companies that were discussed in this article, has been declining over the past four years. This is largely due to the decline in cable. It still does monetize its library well, and the company is doing well pivoting a host of niche streaming platforms. If they pull that off, it will be hard to imagine AMC Networks doesn’t make sense to any strategic player in the streaming space.
created by author using regulatory filings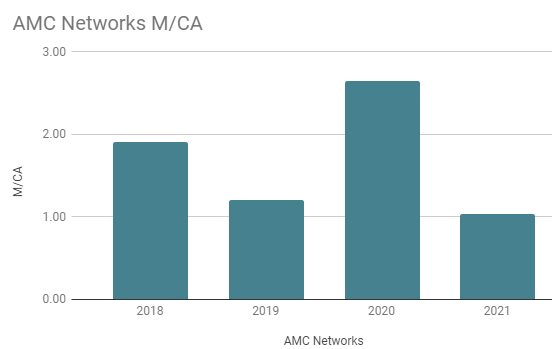
The content library’s multiple has been following a similar pattern to that of Lions Gate entertainment, mostly due to the correlation in both the stock returns and the strategy. The multiple contracted further in 2022 mostly as a result of Netflix losing subscribers in Q2 and the deterioration in the ad market rather than anything company-specific.
Limitations
As mentioned earlier, not all of the company’s content library is listed as content assets, some are listed as liabilities, meaning returns generated from content are likely lower. Also, not all content assets were produced content, a significant portion of it is content in production. In fact, for a number of companies, the increase in content assets was driven by content that is still in production and can’t be monetized. Not all media companies break out these pieces of information in the quarterly filling, so the annual report will be a better opportunity to review those nuances further.
The other issue is that the metrics discussed must not be thought of as stock profitability or valuation methods. They are simply helpful in understanding a media company’s content library, which is one part of its operations. Investors must continue to rely on traditional profitability metrics like return on equity or valuation metrics like P/E in understanding the performance of the company as a whole. Investors must also pay special attention to the impact a company’s capital structure can have on its stock performance. The monetization of content libraries is simply one aspect of a more comprehensive evaluation process. The article focused solely on content monetization not because other factors are less important, but because investors, Wall St., and media coverage seem to overlook content monetization in analyzing media stocks this year.
Conclusion
The term streaming wars suggest that there have to be winners and losers in the media space. This article tried to show that each company can be a winner in its own way for investors. Sony should continue leveraging its winning strategy of being an arms dealer to all platforms. Netflix and Disney would probably grow significantly by leveraging an ad-supported tier. Warner Bros. Discovery is so cheap that the stock can be worth significantly more in the future if it realizes cost and revenue synergies from the combination. NBCU and Paramount can probably continue to benefit if they keep allocating large amounts of their resources to live content that has high returns, while steadily growing their scripted-content library. Smaller companies like Lions Gate and AMC Networks have become so cheap that separating their streaming, studio, and cable businesses could unlock a lot of value for their shareholders.
Be the first to comment