

Kameleon007/iStock via Getty Images
Investment thesis: the only reason to invest in iShares 7-10 Year Treasury Bond ETF (NASDAQ:IEF) right now is to lower portfolio volatility. If that’s not an investment objective, don’t buy this ETF.
There are two reasons that high inflation is bad for bond investors. First, high inflation lessons the value of the coupon payments. For example, if a bond pays a yield of 5% and inflation is 3%, the real yield is 2%. Second, high inflation eventually leads the Fed to raise interest rates, which lowers the value of previously issued bonds. For example, if an investor owns a bond that yields 5% and the Fed raises rates, the market will lower the amount it will pay for the 5% bond to take the higher rates into account.
The US economy is currently experiencing its highest inflation rate since the 1970s. Let’s start with the latest CPI release:
The Consumer Price Index for All Urban Consumers (CPI-U) increased 0.8 percent in February on a seasonally adjusted basis after rising 0.6 percent in January, the U.S. Bureau of Labor Statistics reported today. Over the last 12 months, the all items index increased 7.9 percent before seasonal adjustment.
Here’s a chart of the data:
Total and core CPI (FRED)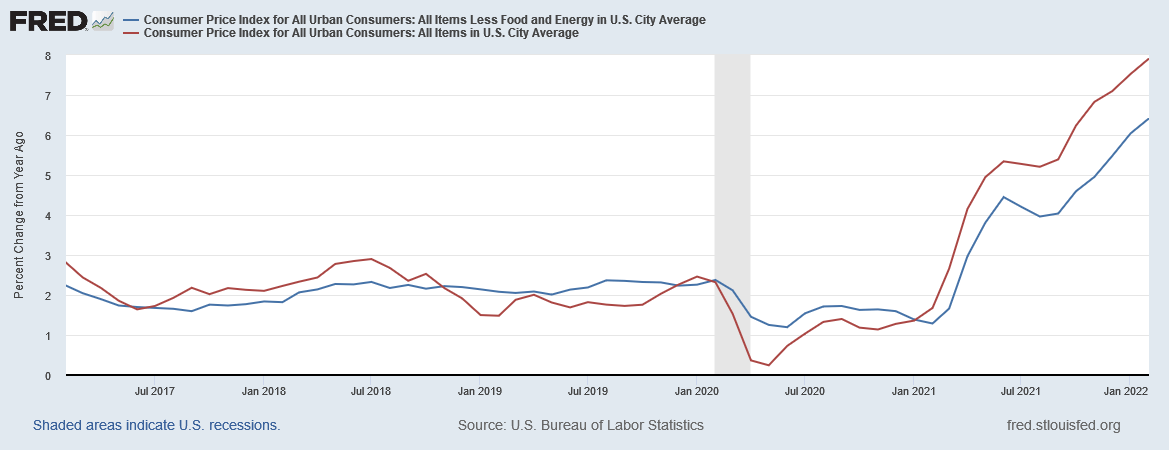
Both total (in red) and core (in blue) inflation rates have been increasing since early 2021. There is no indication the pace of increase will decline anytime soon.
Rather than using a single data point, the Fed looks to average inflation, which removes the randomness of monthly releases:
3, 6, and 12-month average Y/Y percentage change in core and total CPI (Data from FRED, author’s calculations)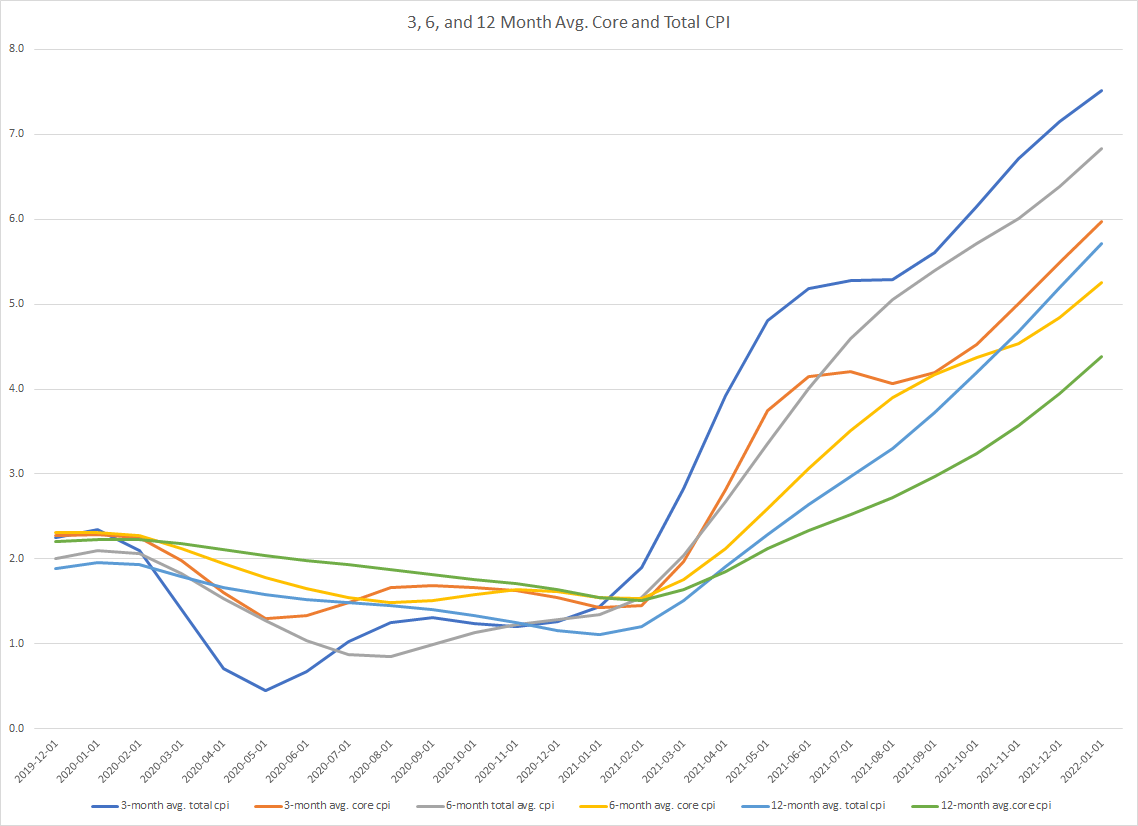
The above chart contains the 3, 6, and 12-month average of the Y/Y percentage change in core and total CPI. All are moving higher with the shorter above the longer. That means that all will continue to increase for the next few months at least.
The Fed’s preferred price gauge — the PCE price index — has the same problem:
The PCE price index for January increased 6.1 percent from one year ago, reflecting increases in both goods and services (table 11). Energy prices increased 25.9 percent while food prices increased 6.7 percent. Excluding food and energy, the PCE price index for January increased 5.2 percent from one year ago.
Here’s a chart of the data:
PCE core and total price indexes (FRED)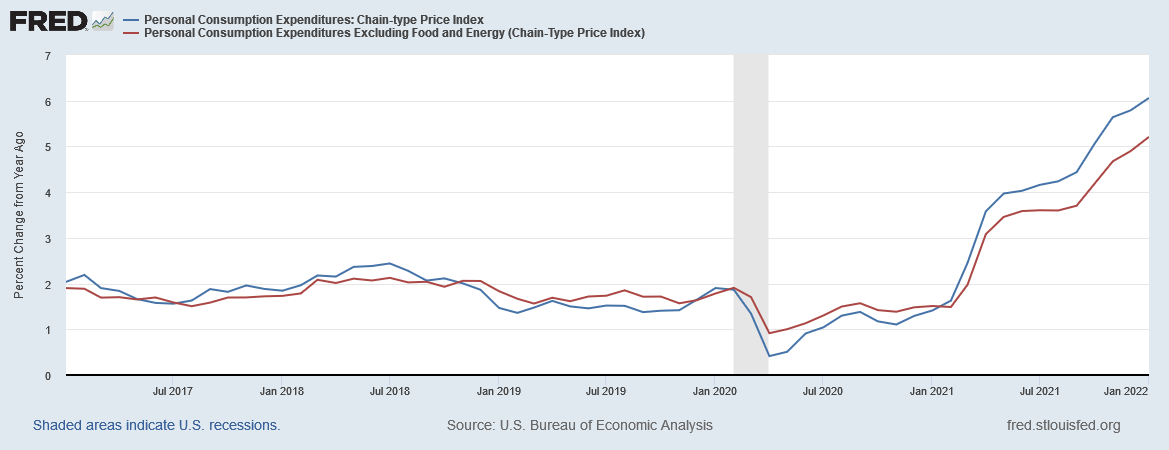
Both the total and core PCE price indexes are rising.
Let’s also look at the averages of the Y/Y percentage change in this index:
3, 6, and 12-month average percentage change in the core and total PE price index (Data from FRED; author’s calculations)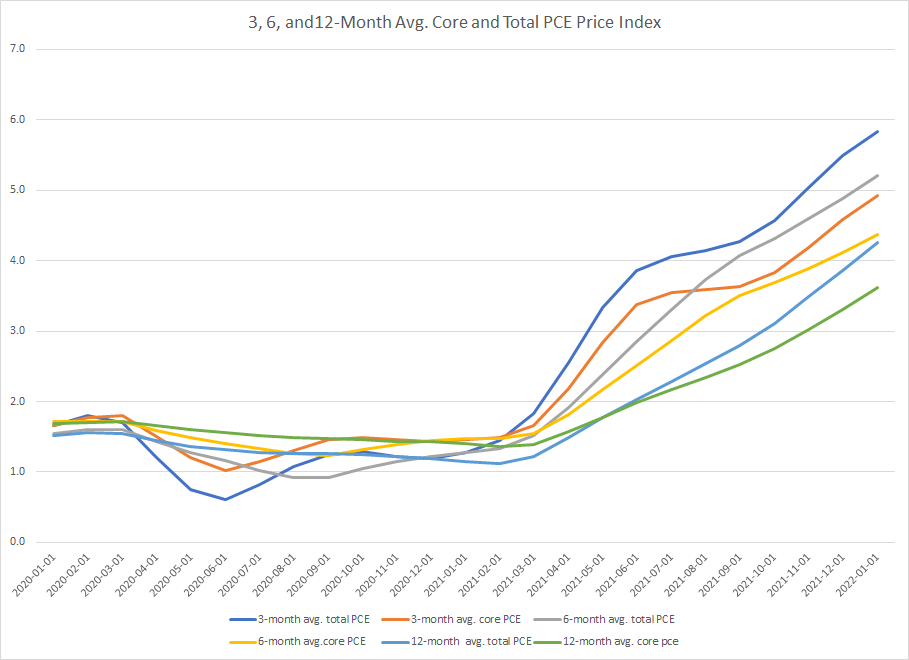
This data has the same problems as the CPI data — all are moving higher with the shorter above the longer. Higher prices are guaranteed for the next few months at least.
As a result of these higher prices, the Fed raised rates at its last meeting. The Dot Plot from the latest release shows more rate hikes are in store:
Dot Plot (Federal Reserve)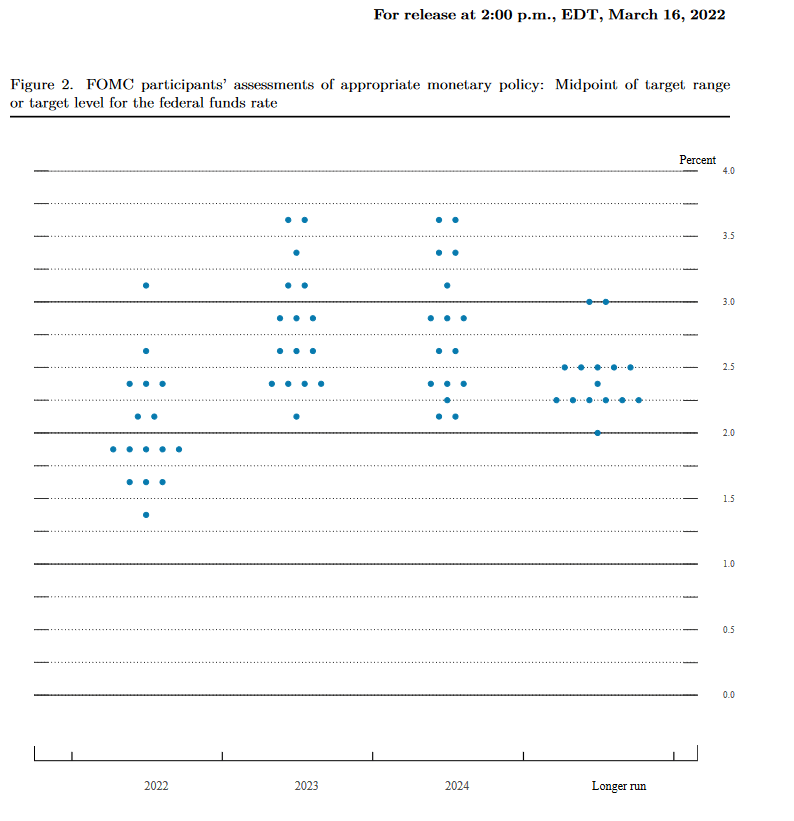
It’s likely rates will be at least 1.75% by year-end.
The bond market has been selling off for some time. Here are the relevant charts for the IEF:
Weekly and daily charts of the IEF (Stockcharts)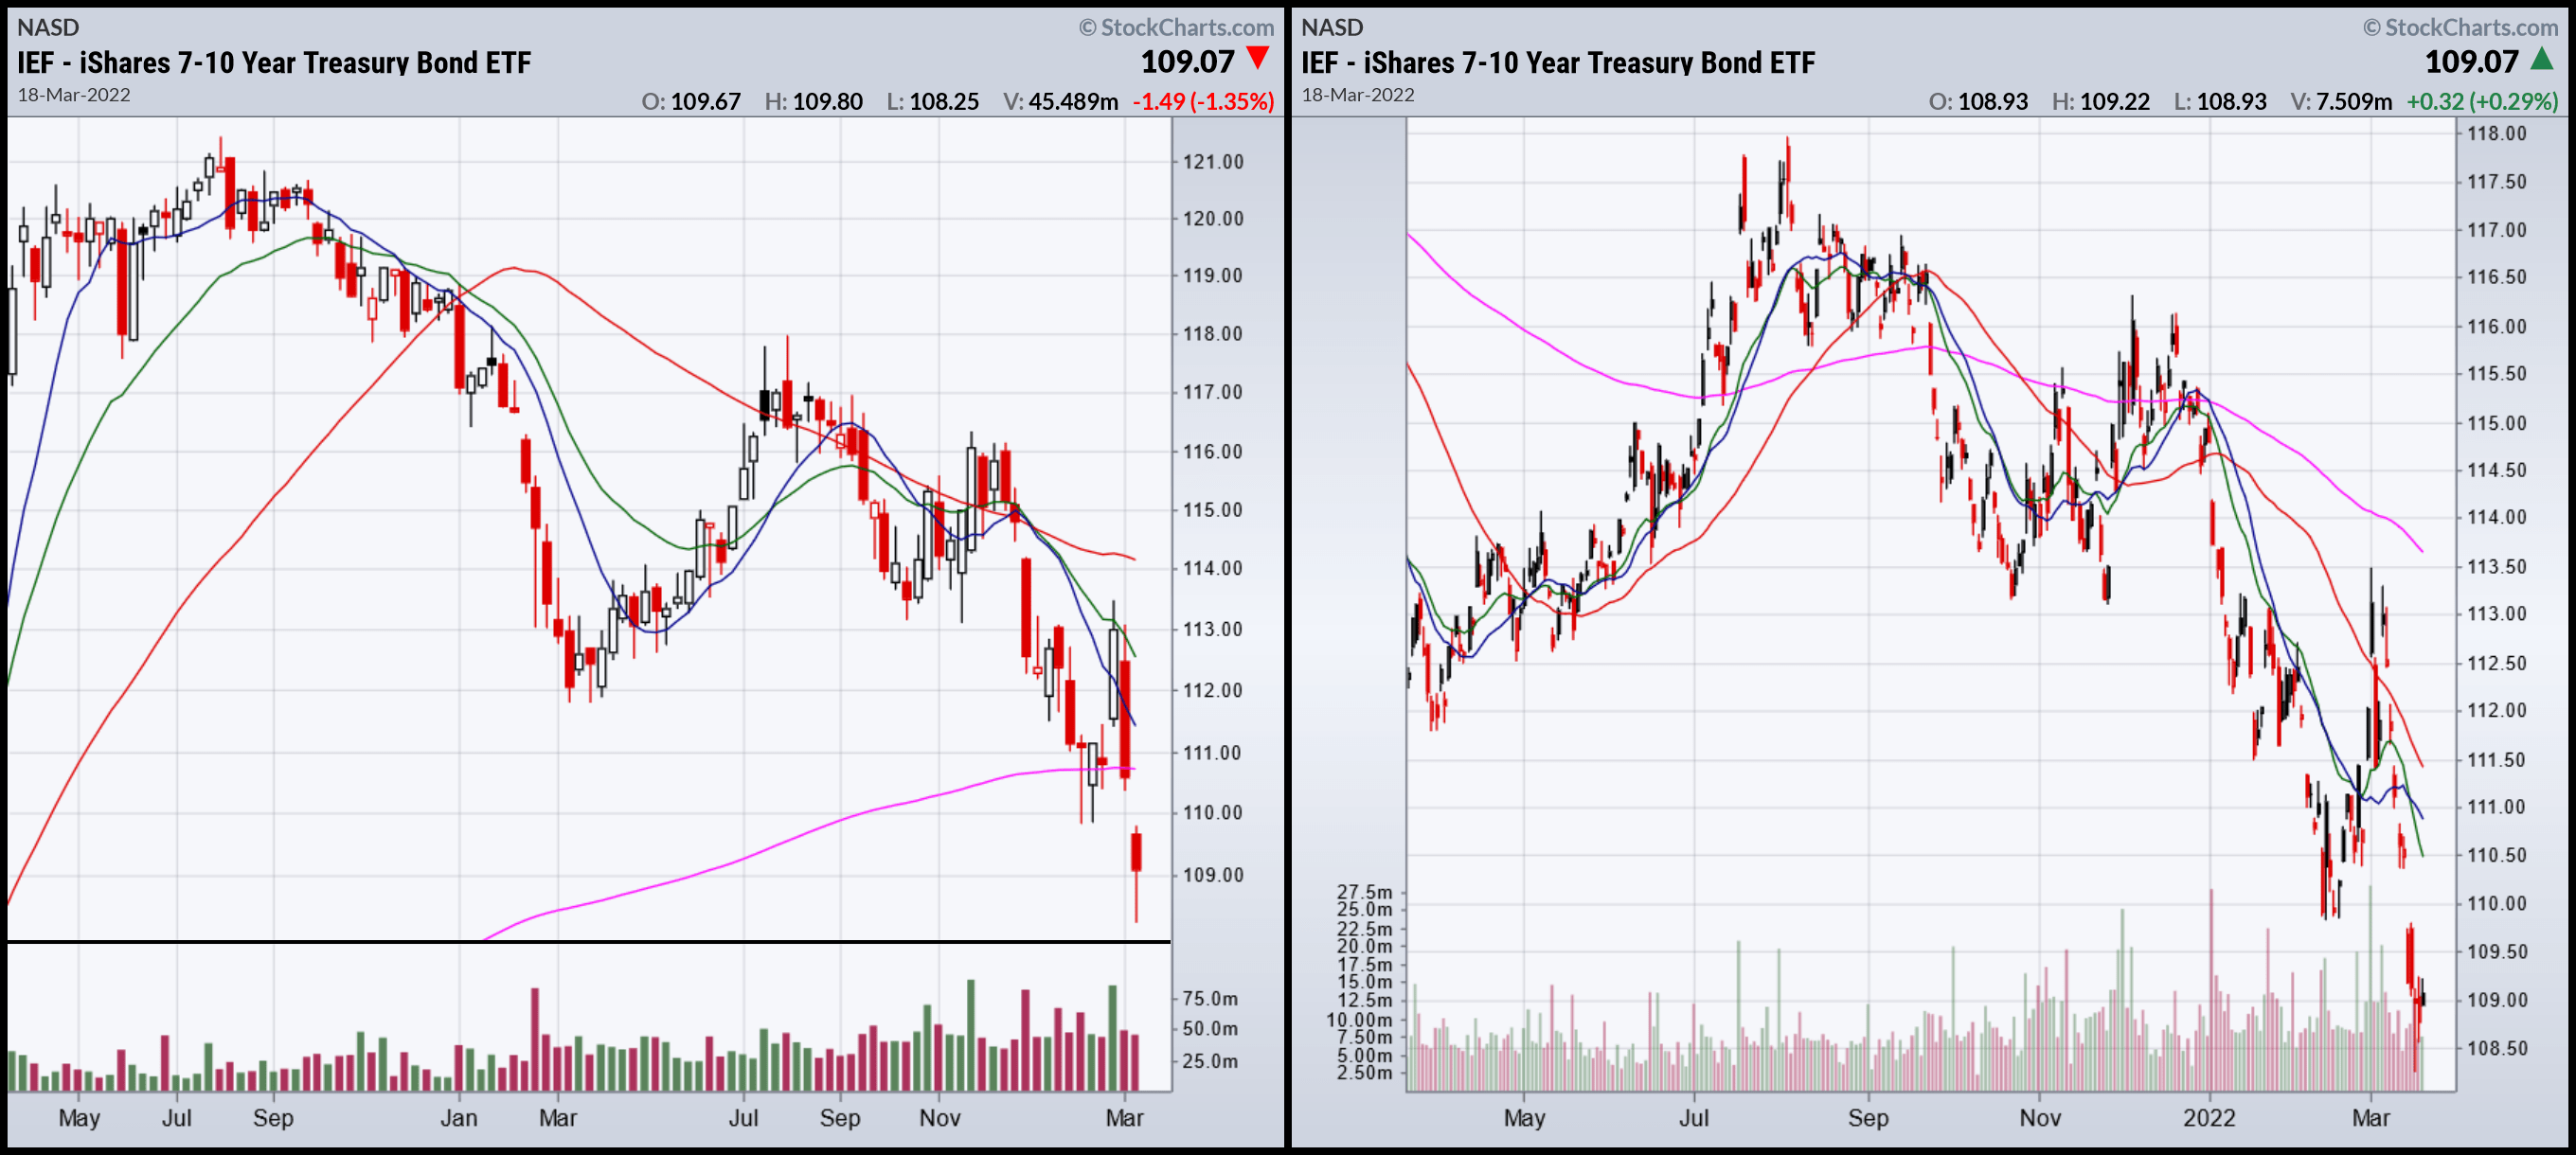
The weekly chart (left) peaked in the summer of 2020 and has been heading lower since. The daily chart (left) simply shows the last year of the decline.
There’s a classic portfolio allocation that is 60/40 – 60% stock and 40% bonds. This is done to lower volatility (bonds are less volatile than stocks). If lower volatility is a goal, then add this ETF. But that’s the only reason it would make sense as an investment right now.
Be the first to comment