Oat_Phawat/iStock via Getty Images
Introduction
Canada-based IAMGOLD Corporation (NYSE:IAG) reported the fourth quarter and full-year of 2021 on February 23, 2021.
Note: This article is an update of my article published on January 15, 2022, in which I have analyzed the gold production for the fourth quarter and full-year 2021.
This new article is a complete review of the fourth quarter and full-year 2021 results, including gold production and balance sheet.
Note: We learned that President and CEO Gordon Stothart has stepped down from his role of President and Chief Executive Officer and has also resigned from the Board of Directors. Ms. Daniella Dimitrov is the new interim CEO.
4Q21 and full-year results snapshot
The company recorded $294.6 million in revenues and posted a loss per share of $0.40 with a net loss of $194.10 million. However, adjusted earnings were $26.8 million or $0.06 per share. Net income was affected by an impairment of $205.1 million for Rosebel.
Production for 4Q21 was 153K Au oz compared to 169K Au oz produced in 4Q20.
IAG: Financial 4Q21 and full-year 2021 Presentation (IAMGOLD corp.)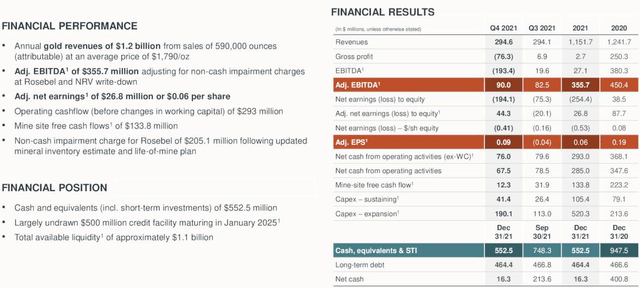
CapEx continues to be high due to the Côté Gold project, with 43.4% overall project already completed and 92.2% detailed engineering completed in December.
Stock performance
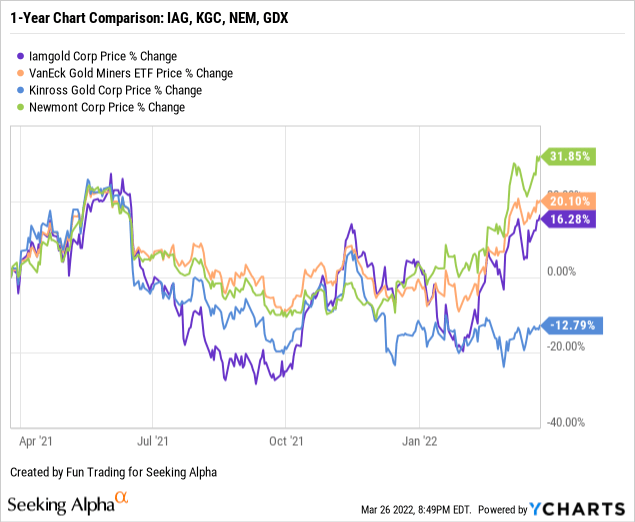
IAMGOLD has followed the VanEck Vectors Gold Miners ETF (NYSEARCA: GDX) and is up 16% on a one-year basis. The company had more of its fair share of technical issues but recently managed a significant comeback, with the gold price jumping well over $1,950 per ounce.
Presentation
The flagship mine Essakane in West Africa represents 64.1% of the company’s total output in 4Q21.
IAG: Gold Production per mine 4Q21 (Fun Trading)
The company presents excellent liquidity and has no net debt. It’s a definite positive for the long term. However, the stock performance has never been extraordinary, and shareholders have often been disappointed.
The company has struggled with technical issues for as long as I have followed it. Earthquakes, heavy rains, and worker strikes are recurring and don’t seem to vanish until now.
The gold miner is investing in the Côté Gold project, which should significantly help the gold production in 2024. However, the company is struggling to keep CapEx and costs under control and announced an increase in project costs last year.
The company is fully funding Côté Gold, estimated at $1,125 million to $1,175 million (initially $875 million to $925 million) with overall project completion at 43.4% at the end of 2021. So far, no financing has been announced for the project, but the company may need some external funding in 2022, which could affect the stock price.
IAG: Cote Gold expectations Presentation (IAMGOLD corp.)
Investment thesis
The investment thesis for IAG remains the same quarter over quarter. I am not enthusiastic about the stock performance, in general, and the 4Q results are not helping much in my overall rating.
IAG is now well above my comfort zone and trades at resistance. It is perhaps time to take profits unless the gold price can cross the $2,000 per ounce mark.
The trading strategy I recommend is to trade short-term LIFO about 60% of your position and keep a core long-term position for a much higher target.
IAMGOLD Corp. – Financial Snapshot 4Q21 – The Raw Numbers
| IAMGOLD | 4Q20 | 1Q21 | 2Q21 | 3Q21 | 4Q21 |
| Total Revenues in $ Million | 347.5 | 297.4 | 265.6 | 294.1 | 294.6 |
| Net Income in $ Million | 59.0 | 19.5 | -4.5 | -75.3 | -194.1 |
| EBITDA $ Million |
161.1 |
114.7 |
86.2 |
15.8 |
-187.2 |
| EPS diluted in $/share | 0.13 | 0.04 | -0.01 | -0.16 | -0.40 |
| Operating Cash flow in $ Million | 128.7 | 101.7 | 37.3 | 78.5 | 67.5 |
| Capital Expenditure in $ Million | 106.8 | 102.9 | 161.1 | 139.1 | 266.8 |
| Free Cash Flow in $ Million | 21.9 | -1.20 | -123.8 | -60.6 | -199.3 |
| Total cash $ Million | 947.5 | 967.8 | 829.8 | 748.3 | 552.5 |
| Long-term Debt in $ Million | 466.6 | 466.7 | 456.5 | 466.8 | 464.4 |
| Shares outstanding (diluted) in Million | 496.3 | 480.9 | 476.6 | 476.8 | 476.8 |
Data Source: Company release
Gold Production And Balance Sheet Details
1 – Revenues were $294.6 million in 4Q21
IAG: Quarterly Revenues history (Fun Trading )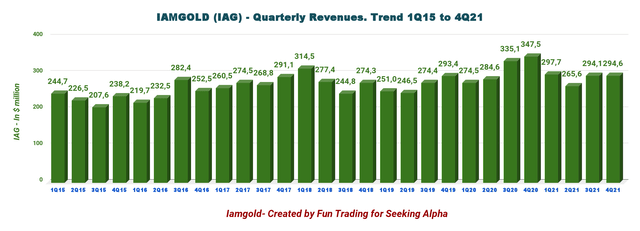
The quarterly revenues came in at $294.6 million, down 15.2% from the same quarter last year.
IAG posted a loss attributable to equity holders of $194.1 million, or $0.40 per share. Cash in 4Q21 decreased by $195.8 million, primarily resulting from the advancement of construction at Côté Gold.
CFO Daniella Dimitrov said in the conference call:
Ensuring the delivery of Côté Gold is a keystone for bridging the value gap between our valuation today and potential value growth for the Company tomorrow.
2 – Free cash flow is estimated at a loss of $199.3 million in 4Q21.
IAG: Quarterly Free Cash Flow history (Fun Trading)
Note: Generic free cash flow is the cash from operations minus CapEx.
Free cash flow has been a recurring struggle matter for many quarters and will continue until the Côté Gold project is completed. It is not so dramatic, and I find it healthy because IAG uses cash to finance the Côté Gold project expected to produce commercially in 3Q23. IAG CapEx was $359 million in 2021.
IAG’s trailing twelve-year free cash flow is now a loss of $384.3 million and $199.3 million in the fourth quarter.
IAG: Cote Gold Project presentation (IAMGOLD corp.)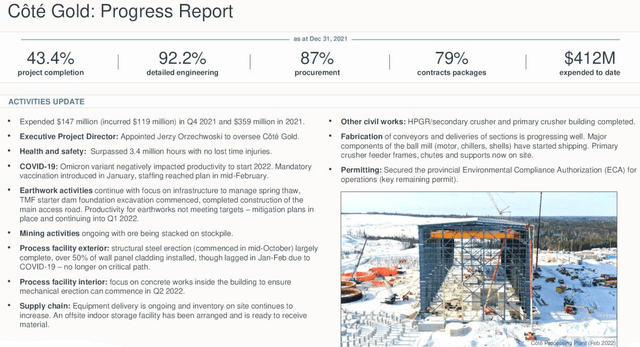
3 – Gold Production Details; Total Production Was 153K Au Oz In 4Q21
3.1 – Gold production details
IAG: Quarterly Gold Production history (Fun Trading)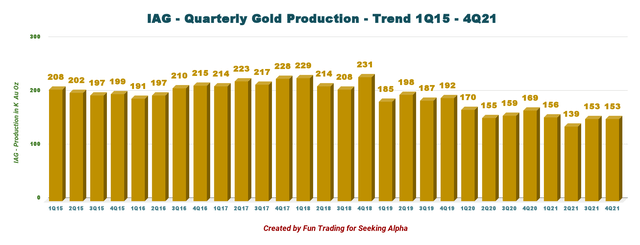
IAMGOLD produced 153K Au oz during the fourth quarter of 2021 compared to 169K Au oz during 4Q20, as shown in the graph above.
3.2 – Quarterly AISC and Gold price.
AISC is now $1,537 per ounce, which is exceptionally high due to Rosebel and Essakane stockpile. In the conference call:
Cash costs and all-in-sustaining costs were impacted by a $50 per ounce, non-cash net realizable value or NRV write-down on ore stockpiles and finished goods. This write-down primarily relates to Essakane and Rosebel, and it’s due to an increase in the estimated cost to process or stockpiles. After adjusting for cost increases stockpile grades and gold price assumptions.
IAG: Quarterly AISC and gold price history (Fun Trading)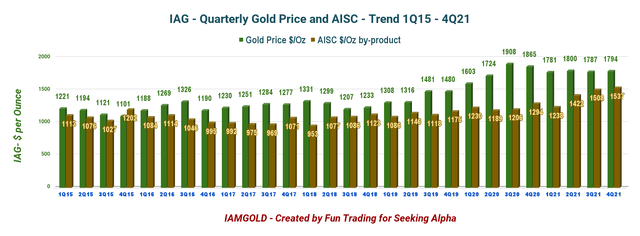
3.3 – Mineral Reserves and 2022 new outlook
3.3.1 – The gold mineral reserves P1 and P2 are slightly down YoY with 12.392 Moz and could translate to an excellent cash flow.
IAG: Mineral Reserves 2021 Presentation (IAMGOLD Corp.)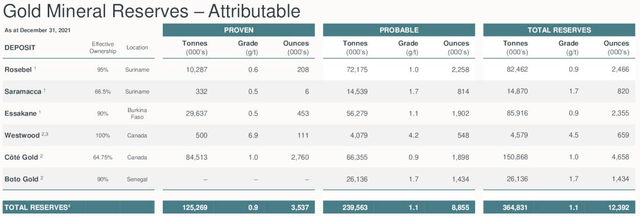
3.3.2 – Guidance is expected to be between 570K and 640K Oz attributable in 2022 with CapEx up to $745 million and AISC going up the roof at about $1,415 per ounce (midpoint).
IAG: Guidance 2022 Presentation (IAMGOLD corp.)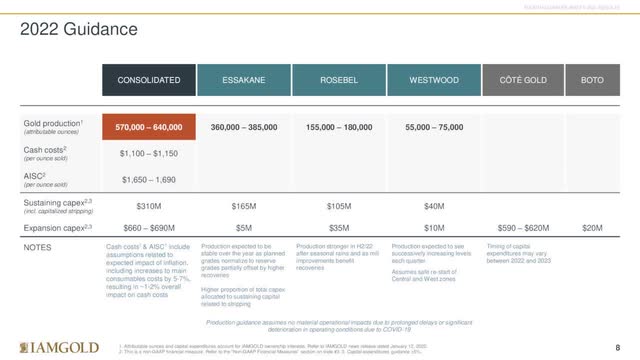
4 – The company had no net debt and strong liquidity of $1.1 billion on December 31, 2021.
IAG: Quarterly Cash versus debt history (Fun Trading)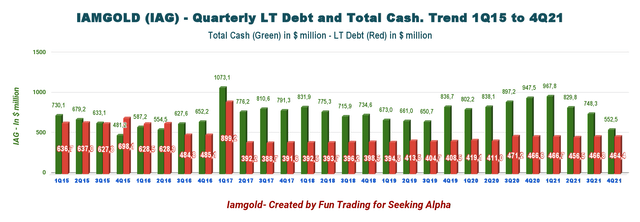
IAMGOLD has no net debt and total liquidity of approximately ~$1.1 billion (including the undrawn credit facility of $500 million and not including restricted cash) as of December 2021.
IAG: Debt and Cash Presentation (IAMGOLD corp.)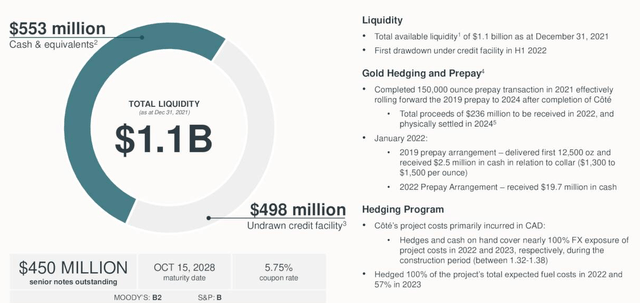
For many quarters, cash position remains the company’s main strength, but it has dropped significantly in 4Q21. The question is, will it be enough to finance Côté Gold?
Technical Analysis (Short Term) and commentary
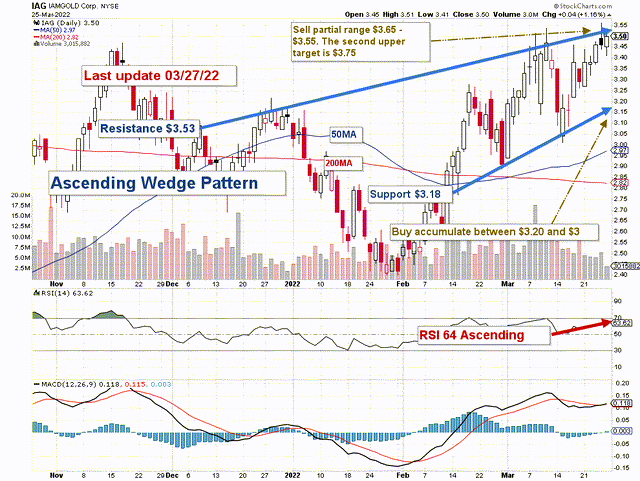
IAG forms an ascending wedge pattern with resistance at $3.53 and support at $3.18.
The short-term trading strategy is to trade LIFO about 60% of your position. I suggest selling between $3.55 and $3.65 and waiting for a retracement below $3.18.
IAG could drop if the gold/silver prices lose the solid momentum for almost two weeks and retest the lower support at $2.82.
Conversely, if the gold/silver prices continue to be bullish due to a frightening jump in inflation and a continued slow response from the Fed, IAG could reach $4.
The issue for gold and silver is what the FED will do about this high-persistent inflation? Gold was going up and reached $1,965 per ounce Friday.
But, the FED has not responded to the inflation threat and was not even aware of its permanent nature. The FED is always slow to react due to political pressure and its lack of vision (behind the curve syndrome).
Another element boosting gold is the Russian invasion of Ukraine, which adds more interest in gold as a refuge. Moreover, the USA has recently increased restrictions to the Russian gold stockpile, which represents about $140 billion that cannot be used, explaining the recent metal strength.
Watch the gold price like a hawk.
Warning: The TA chart must be updated frequently to be relevant. It is what I am doing in my stock tracker. The chart above has a possible validity of about a week. Remember, the TA chart is a tool only to help you adopt the right strategy. It is not a way to foresee the future. No one and nothing can.
Author’s note: If you find value in this article and would like to encourage such continued efforts, please click the “Like” button below as a vote of support. Thanks.


Be the first to comment