

jaminwell
Today I bought several hundred shares of Domino’s Pizza, Inc. (NYSE:DPZ) on a hunch. In about 90 days I will either be a genius or an idiot -please stay tuned. I have always considered myself to be a disciplined technical analyst who believed in Discipline, Discipline, Discipline. I broke all 3 of my Discipline rules:
- Never buy a stock that is not trading above its 20, 50 and 100 daily moving averages, does not have a Trend Spotter buy signal and does not have a 100% technical buy signal. DPZ does not have any of these!
- Never buy a stock that all the pundits on TV are praising. Stuart Varney was following the stock all day and kept featuring it; if I’m wrong it’s his fault!
- Never buy a stock just because you use their product. All the pizzas I’ve ordered from Dominos in the last year have arrived on time, hot and tasty.
Just so you don’t think I’m a total idiot, let me share with you the research I did before I hit the BUY button. Today, it appeared DPZ was bouncing off a low point:
DPZ Price vs Daily Moving Averages ( )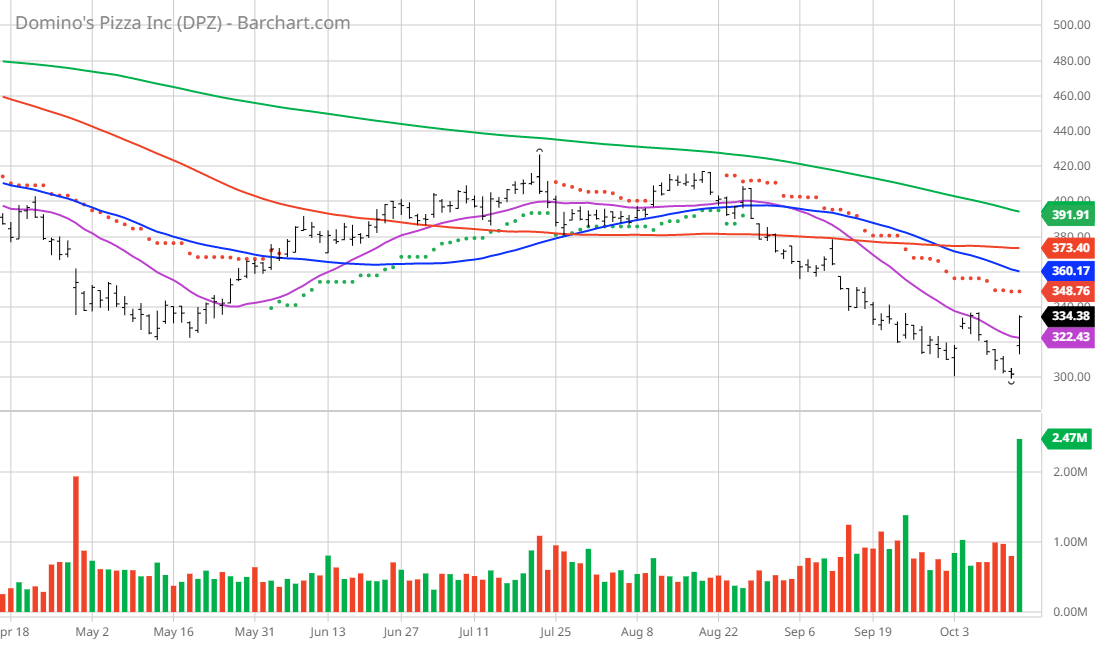
Domino’s Pizza, Inc., through its subsidiaries, operates as a pizza company in the United States and internationally. It operates through three segments: U.S. Stores, International Franchise, and Supply Chain. The company offers pizzas under the Domino’s brand name through company-owned and franchised stores. It also provides oven-baked sandwiches, pasta, boneless chicken and chicken wings, bread and dips side items, desserts, and soft drink products. As of January 2, 2022, the company operated approximately 18,800 stores in 90 markets. Domino’s Pizza, Inc. was founded in 1960 and is based in Ann Arbor, Michigan.
Barchart’s Opinion Trading systems are listed below. Please note that the Barchart Opinion indicators are updated live during the session every 20 minutes and can therefore change during the day as the market fluctuates. The indicator numbers shown below therefore may not match what you see live on the Barchart.com website when you read this report.
Barchart Technical Indicators (looks bad):
- 88% technical sell signals
- Negative 29.40 Weighted Alpha
- 41.11% loss in the last year
- Trend Spotter Sell signal
- Below its 50, 100 and 200 day moving averages
- Lost 4.81% in the last month
- Relative Strength Index 50.70%
- Technical support level at 299.03
- Recently traded at 333.34 which is below its 50 day moving average of 360.17
Fundamental factors (looks OK):
- Market Cap $10.83 billion
- P/E 23.69
- Dividend yield 1.45%
- Revenue expected to grow 5.40% this year and another 6.30% next year
- Earnings estimated increase 17.60% next year and continue to compound at an annual rate of 8.50% for the next 5 years
Analysts and Investor Sentiment — I don’t buy stocks because everyone else is buying, but I do realize that if major firms and investors are dumping a stock, it’s hard to make money swimming against the tide:
- Wall Street analysts have 9 strong buy, 3 buy, 18 hold and 2 sell opinions on the stock
- Analyst’s price targets from 315.00 to 485.00 with an average of 394.63
- The individual investors following the stock on Motley Fool voted 510 to 81 that the stock will beat the market and the more experienced investors voted 144 to 16 for the same result
- 33,310 investors are monitoring the stock on Seeking Alpha
Ratings Summary
Factor Grades
Quant Ranking
Sector
Industry
Ranked Overall
Ranked in Sector
Ranked in Industry
Quant ratings beat the market »
Dividend Grades
Value Line Investment Survey has a long and respected history of giving solid and rational Fundamental Analysis on stocks and they tipped me into pressing the BUY button. Although they rated the stock an average 3 rating, they painted a very rosy picture in their analysis:
- 100 Price Growth Persistence Rating: A measurement of the historic tendency of a stock to show persistent price growth compared to the average stock. Value Line persistence ratings range from 100 (highest) to 5 (lowest).
- 95 Earnings Predictability Rating: A measure of the reliability of an earnings forecast. Predictability is based upon the stability of year-to-year comparisons, with recent years being weighted more heavily than earlier ones. The earnings stability is derived from the standard deviation of percentage changes in quarterly earnings over an eight-year period. The most reliable forecasts tend to be those with the highest rating (100); the least reliable, the lowest (5).
- 3 – 5 Year Price Projection from 590 to 800
- Price Appreciation Potential 95% to 165%
- Total Annual Return from 19% to 28%
- 18 month Price target midpoint at 483.00 for a potential return of 60%
CONCLUSION: Although technical analysis does not show that the stock has had great success recently the fundamental analysis by Value Line, the buy signals of professional analysts and the positive sentiment of the individual investors seem to predict a pretty good possibility of a recovery for this stock. I bought today at 332.29 and in case I’m wrong I put a stop loss in at 283.00 which would limit my loss to 15%.
This play gives me a maximum loss of 15%, and if Value Line is correct, the possibility of a 95% to 165% gain. Although I may seem impulsive at first, I hope you can appreciate the rationality behind my reasoning.
Be the first to comment