

porcorex
Why Pressure Pumpers
Exploration and production (E&P) equities have already rebounded to multi-year highs. In the US, production from tight reservoirs dominates with 70% of U.S. natural gas and 60% of U.S. oil produced from tight reservoirs according to the EIA. Metaphorically, maintaining production in tight reservoirs is more like mowing the lawn than planting a tree. New wells in tight reservoirs must be drilled and fractured in order to maintain production. At the same time, many oil field services (OFS) equities including hydraulic fracturing companies (HFCs) have lagged the recovery of E&Ps.
On July 19th, Halliburton (HAL), the world’s biggest provider of hydraulic fracturing, reported Q2 results with solid beats on earnings and revenue. Seeking Alpha reported North American Q2 revenues grew 55% Y/Y and quoted CEO Jeff Miller:
In North America, I expect Halliburton to uniquely maximize value in this strong, steadily growing, and all but sold-out market. Pricing gains across all product service lines supported significant sequential margin expansion.
Given that HAL, the largest provider of hydraulic fracturing recently posted a big quarterly beat, my thesis is HAL’s fabulous earnings trend might soon extend to other HFCs.
E&Ps have rebounded to multi-year high with OFS lagging
5-Year Price History: Crude Oil & Energy ETFs
Seeking Alpha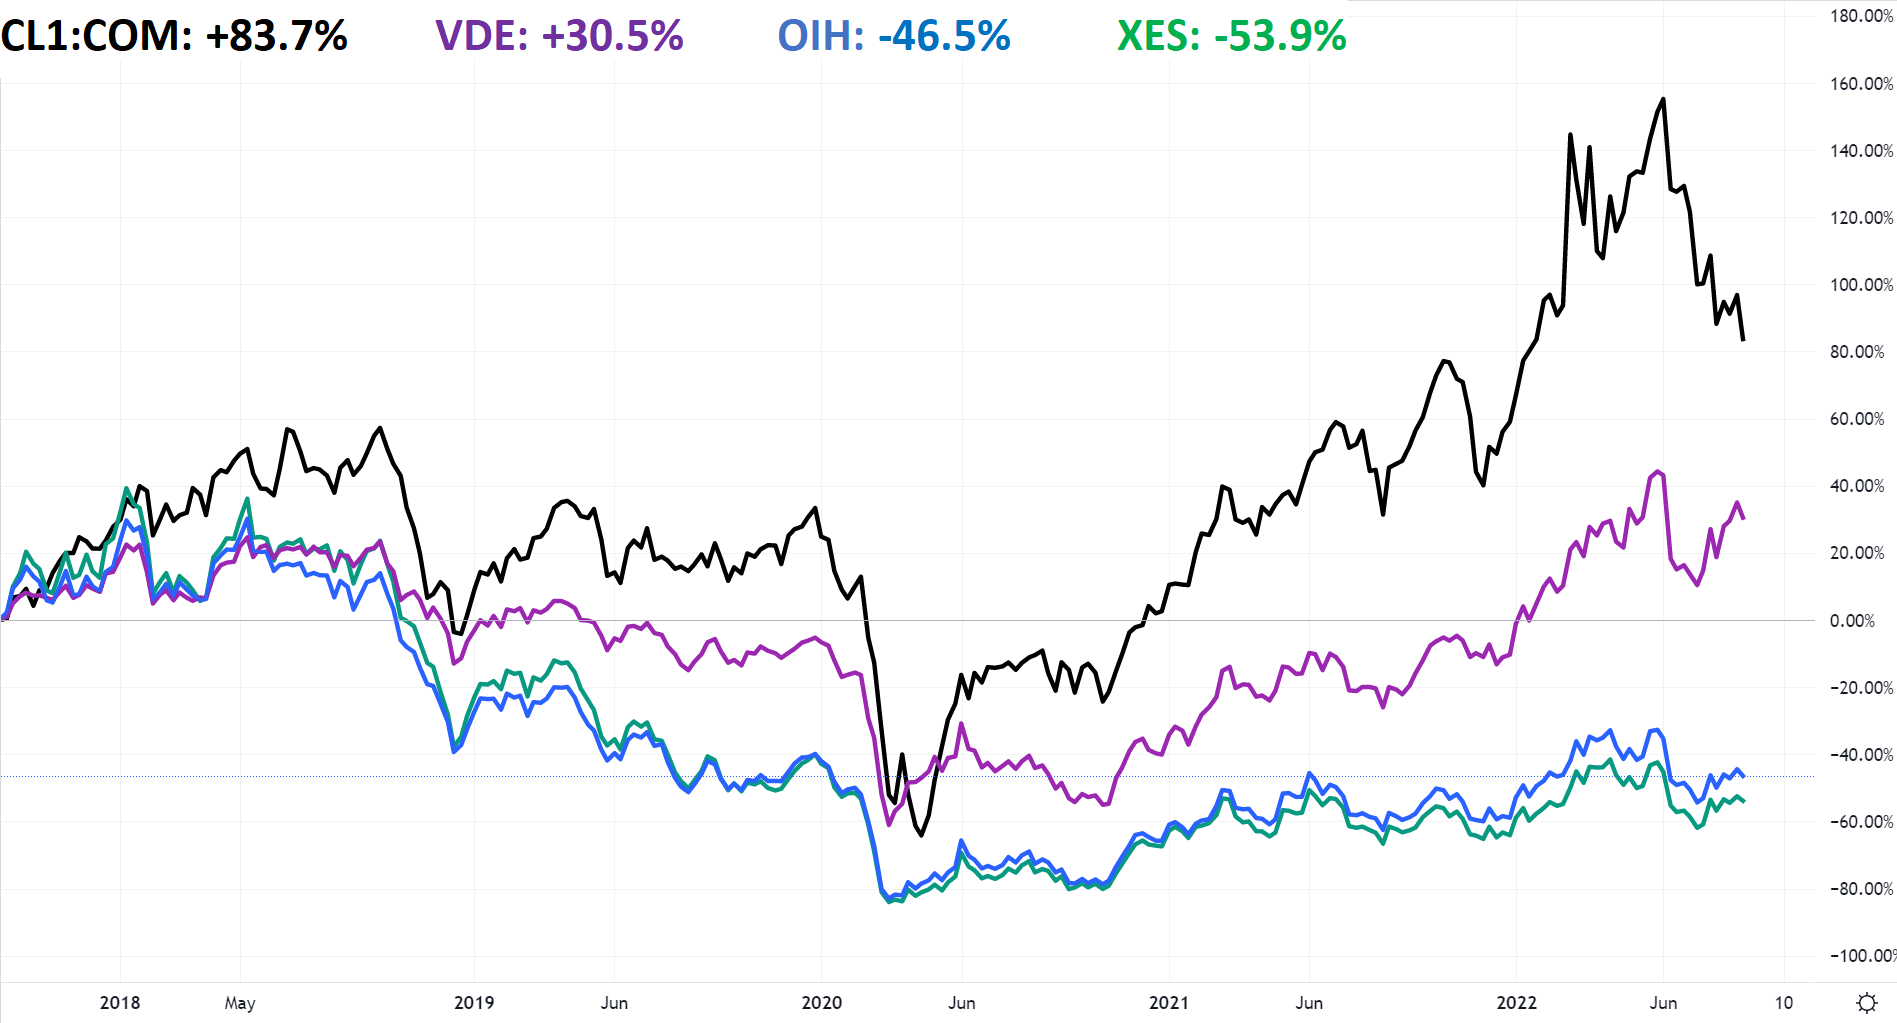
Market Cap Distribution: OIH and XES
Author, BOA Data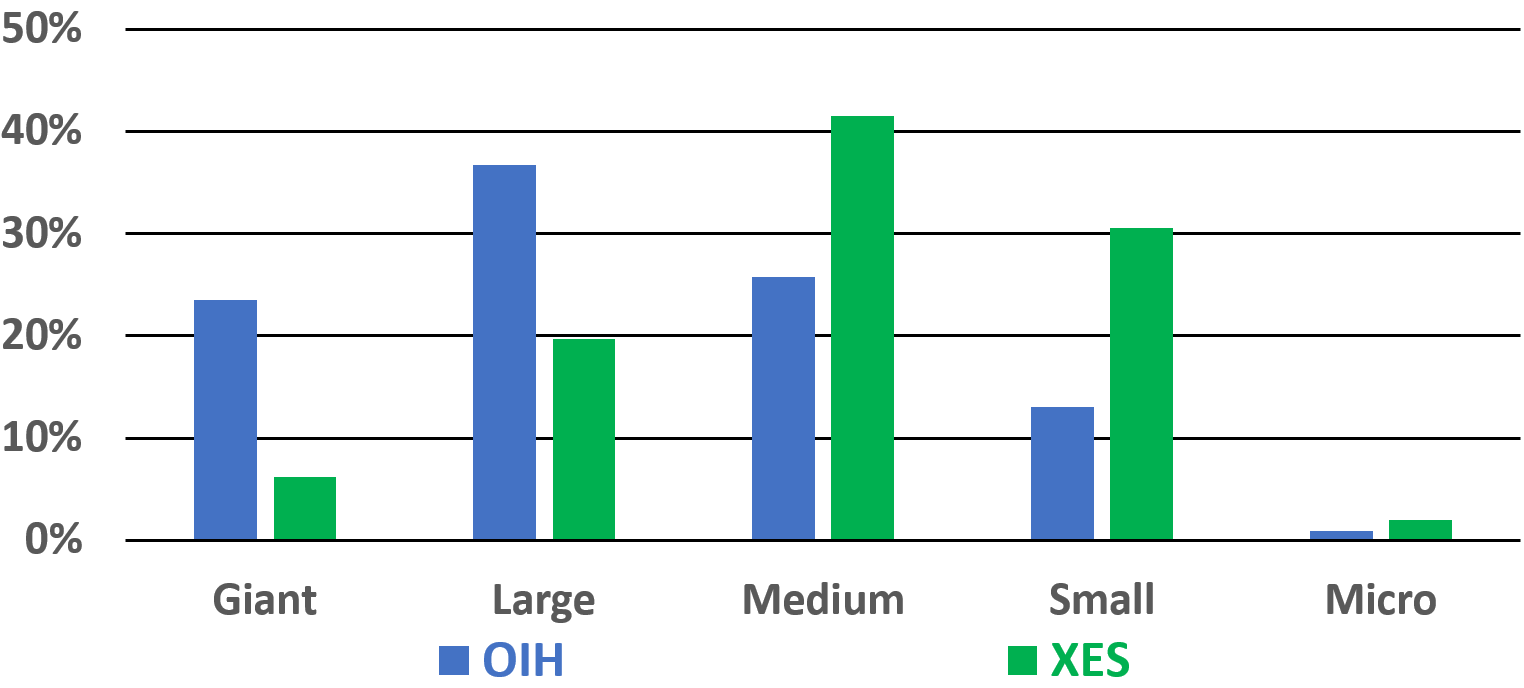
I recently analyzed OIH and XES in light of US production from tight reservoirs and rated both a buy. Both are 100% OFS ETFs, but OIH holdings are dominated by giant and large caps including SLB, HAL, and BKR while XES holdings are distributed towards medium and small caps.
Haliburton vs Smaller Cap Hydraulic Fracturing Peers
5-Year Price Return
Seeking Alpha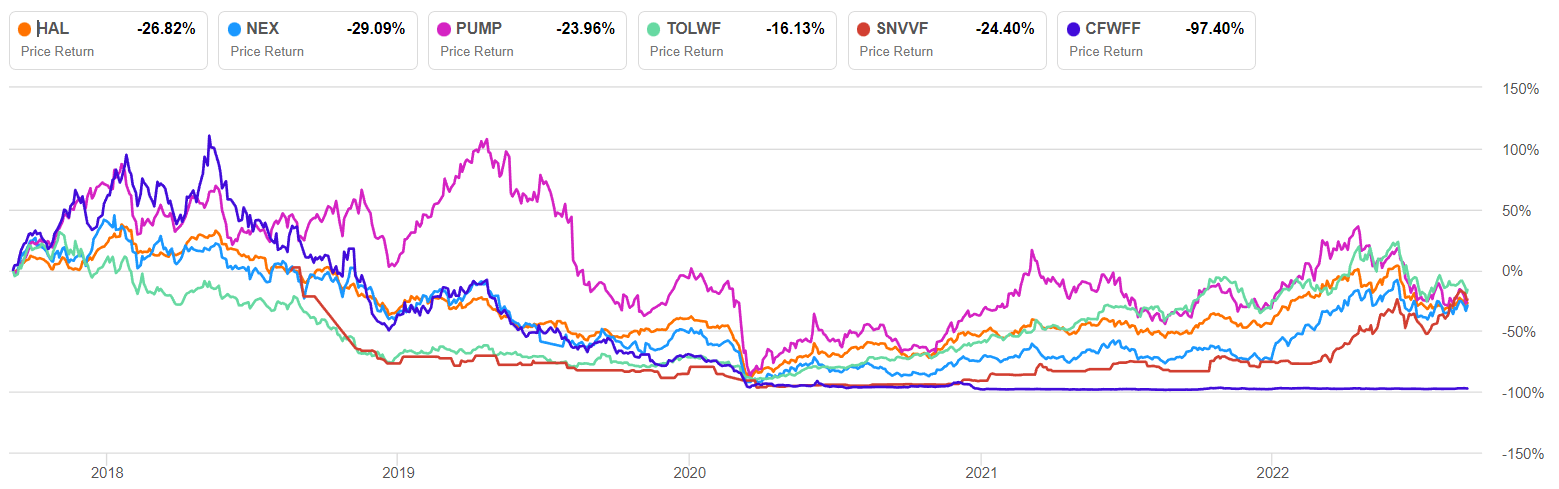
5-year price return is plotted for six hydraulic fracturing companies (HFCs): HAL, NexTier Oilfield Solutions (NEX) ProPetro Holding Corp (PUMP), Trican Well Service (OTCPK:TOLWF), STEP Energy Services (OTCPK:SNVVF), and Calfrac Well Services (OTCPK:CFWFF). Most are rebounding from 2020 lows, yet all are still below 5-year highs.
3-Year EBITDA (TTM)
Seeking Alpha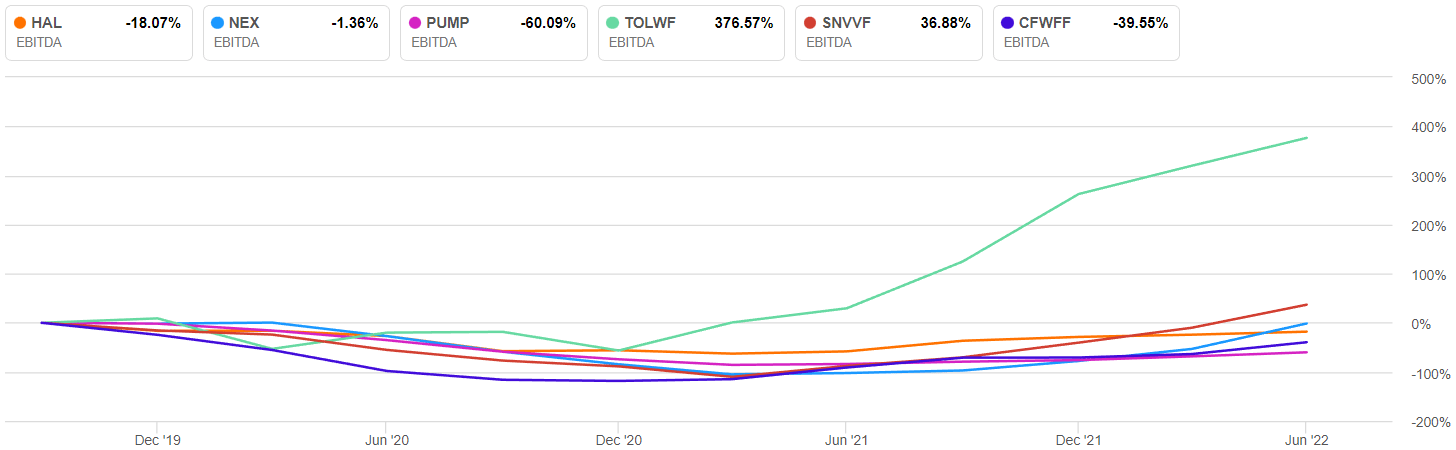
3-year EBITDA (TTM) is plotted for the same six HFCs. TOLWWF EBITDA has grown over 400% since Late 2020. The other 5 HFCs have increased EBITDA about 50% since mid-2020.
6-Month EV/EVITDA
Seeking Alpha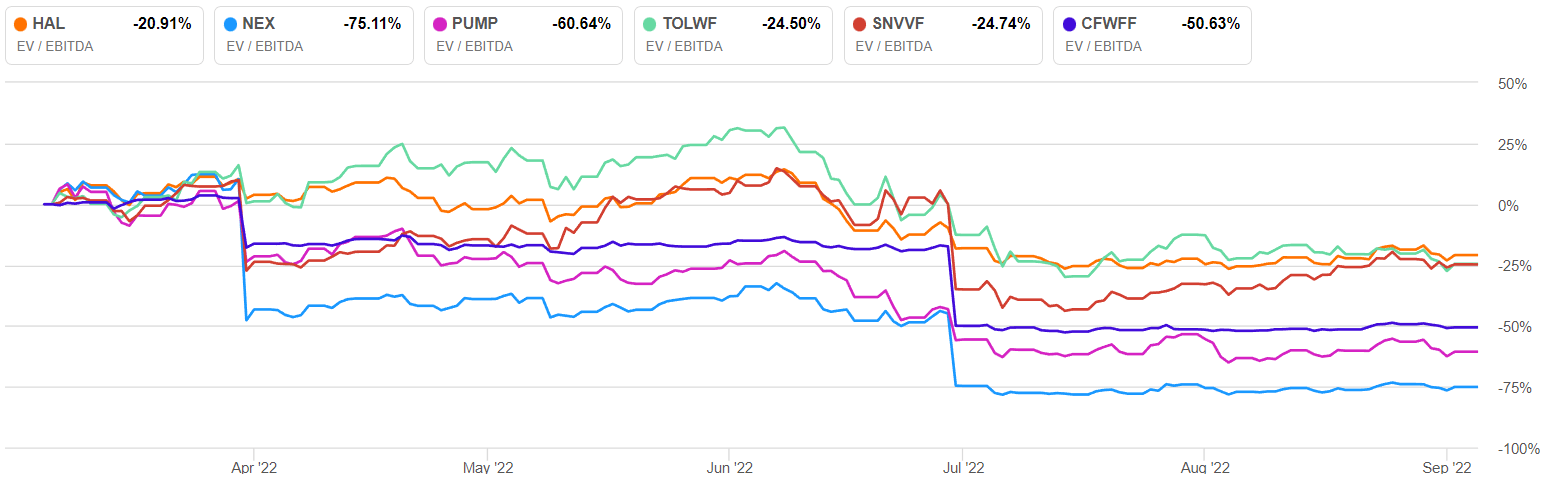
6-month EV/EVITDA is plotted for the same six HFCs. The steep decline in late June is concurrent across all six HFCs and the beginning of crude oil’s slide from a short-term peak of about $111/bbl to less than $90/bbl presently. The sharp drop in EV/EBITDA is amplified by increased EBITDA not yet reflected by price return. Unrecognized value appears to be indicated and a further screen could be useful.
Hydraulic Fracturing Companies: Value Matrix
EV/EVITDA is a common value metric and is the primary factor for the value matrix. Smaller EVITDA values are most favorable. The value matrix and its factors were designed and calculated by the author within a downloadable Excel spreadsheet with Seeking Alpha sourced data. The value matrix is designed to enhance the primary factor (EV/EVITDA) by subtracting secondary factors: growth, profitability, ownership, and debt. My intention is that the matrix identify those HFCs with the most value, growth and profitably. Further, ownership and debt factors are considered at 1/2 weight. Please note NEX source data for growth was unavailable and that value is tabulated as zero.
Value Matrix Chart
Author, Seeking Alpha Data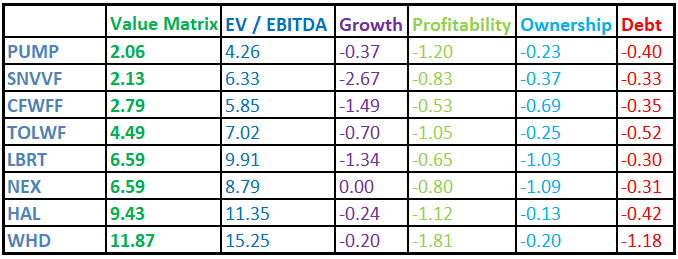
In addition to those HFCs previously discussed, Cactus (WHD) and Liberty Energy (LBRT) are included in the value matrix screen. For each HFC: the value matrix, its primary factor – EV/EBITDA, and its secondary factors are plotted on the Value Matrix Bar Graph below.
Value Matrix Bar Graph
Author, Seeking Alpha Data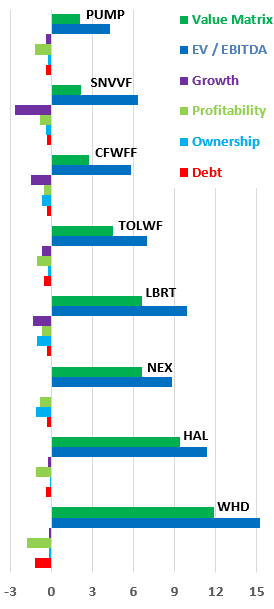
Value matrix is represented by the dark green bar, and is the sum of the factors.
EV/EBITDA – the primary factor (the blue bar).
Growth Factor – this secondary factor (the purple bar) is normalized by dividing each HFC’s EBITDA YoY by the average of that metric for each HFC, its weight is 1.
Profitability Factor – this secondary factor (the light green bar) is normalized by dividing each HFC’s EBITDA Margin by the average of that metric for each HFC, its weight is 1.
Ownership Factor – this secondary factor (the light blue bar) is normalized by dividing each HFC’s Insider % by the average of that metric for each HFC, its weight is 1/2.
Debt Factor – this secondary factor (the red bar) factor is normalized by dividing each HFC’s EBITDA Margin by the average of that metric for each HFC, its weight is 1/2.
Investor Takeaways
Based on the value matrix, those investors who hold WHD, HAL, and LBRT may wish to review their positions; HFCs with lower matrix score may hold more promise. These include PUMP, CFWFF, and SNVVF. However, the matrix and/or its factors may not forecast future price return of any of the HFCs screened. The performance of factors considered may not be repeatable going forward; eg exceptional growth may not be repeatable. Every investment decision regarding an individual equity should be based on comprehensive analysis of that equity.
Pump has recently been covered by Fluidsdoc in a thorough and well written analysis. SNVVF was recently covered by Laurentian Research in an exceptionally well written and rigorous analysis. Be on the lookout, I may cover CFWFF soon.
Investors should consider the value matrix a screen only. The matrix; primary factor; secondary factors, normalization method, and weights could all be adjusted and yield different results. Some readers may conclude that I have created a horrifying monster. I would appreciate their feedback: download the Excel spreadsheet and work it over to better screen HFCs given current market conditions & available data. Or modify it completely and apply it to whole new set of fuzzy data. I hope some readers find it interesting and I look forward to comments.
Wonder is the beginning of wisdom – Socrates
Be the first to comment