

manaemedia/iStock Editorial via Getty Images
HP Inc. (NYSE:HPQ) operates in a cyclical business but generates a lot of cash. The management is returning vast amounts of cash to shareholders via buybacks. The company saw a pull forward in demand in 2020 and 2021 and currently carries higher inventory levels than usual. The company trades at a compelling valuation, reflecting the deteriorating demand environment for its products. It may be best to wait for Q3 2022 earnings before building a substantial position in this stock.
Operating Leverage Delivered a Bumper Harvest in 2021
The rise in remote working and learning environments delivered a sales bonanza for the Personal Systems segment for HP in 2020 and 2021. The company saw strong demand for Chromebooks, Consumer PCs, and a shift in product mix from low-end to premium products in commercial PCs. Personal Systems revenue increased by 11% in 2021 compared to 2020, while operating income increased by 34% [Exhibit 1]. The Personal Systems segment has shown significant operating leverage in 2019, 2020, and 2021 [Exhibit 2]. We can measure the degree of operating leverage as a ratio of change in operating income to change in revenue.
Exhibit 1: HP Inc. Personal Systems Segment Revenue and Operating Income
HP Inc. Personal Systems Segment Revenue and Operating Income (SEC.gov, Author Compilation)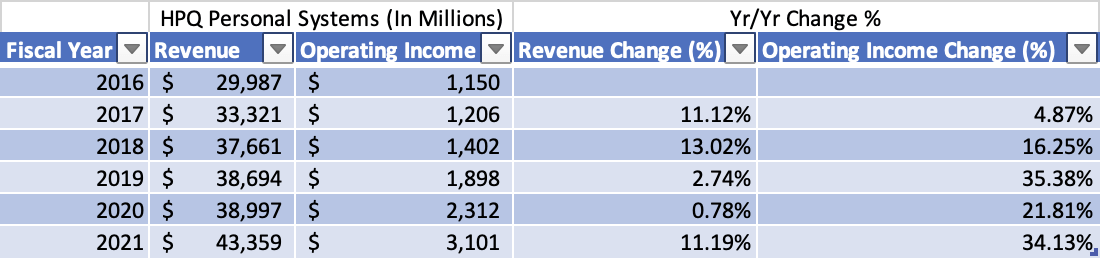
The company’s Printing segment had a very tough 2020 when revenue decreased by 12% and operating income reduced by 22% compared to 2019. But things improved in 2021 when revenue increased by 14% and operating income increased by 45%. The company is slowly moving its profit mix towards selling profitable printer hardware upfront. The company indicated that about 21% of its printer hardware sold was profitable at the time of sale. The company also has a growing printer ink subscription business with annual subscription revenue of approximately $500 million. The churn rate on its subscription business currently stands at 1% per month [Exhibit 3], but one should expect it to go much higher in a recession. The printer ink subscription business is not battle-tested in a downturn, given that it is a consumer discretionary purchase.
Exhibit 2: HP Inc. Personal Systems Operating Leverage [2019-2022]
HP Inc. Personal Systems Operating Leverage [2019-2022] (SEC.gov, Author Calculations)![HP Inc. Personal Systems Operating Leverage [2019-2022]](https://static.seekingalpha.com/uploads/2022/7/21/28462683-16584605084909623.png)
Exhibit 3: HP Inc. Number of Subscribers and the Churn Rate for its Ink Delivery Business
HP Inc. Number of Subscribers and the Churn Rate for its Ink Delivery Business (HP Inc. Investor Presentation)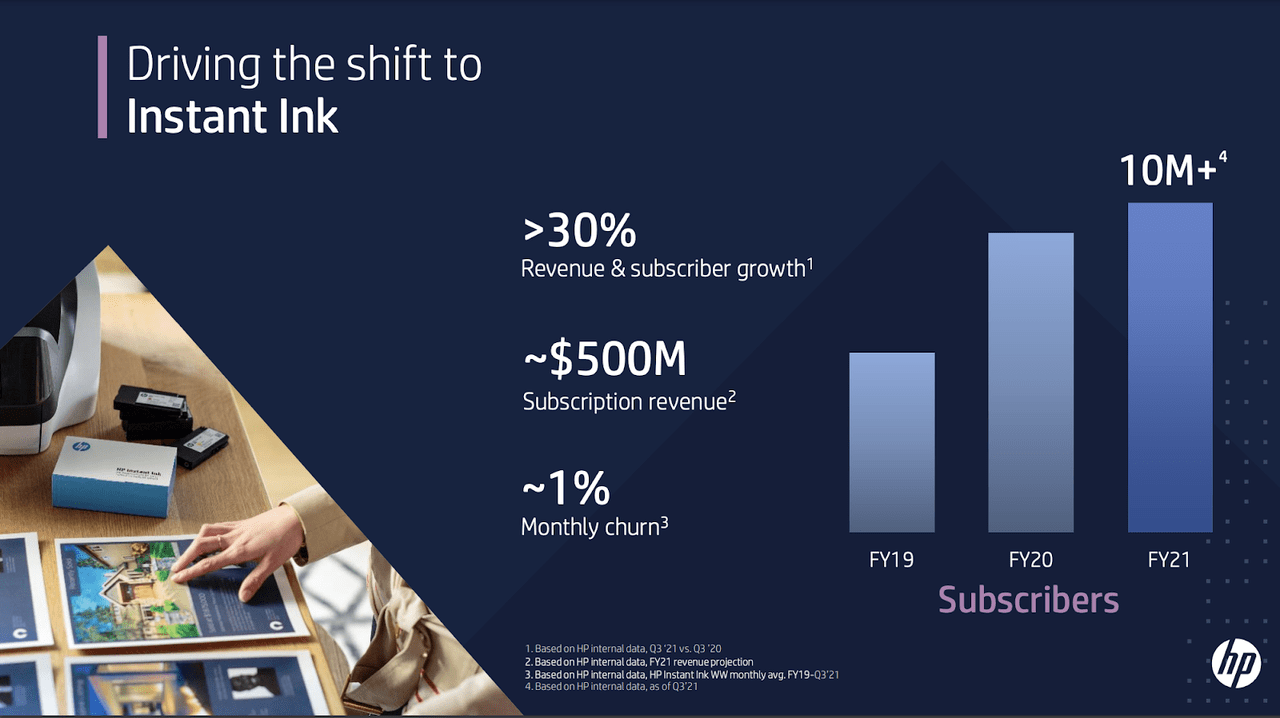
PC Demand in Decline for the Rest of 2022
Both business segments benefitted greatly from the operating leverage in their business model in 2021. The operating leverage helped the company record massive operating cash flows. Operating cash flow increased from $4.3 billion in 2020 to $6.4 billion in 2021 [Exhibit]. The 2021 operating cash flow will be a high watermark for the company. In 2021, consumers pulled forward demand and had money in their pockets to spend on personal computers [PC] and accessories. For the first six months of 2022, which ended on April 30, the company reported an 11.3% decline in unit volumes in its Personal Systems segment.
Demand for personal computers may remain muted for the next two to three years, when the industry may be ready for the next replacement cycle. International Data Corporation recently released a report stating that PC shipments have declined 15% yr/yr Q2 2022. There may be further declines in PC shipments during the rest of the year. Recently, SK hynix froze a $3.3 billion investment in expanding its memory business, citing cooling market demand and higher costs. Taiwan Semiconductor Manufacturing (TSM) warned that many of its customers have excess inventory that could hamper its sales for the rest of the year. Even Microsoft (MSFT) may not be immune to moderating demand in the face of slow economic growth. HP may see sluggish demand for its products in the year’s second half, especially in its Personal Systems segment.
The company’s cash flows could be much lower if we assume that sales are going moderate at HP. But, the company may have most of this news already priced in its share price. The company is trading a forward GAAP PE of 8x and a forward Price to Sales of 0.5x. The company’s historical Price-to-Sales multiple is 0.57x, and its five-year price-to-earnings multiple is 9.7x. The company is trading close to its historical multiple in terms of price-to-sales. At the same time, trading at a slight discount to its five-year average PE ratio. But, the last decade also saw historically low-interest rates that lowered the company’s capital cost. We may soon enter an era of normal interest rates assuming inflation subsides in the coming months. Companies have seen their cost of capital increase substantially in the past few months. Highly indebted companies with debt to EBITDA ratios above 3x are aggressively paying down debt. AT&T (T) and Energizer Holdings (ENR) are companies with high Debt to EBITDA ratios that have prioritized debt repayments.
I have estimated HP’s weighted average cost of capital [WACC] at 7.89% based on the current risk-free rate of 2.95% [10-year U.S. Treasury interest rate]. Over the past five years, the company has delivered a massive return on invested capital [ROIC]. It currently stands at 133%, but ROIC should drop in the coming quarters [Exhibit 4]. It would still be a massive ROIC, even if it returns to its pre-pandemic level above 60%.
Exhibit 4: ROIC of HP Inc., Dell, and Seagate Technology
ROIC of HP Inc., Dell, and Seagate Technology (Seeking Alpha)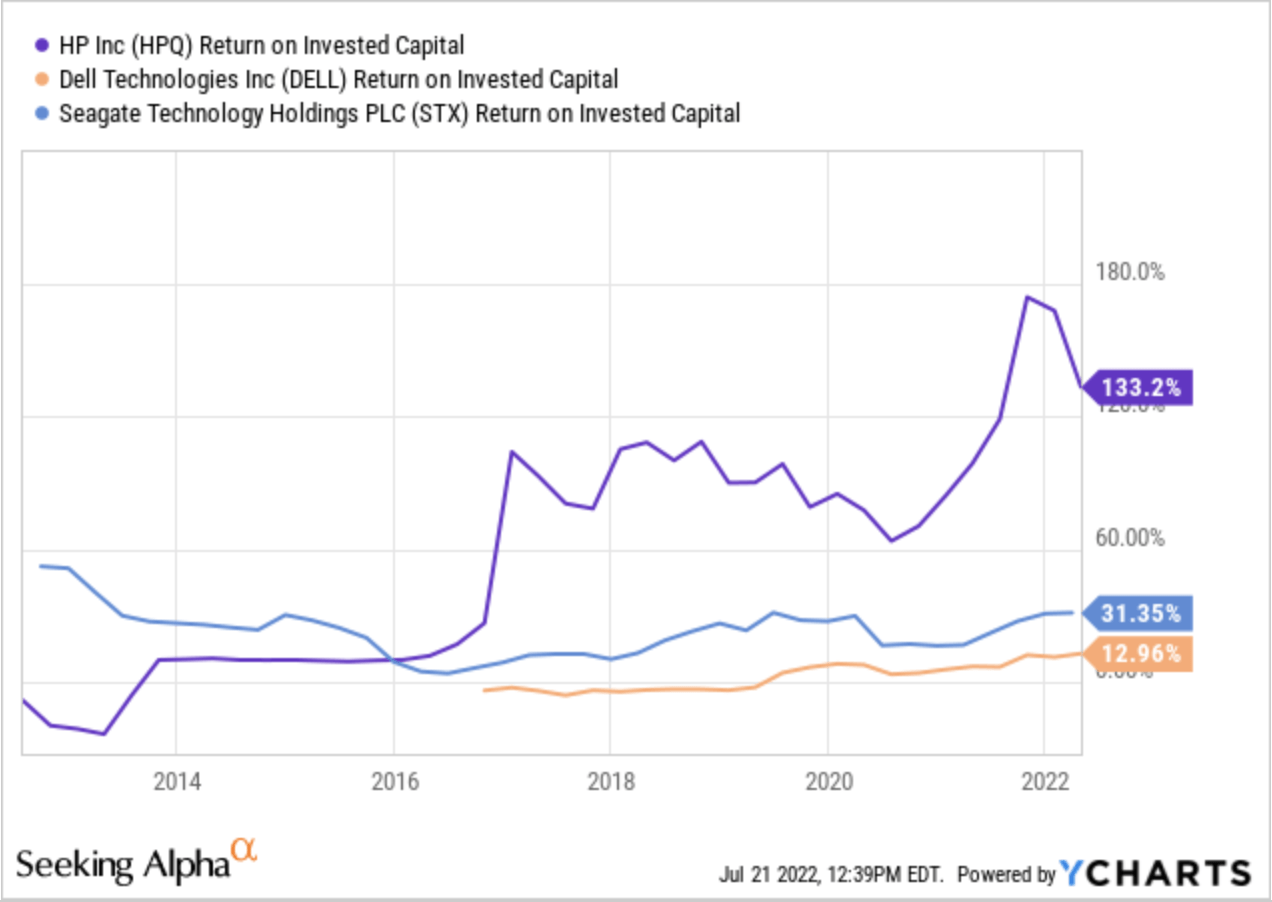
Cash Conversion, Dividend, and Share Buybacks
The company is very efficient in converting its net income into cash, with an average cash conversion ratio of 1.44x. In fact, since 2014, there were only two years – 2018 and 2021- in which its cash conversion ratio was below 1x. In 2021, the cash conversion ratio was below 1x [actual 0.98x] due to a massive inventory build-up. The company is very efficient in deploying its capital and does not need to spend enormous amounts on capital expenditures.
The company’s property, plant, and equipment investment averaged $611 million between 2019 and 2021 while its depreciation and amortization expenses averaged $772 million during those years. The company also carries very little inventory except during a great year like 2021. The company can gain more cash flow due to lower inventory and capital expenditures and higher depreciation. But, at the end of April 2022, the company still carried $1.2 billion in inventory. The company probably overestimated the demand for its products or overreacted to various supply chain disruptions during 2021 and the beginning of 2022. HP may have to resort to discounting to sell its inventory during the rest of the year. The high inventory levels and the comments from management about softening demand in the consumer space do not bode well for the company’s financial performance for the rest of the year.
The original Hewlett-Packard Company was split into two companies in November 2015. Since then, HP Inc. has spent $16.8 billion buying back its shares. This massive buyback has resulted in a weighted average diluted share count drop from 1.83 billion at the end of FY 2015 to 1.22 billion in FY 2021 – a reduction of 616 million shares – a 33% drop in share count. The company paid an estimated average price of $27.27 per share over the years.
The company paid $970 million, 997 million, and 938 million in total dividend payments in 2019, 2020, and 2021. The dividend payments were easily covered by the company’s operating cash flow of $4.6 billion, $4.3 billion, and $6.4 billion in operating cash flow in 2019, 2020, and 2021. The company’s shares currently yield nearly 3% compared to the 1.63% Vanguard S&P 500 ETF (VOO) yield. The payout ratio is a very manageable 21%.
Price Performance Comparison
HP Inc’s stock has performed well over the past year while the rest of the markets have tanked. The stock has returned 17% in the past year, the S&P 500 has lost 8.2%, and the Vanguard Information Technology ETF (VGT) has lost 12%. The stock’s performance or the support for the stock price may be partly attributed to the vote of confidence from Warren Buffett, who took an 11% stake in the company. HP’s competitor Dell Technologies in down 8% in the past year.
Patiently Build a Position in HP Inc.
The company is already trading cheaply, and I like the business for the long term. But, this company has never sold at a rich multiple. It may be all right to build a tiny position in this stock before the next earnings release on any near-term weakness. This stock is not going anywhere fast in the short term. Wall Street analysts are equally divided on this stock’s prospects, with five up revisions and five down revisions in its quarterly EPS in the last three months. But, given the rapidly deteriorating economic environment, it may be prudent not to build a significant position until the release of Q3 2022 earnings scheduled for August release.
Be the first to comment