

Inflation Is Resulted In Human Action
There is an old book I once read about Germany’s hyperinflation episode written in 1975 called “The Great Inflation.” In the introduction of this book, the authors, William Guttmann and Patricia Heehan, write:
Inflation is not an Act of God. Unlike natural disaster, such as floods, drought, earthquakes and crop failures, which can change the economic conditions of nations, inflation is man-made and can be started, prevented, regulated and stopped by human action.
Governments, however, are not almighty; their decisions will be the result of a struggle between those who have an interest in inflation and those who prefer a stable currency.
I tend to agree with the above statement. It is very important to appreciate that there are those with an interest in high inflation. Debt holders, who can then pay off their old debt with lower valued new money would be one such winner. Government policy makers who want to provide funds for greater social welfare programs or grand infrastructure projects that would require a large boost in new debt would also be a winner in a high inflation environment.
At the same time, there are those with an interest in a stable currency like those on fixed incomes or those with large savings in bonds or bank deposits.
Hence the struggle between the two.
In the end, as this book would repeatedly point out, everyone losses when there is simply too much inflation.
Medium Of Exchange
At the heart of inflation is debt growth or more specifically, debt growth per capita. Money is simply a medium of exchange. In the US, we have a debt based money system where all money is debt. The debt is divided up between Government debt and private debt between individuals and businesses generally.
It’s the rate of growth of this debt that is the starting point from which we can begin to understand how past rates of inflation came to be and at the same time, begin to predict what the future rates of inflation might be.
Things like M2 money supply of the velocity of money are simply noise in my opinion. I have not found them to be of any real attributing factor to inflation. The elephant in the room is aggregate debt growth per capita.
Inflation is said to be targeted at 2% per year by the Federal Reserve as a means of accomplishing a number of things:
1. Keep prices stable is the main reason.
2. Keep the money in the banking system. Keep deposits in the bank so as to earn interest vs. leaving money under the mattress where it would depreciate in value.
3. Entice people to spend today rather than wait for prices to drop in the future.
4. Provide new money to pay for the debt service of all the debts issued in the past which charge interest.
5. Constantly provide funds for new investment that replaces old investments that have depreciated, reached their end of life or became obsolete.
That has generally always been the policy in mind in the US with various degrees of success. What’s important however has been to ensure that inflation does not go below 0% and that would result in deflation and could lead to a massive credit crunch and potential depression like we had in the 1930’s.
Inflation Formula
Inflation can be looked at with this simple formula in mind:
Credit growth per capita – Productivity = Inflation
The very first measure of what to look for in the inflation rate is how it relates to the rate of the growth is debt.
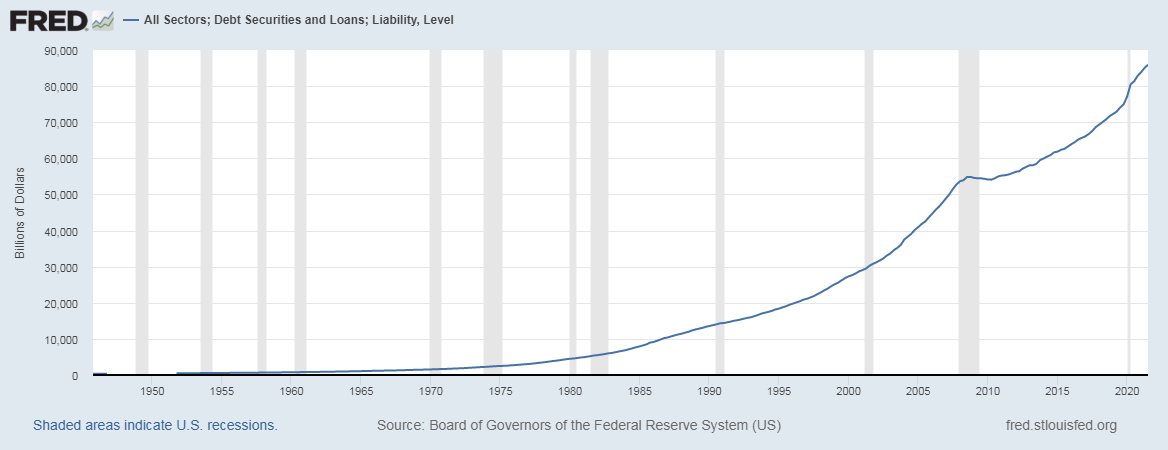
Here is a chart of the overall level of debt in the US:
As of the third quarter of 2021, there was $85.923 Trillion in debt.
To see how the rate of credit growth per capita (Blue Line) impacts the rate of inflation, I’ll include the rate of inflation (Red Line) in this chart below showing both:
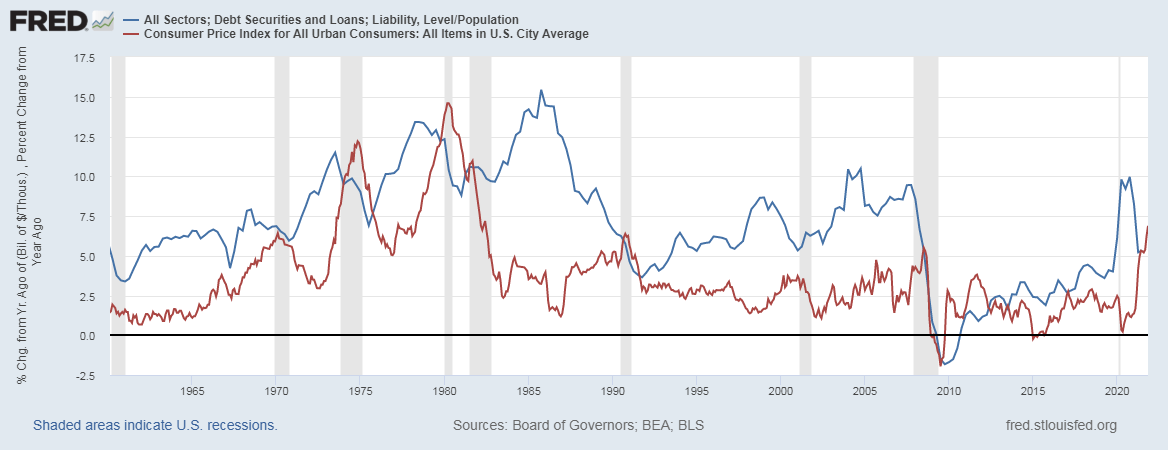
Each and every year, trillions of dollars in new debt get issued and released into the economy. To give you a better idea of how much new money gets issued each year, this chart below shows the amount of new debt issued as a percent of GDP that year.
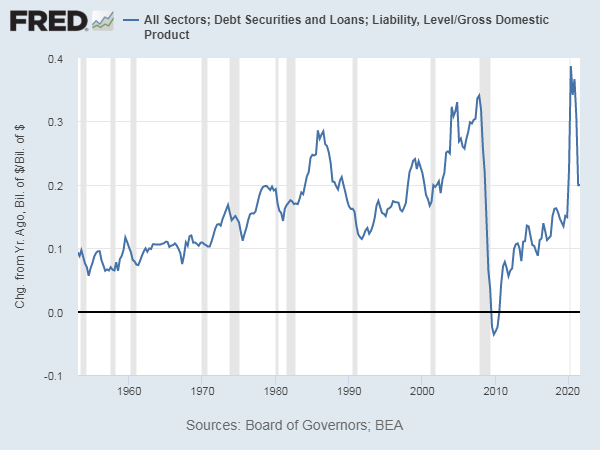
In the third quarter of 2021, new debt issued over the previous four quarters was equal to 20% of GDP. At the peak of debt issuance in the second quarter of 2020 as a response to all the economic lock-downs and such, new debt equaled nearly 38.5% of GDP.
All that new debt issued is what provides the funds to effectively achieve the goals of the Federal Reserve. Thus, they raise and lower the cost of borrowing to either entice more borrowing or they stifle borrowing to lower that rate of debt growth to the best of their ability.
This brings us to the next component of inflation: Productivity
Productivity
Productivity can be looked at as input costs. The very word economy has for one of its definitions, the careful measurement of resources. When there is profit motive, all the more reason to carefully measure resources to ensure their most efficient use.
When we look at productivity, we are looking at all input costs and their factors. For the economy as a whole, these include but are not limited to the following key factors:
1. Cost of raw materials or commodities, i.e. wood, oil, tin, corn feed, etc.
2. The value of the US dollar relative to trading partners.
3. General productivity improvement. This can be had with new tools/technology and equipment or new ways of doing something that are more efficient.
At the end of the day, all these factors will have an impact on the final level of output per hour worked or productivity which can lead to lower prices.
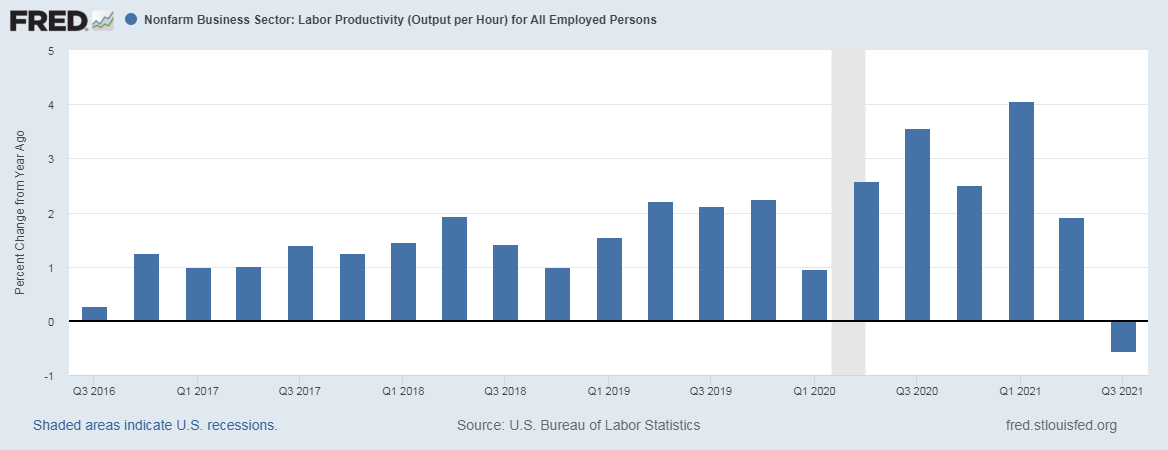
Here is a chart showing annual growth rate of output per hour:
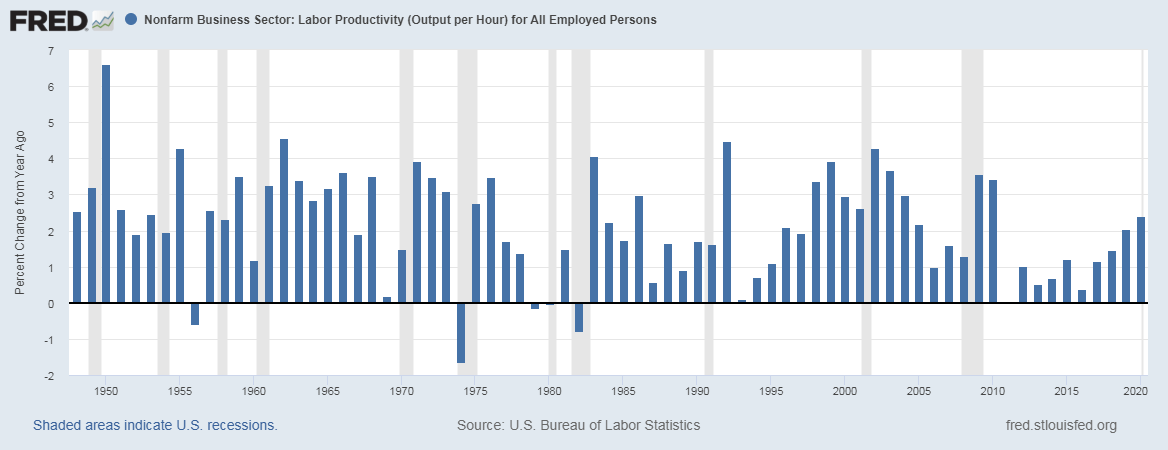
Productivity generally grows between 1% to 4% per year on average. It’s a deflationary force as the reduction of input costs results in a reduction in the end cost of the product or service. With the 2% inflation target going, then if the company can reduce the cost to make something by 2%, but there is 2% inflation, then the price of the product can stay the same, hence stable prices.
Meanwhile, the worker gets a 4% raise, half of which gets eaten up by inflation but the other half provides them with more purchasing power to buy other products or services and grow the economy.
It’s the new money driven by all the debt growth that pays for all these increases in prices.
If we add the rate of productivity to the rate of inflation, the line comes far more in line with the rate of credit growth per capita:
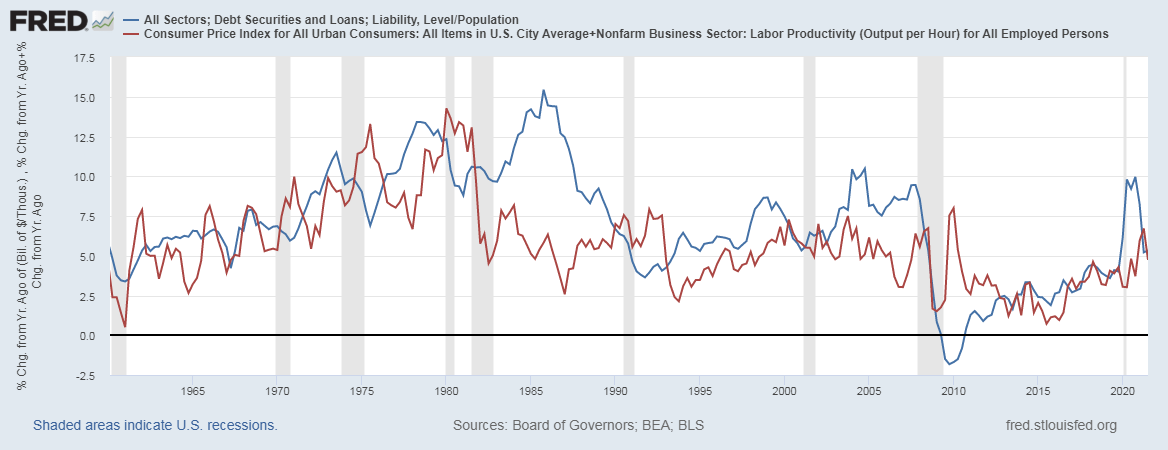
Take note that when there are times when the credit growth exceeds the rate of inflation + productivity like in the 1980’s, again in the 1990’s, the 2000’s and just recently as well, it’s usually met with high delinquency rates and debt defaults, thus lowering the rate of overall debt growth as some debts were defaulted upon and written off. This happened more so in the early 1990’s, early 2000’s and again in the last “great recession” of 2008 and 2009. So it is possible that we could see an increase in debt delinquency in the coming year or so.
Looking At Inflation Today
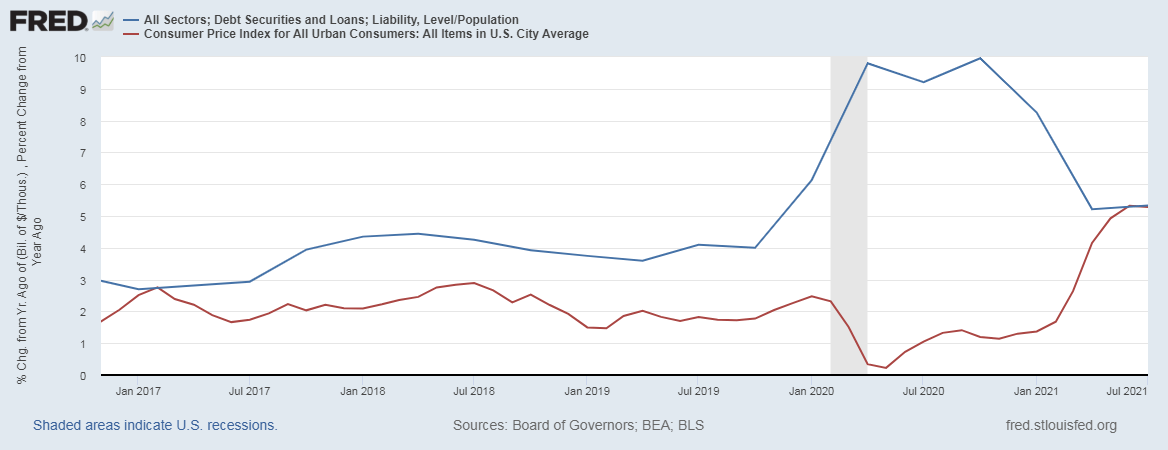
Between 2020 and 2021, there was a deluge of credit growth mainly driven by the Federal Government’s response to the pandemic related measures. The initial inflation response was limited on account of collapsing demand that sent commodity prices lower, particularly energy prices. By the Spring of last year, inflation would come back strong with demand coming back as the economy and schools began to open back up. Inflation meanwhile, has risen to an annual rate of 7.00% as of December of 2021.
Knowing that inflation would run rampant with such an increase in debt growth per capita, we can see that the annual rate of debt growth is now slowing back to historical norms as of the third quarter of 2021 of around 5.25%. The Fed is now also signaling that they will raise interest rates to help stifle debt demand and slow the monetary inflation that comes with it.
This doesn’t mean that inflation can now come back down to 2% so easily, the other factors will play their part too and those are not as easy to control.
The Various Other Factors
Let’s start with commodities. The best way to look at this is from a year over year perspective. If it cost you $2000 last year to heat your home and this year, it costs $3000, then that cost of energy is going to be an inflationary force. The inverse would be true of the price to heat your home went from costing $3000 to $2000 as that would prove to be a deflationary force.
Here is a long term chart of the producer price index of all commodities:
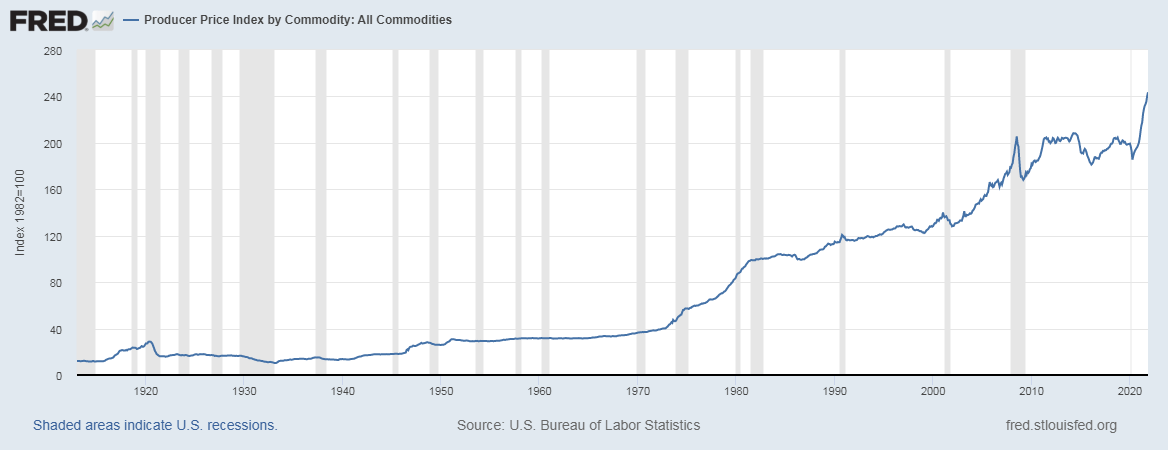
The price of commodities as a whole has been rocketing higher all year and continues to do so. These increases continue to have great impacts on everyone’s cost sheet.
The year over year chart looks like this:
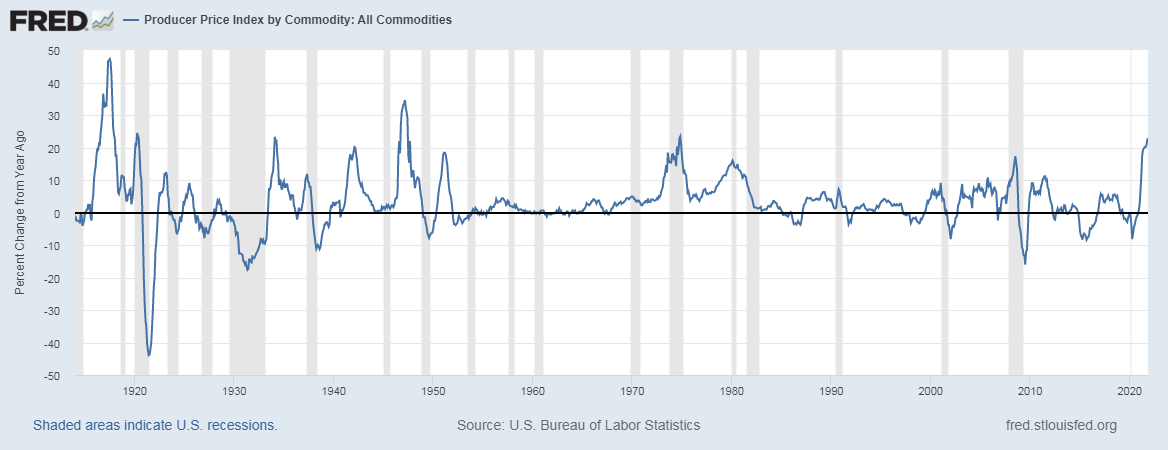
The producer price index of all commodities is up 22.84% year over year as of November of 2021. Huge spikes like this have always been met with just as large declines in the rate of growth. For now and going into the coming months, higher commodities prices are a major inflationary force.
Until we see flat or lower rates of growth in all commodities, then this will continue being an inflationary force.
Next is the value of the dollar. A stronger dollar helps keep commodity prices in check whereas a weaker dollar makes commodities more expensive in dollars vs. other currencies. Same goes for imports from our trading partners.
Here is a chart of the Nominal Broad U.S. Dollar Index:
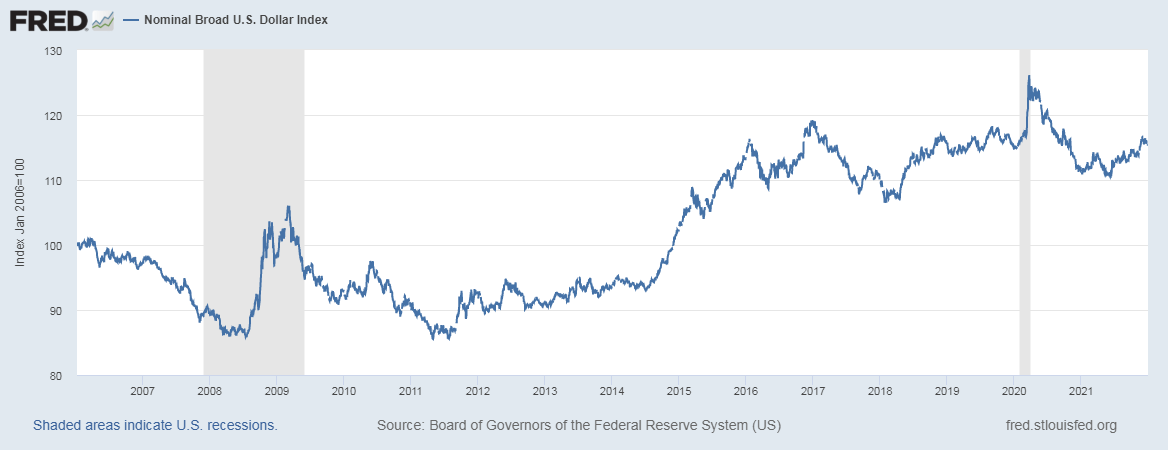
This chart goes back to 2006 and gives the impression that the dollar has been in a bullish trend and remains elevated. It has more or less helped contribute to keeping input costs down and acted as a deflationary force for much of the 2010’s. Where the dollar goes from here is important. If it begins to move into a bearish longer term trend over the next 10 years, then it will prove to be an inflationary force.
The year over year chart of the dollar looks like this:
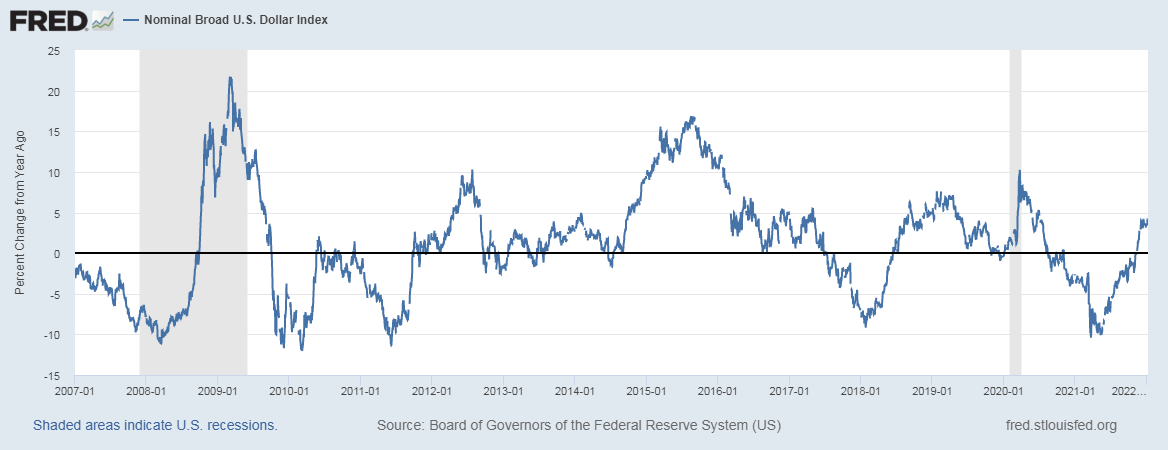
Having a strong dollar or medium of exchange is a very nice thing to have. While in late Spring of last year, the dollar was down nearly 10% year over year, it’s currently now up 3.5% year over year.
This will be one of the very few factors that’s not an inflationary force. It’s more of a neutral force on inflation, but worth watching.
Labor Productivity
Labor productivity or output per hour, had its first year over year decline in at least the past five years. The decline was 0.55%, small but still a decline.
Productivity growth is a deflationary force, so when productivity declines, then it becomes an inflationary force.
Productivity will play a critical role for inflation in 2022. When we add up all the factors such as supply chain issues, particularly in the auto sector, but pretty much everywhere, labor shortages, lots of absence of workers due to Covid measures like what we saw with all the airline flight cancellations recently, these all have an impact in the aggregate cost of providing a good or service at the end of the day.
Conclusion
There’s a reason to suggest that we could very well see slower aggregate credit growth per capita in 2022. This will limit increases in wages and prices too as there will be less growth in new money in 2022 if this pans out.
At the same time, the dollar is still relatively strong and will probably play a more neutral role in inflation in 2022, but is worth watching.
The greatest issue for inflation in 2022 is fixing the overall economy: getting workers back to work, fixing supply chain issues, finding the right balance for Covid measures and seeing commodity prices peak and begin to come down.
If these issues can be fixed, then we could see inflation come back down to the 2%-3% range by this coming Summer or Fall. That’s a big if though.
Something as simple as the recent surge in testing for Covid is an added input cost. The cost of both time and money to go get the test and for the test to be administered and cataloged. Then there is the cost of being out sick and having to quarantine or isolate if one is sick or just tests positive. These too are factors in the cost of doing business and should be treated as added input costs that reduce productivity.
If by as soon as this coming Spring or Summer, these testing efforts will no longer be required, then that in itself will prove to be a big help toward productivity and a reduction in input costs.
Until then, inflation is going to remain elevated for the time being in the 5%-7% range.
The slowdown in aggregate debt growth per capita could be the greatest deflationary force coming our way. That’s the human action force with the Fed raising rates and doing other measures.
Be the first to comment