

Prostock-Studio/iStock via Getty Images
Economists for Goldman Sachs (GS) give the odds of the US slipping into a recession next year at 30%. This is up from their earlier estimate of a 15% chance of a recession dawning in 2023. Bank of America (BAC) securities economists aren’t so sanguine. They think the economy has a 40% chance of falling into a recession next year.
Two weeks ago, the CEO of Morgan Stanley (MS), James Gorman, rated the chance of a recession in 2023 as equal to a coin-flip. While Gorman’s 50-50 odds of a downturn may seem more pessimistic, he opined that, “we’re unlikely at this stage to go into a deep or long recession.” So Gorman is fairly optimistic over the long haul.
Not so, Jamie Dimon. Back in June, Dimon proclaimed we are in for something akin to an economic tsunami: “You know, I said there’s storm clouds but I’m going to change it … it’s a hurricane.”
So what exactly is a recession, what is the effect of a recession on the markets, and how can investors turn a recession to their advantage, or at least ameliorate the effect of an economic downturn on their portfolios?
Characteristics Of Recessions And Their Effects On Markets
A recession is generally defined as two consecutive quarters of declining GDP.
I’ll begin my overview of recessions in the US, beginning with the recession of 1949. Since that year, the US endured recessions that began in 1953, 1957, 1960, 1969, 1973, 1980, 1981, 1990, 2001, 2007, and 2020.
With the exception of the recessions that occurred in 1973-1975, 1981-1982, and 2007-2009, each downturn lasted less than a year.
There are a number of factors that contribute, and that are often common to, economic downturns. The recessions of 1949, 1953, 1958, 1960-61, 1969-70, 1981-1982, and 1990-91 were associated with periods of monetary tightening which generally included interest rate hikes.
The recession of 1973-75 is associated with the OPEC oil embargo. The 1979 energy crisis, which was caused by a regime change associated with the Iranian Revolution, contributed to the 1981-82 recession, and the 1990 oil price shock, resulting from the Iraqi invasion of Kuwait, led to the recession of 1990-1991.
So in reviewing the recessions occurring in the last seventy-plus years, we find monetary tightening/increases in interest rates by the Fed, and oil supply shocks as factors associated with economic downturns.
It is common knowledge among investors that the Fed has increased interest rates of late, and is also moving to reduce its balance sheet (quantitative tightening), another form of monetary tightening. Of course, gas prices coupled with the impact of inflation are having an adverse effect on consumers.
In other words, conditions that led to past recessions are present today.
economicshelp.org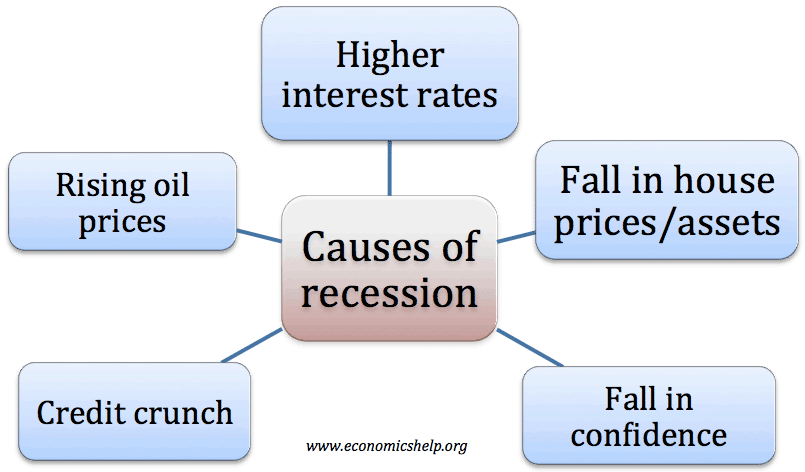
Add to that another precursor of recessions, the yield curve. The spread between the yield on the 10-year Treasury note and the two-year Treasury note, commonly referred to as the yield curve, has been closely followed as a harbinger of recessions. Every US recession since 1970 was preceded by a 10-and-2 inverted yield curve. Now consider that the yield curve inverted earlier this month.
While eyeing the 10-and-2 yield curve is of value, it is not without certain shortcomings. For one, on six occasions since 1900, recessions did not follow an inverted yield curve. However, considering there have been 28 inversions in that time frame and 22 recessions, an inverted yield curve has a high degree of accuracy for predicting recessions.
The chart that follows gives an example of market returns following yield curve inversions.
Money & Markets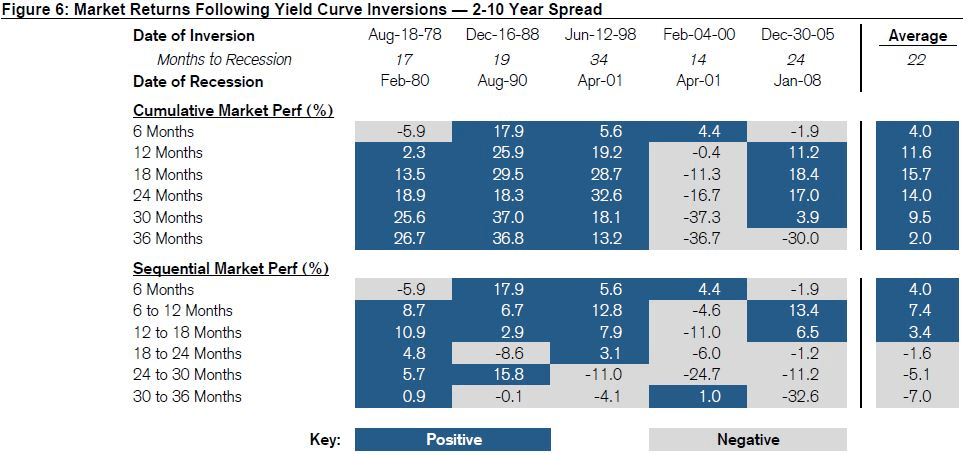
According to research conducted by Credit Suisse, there is an average lag of 22 months from the time we witness an inversion of the yield curve and the onset of a recession.
So to sum up, we have monetary tightening by the Fed, rising oil prices, and an inverted 10-and-2 yield curve, all common denominators associated with recessions. Although we are not officially in a recession, it is reasonable to assume a recession is likely.
How Should We Invest During A Recession?
In assessing investment targets during a recession, a primary consideration is that the company sells products the average consumer requires. One should look for a business that provides needs rather than wants. For example, folks have to eat, and many people require medications to survive or thrive.
Consumer staples, healthcare, food processing, and certain types of retail stocks have often performed well during recessions.
McKesson Corporation (MCK)
McKesson is a healthcare heavyweight. The company is a distributor of wholesale pharmaceutical products. With over $180 billion in annual U.S. drug distribution sales, McKesson holds sway over nearly one-third of the market. It possesses an attribute that I seek in my investments: it is a member of an oligopoly, along with Cardinal Health (CAH) and AmerisourceBergen (ABC).
Litigation related to opioids hung over the stock, but a recent settlement (to the tune of $26 billion) now has left those headwinds largely in the rearview mirror.
McKesson has a solid financial foundation, and with a low payout ratio, the dividend is secure.
The stock’s forward P/E and 5-year PEG ratio are both a bit above the company’s historical averages, so I don’t see it as a buy at this juncture. However, it should be near the top of any watchlist for stocks that are likely to perform well in a recession.
Abbott Laboratories (ABT)
Abbot is another leading healthcare company. Abbott has strong positions in the markets for surgical heart valves, coronary stents, cardiac rhythm management devices, venous closure devices, and continuous glucose monitors. Sales of these sorts of medical devices should not be adversely affected by a recession.
Abbot has a reasonable debt level, and its dividend, with a yield of about 1.7%, is well funded and growing at a double-digit pace.
I consider the shares to be trading at the lower end of fair value. While the forward P/E ratio is much lower than the company’s historic average P/E ratio, the 5-year PEG ratio is 3.43X, well above the stock’s historic PEG.
During the 2020 and 2008 bear markets, ABT shares outperformed the S&P 500 by double digits.
Lowe’s (LOW) and Home Depot (HD)
I’ve repeatedly pounded the table for Lowe’s and Home Depot. The word oligopoly comes to mind again, but these two are very close to operating as a duopoly. While it is reasonable to assume home improvement projects come to a standstill during a recession, the actual stats are counterintuitive.
According to a study by the U.S. Bureau of Labor Statistics, housing expenditures increased by 1.1% in 2007 and 2008. Remember that those years during the Great Recession were an economic downturn precipitated by a housing crisis. Throughout the Great Recession, Lowe’s worst year-over-year drop in sales was a mere 5%.
The following chart reflects data from the Harvard Joint Center for Housing Studies regarding home improvement expenditures over a time frame that includes two of the last three recessions.
Harvard Joint Center for Housing Studies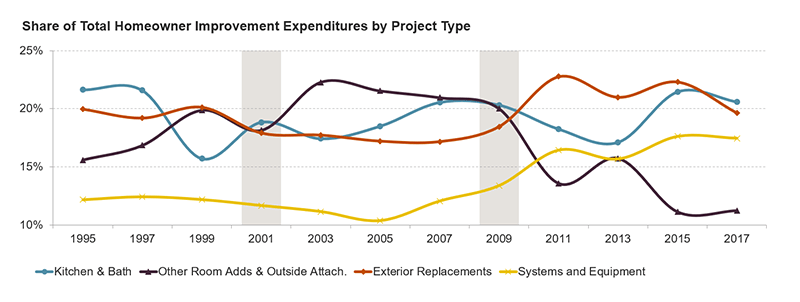
Proof that Home Depot and Lowe’s should be considered during an economic downturn lie in the stocks’ performance over the 2008 and 2020 recessions.
In 2020, HD outperformed the S&P 500 by 8.2%. In 2008, the shares beat the S&P by over 27%.
Investors in Lowe’s fared even better. In 2020, LOW outperformed by 20.1%. In 2008, the shares beat the S&P 500 by over 35%.
Another big positive for both companies is that each boasts a yield well over 2%, the dividends are well funded, and each has 5-year dividend growth rates of over 17%.
Home Depot has a forward P/E that is nearly 5 points below its average P/E over the last five years; however, the stock’s 5-year PEG ratio is 2.69x. While I generally eschew investments in companies with PEGs above 2.00, I consider HD to be of exceptional quality in terms of an investment. Consequently, I’m willing to nibble at the shares.
Like HD, Lowe’s shares are trading at a forward P/E that is about five points below the stock’s average P/E ratio over the last five years; however, Lowe’s PEG ratio stands at 0.69X, well below the company’s average PEG ratio of 1.09X.
I consider LOW to be a solid buy, and I added a number of shares to my position last week.
Walmart (WMT)
Walmart Inc. is another stock that has performed well during prior recessions. Management has invested heavily of late in ecommerce, advertising and financial services.
WMT is a no-brainer during a recession in the sense that the retailer is known for its low prices, and over half of the company’s revenues come from grocery sales. During the Great Recession year of 2008, the shares outperformed the S&P 500 by nearly 60%.
The stock crashed following the last quarterly report, largely due to the effect inflation is having on consumers’ shopping habits. During the earnings call, management outlined three primary causes for Walmart’s poor results, giving each an equal weight in terms of their ill effects.
The first was increased wage expenses, which CEO McMillon states have been resolved.
The second contributing factor was increasing fuel costs. McMillon anticipates continued pressure related to fuel costs into Q2, albeit with an improvement over Q1.
The third issue was related to general merchandise sales. Due to inflated food costs, consumers spent more on groceries and less on general merchandise. As margins on groceries are notoriously low, gross margins suffered significantly. The change in customer behavior also resulted in Walmart being saddled with excess inventory.
WMT should recover from these headwinds, and the drop in share price may represent an investment opportunity. The stock’s forward P/E is currently about 3 points below its 5-year average, and the 5-year PEG ratio of 2.63X is a full point below Walmart’s average PEG ratio over the last five years.
Kroger (KR)
If you are seeking a company with products that we cannot live without, look no further than The Kroger Co. This is where the mantra, “folks gotta eat” rings true.
Aside from being a recent addition to Buffett’s investment portfolio, Kroger is adapting to meet the times. It might surprise you that KR ranks among the top ten US ecommerce companies.
I will posit that the pressures consumers face due to inflation may serve Kroger well over the long term. While perusing Walmart’s and Target’s most recent quarterly reports, I noted the management of both companies stated inflation was driving customers to adopt private label brands.
Kroger launched 660 new private label products in FY22 alone, and the company has four private labels with annual sales of $1 billion or more. The grocer also operates 35 food production or manufacturing facilities dedicated to producing private label products.
The average Kroger store stocks over 14,000 private label items, and those products generated nearly $28 billion in sales in 2021. KR’s private label products are 25% to 30% more profitable and serve to bolster the company’s bottom line while providing a competitive advantage over rivals.
Once Kroger customers opt for the company’s private labels, there may be a reluctance to return to national brands.
eMarketer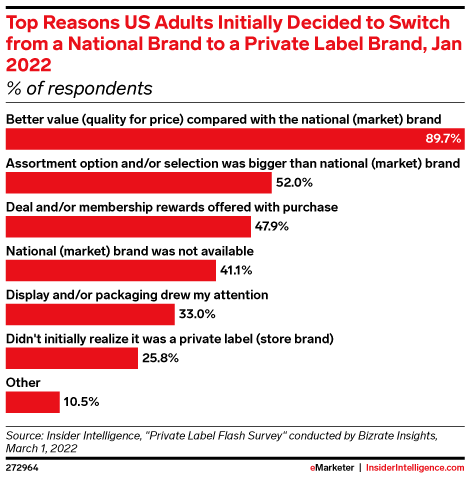
Kroger has a forward P/E about one point above the company’s average P/E over the last five years. The 5-year PEG ratio of 1.02X, a figure that is roughly half that of the stock’s average PEG ratio over the last five years, shows KR is trading at a reasonable price.
Costco (COST)
Last on my list is Costco. Costco is a model of efficiency. In 2021, Costco reported over $1,600 in sales per square foot. By contrast, Sam’s Club’s notched $920 sales per square foot, and Walmart averaged $560 in sales per square foot.
A cash conversion cycle is a term noting the number of days a company needs to convert cash invested in goods into sales. The shorter the period between the purchase of goods and the time it takes to sell products (the cash conversion cycle) means a company’s funds are not tied up in inventory.
Costco’s cash conversion cycle is currently negative, an astounding metric. By comparison, BJ’s Wholesale’s (BJ) cash conversion cycle is over eight days.
The firm’s cash conversion rate is fueled by the fact that the bulk of Costco’s profits stem from membership fees. Even though membership fees comprise just 2% of total sales, they constitute 77% of the company’s bottom line.
Considering over 90% of Costco’s members renew their memberships, along with the fact that the retailer provides the sort of low prices consumers need in the event of an economic downturn, I see this stock as an obvious choice during a recession.
Unlike Target and Walmart, Costco posted solid results for its most recent quarter. I think this speaks volumes regarding the stock’s ability to weather a recession. Year-to-date, COST shares are outperforming the S&P 500 by nearly 4%.
Unfortunately, the stocks forward P/E and 5-year PEG ratios are both higher than the 5-year average for both metrics, so I don’t rate COST as a buy at this juncture.
Houston, We Have A Problem
As of the middle of this month, we officially entered into a bear market. As investors, we must weigh every facet of a potential investment. Since 1929, the average bear market has resulted in a 35% decline.
I will ignore the most recent bear market, as I view it as an anomaly. The following lists the duration and depth of the bear markets over roughly the last half century.
-
2007-2009: down 57% length 1.4 years
-
2000-2002: down 49.1% length 2.5 years
-
1987: down 33.5% length 101 days
-
1980- 1982: down 27.1% length 1.7 years
-
1973-1974: down 48% length 1.7 years
-
1968-1970: down 36.1% length 1.5 year
My Summation
In a sense, I saved the worst for last. Of the last six bear markets, five were accompanied by recessions. The sole exception was the bear market of 1987. Looking at the list of bear markets I provided, one should note the outlier, the 1987 downturn, resulted in a relatively rapid recovery for stocks.
It is of value to note that there were four occasions, the summers of 1990, 1998, and 2011, and autumn of 2018, when the market dropped by at least 18% but less than 20%. Only one of those came with a recession.
There is nothing magic about the market dropping 20%, so perhaps this market is on the rebound. However, famous last words, so to speak, are “it’s different this time.”
Count me as one that believes a recession is on the horizon, and that this bear market will go lower for longer. If you believe the market is destined to continue to drop, investing at this juncture, at least in most tickers, is to be avoided.
However, despite my gloomy prognosis, I am not a market timer. My strategy for investing in markets of this nature is to continue to invest, albeit with markedly smaller sums.
I provided a brief overview of each of the listed stocks along with an assessment of their valuations.
Although I believe the companies I listed are likely to perform better in a recession, the only stock that I consider a buy at this time is Lowe’s.
Be the first to comment