

Dow Jones, DAX 40, CAC 40, Trader Positioning – Talking Points
- Short exposure in global equities has been increasing
- Sentiment outlook: Dow Jones, DAX 30 and CAC 40
- Technical analysis shows continuation patterns afoot
What Does Trader Positioning Say About Global Stock Market Trends?
In this week’s session, I discussed how net-short positioning in global equities is approaching levels last seen prior to the aggressive selloff in stocks as the coronavirus spread. Indexes covered include the Dow Jones, DAX 30 and CAC 30. The shift back towards traders aggressively selling into recent price gains can have important implications for future trends. What is the road ahead based on signals from IG Client Sentiment (IGCS)?
Starts in:
Live now:
Apr 15
( 00:04 GMT )
Recommended by Daniel Dubrovsky
What Do Other Traders Buy/Sell Bets Say About Price Trends?
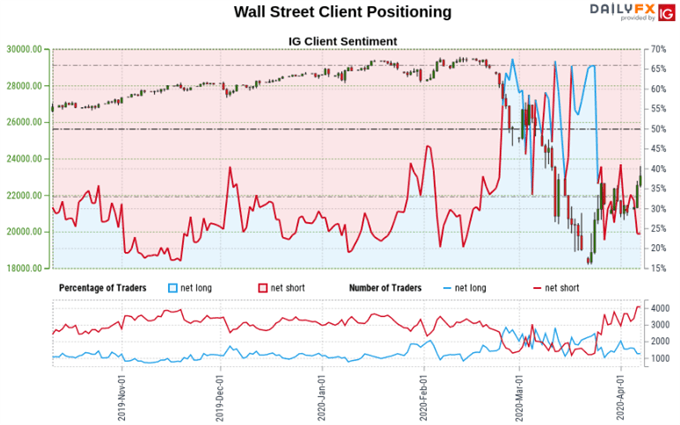
Dow Jones Sentiment Outlook
According to IGCS, about 31.10% of Dow Jones traders are net long at the time of writing. This is down from about a 65% upside bias when prices found a bottom in late March. Since then, the index advanced over 23 percent as traders increasingly started betting on its next turn lower. From here, recent changes in sentiment warn that the currentprice trend may soon reverse lower even thoughtraders remain netshort.
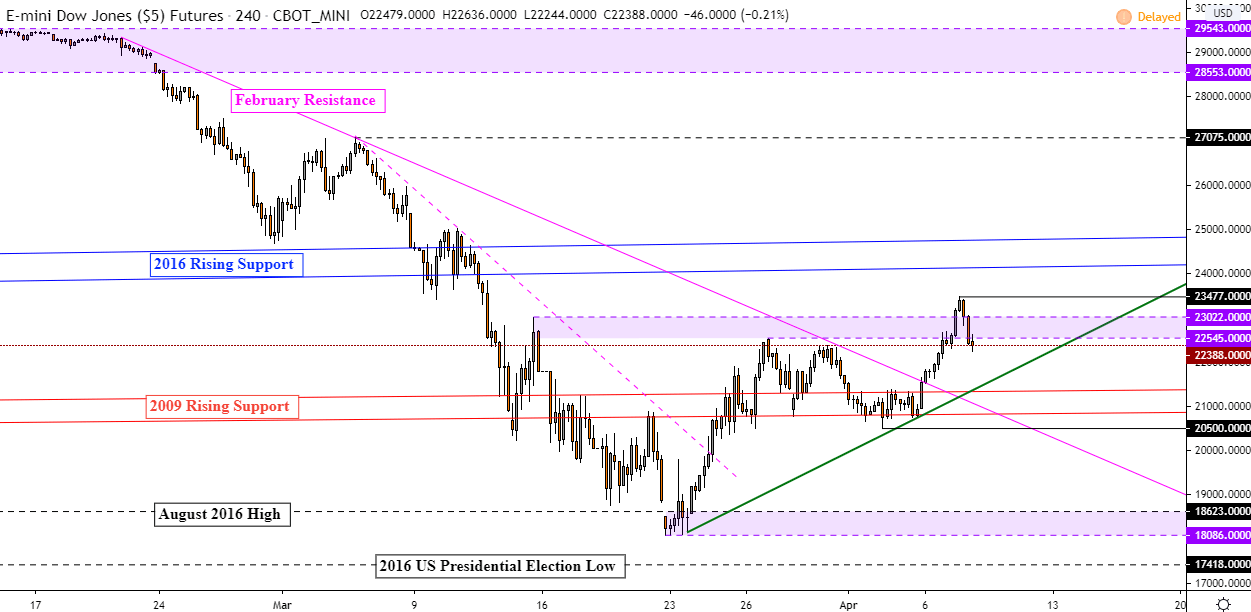
Dow Jones Technical Analysis
A turn lower in the Dow Jones places the focus on rising support from last month’s bottom – green line on the 4-hour chart below. If taken out, that could shift the technical bias to the downside as prices may face 20500. Uptrend resumption entails a push through 23477 after prices appeared to experience a false breakout through resistance at 23022. The push above the falling trend line from February maintains the upward technical view.

Recommended by Daniel Dubrovsky
Improve your trading with IG Client Sentiment Data
Dow Jones Futures 4-Hour Chart
Dow Jones Futures Chart Created in Trading View
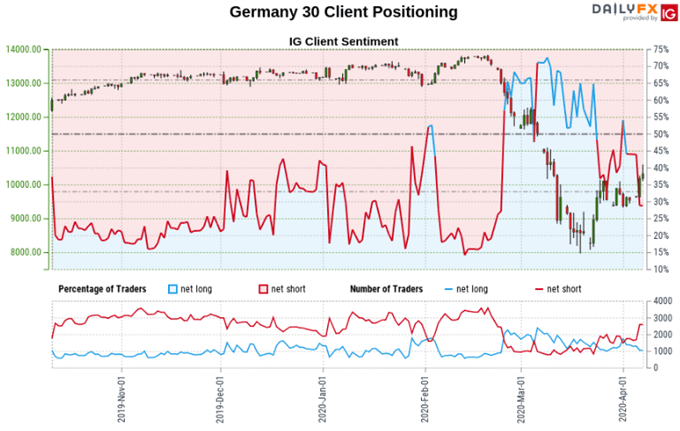
DAX 30 Sentiment Outlook
IGCS shows about 35.21% of traders in the DAX 30 are net long at the time of publishing. This continues to dwindle from a roughly 65% upside bias when the index found a bottom in late March. Since then, prices have climbed over 24%. The combination of current sentiment and recent changes gives a further mixed trading bias. Those net short are down over a daily basis while bets to the upside are higher over a weekly period.
DAX 30 Technical Analysis
From a technical perspective, the DAX 30 appears to have experienced a false upside breakout through an Ascending Triangle continuation pattern. A drop back into the congestive range of the triangle could spell further consolidation to come. Still, the push above falling resistance from February offers a cautiously upside tilt. Rising support from late March may maintain the bounce in the event prices fall ahead.
DAX 30 Futures 4-Hour Chart

DAX 30 Futures Chart Created in Trading View
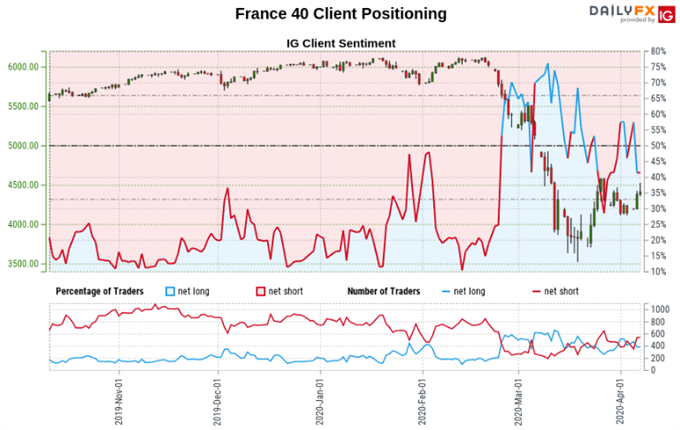
CAC 40 Sentiment Outlook
About 40.40% of CAC 40 traders are net long according to IGCS. This has been dwindling slowly from a near 75% upside bias seen last month. As prices appeared to find a bottom in late March, traders rekindled downside exposure. From here the combination of current sentiment and recent changes gives us a stronger CAC 40-bullish contrarian trading bias. That may speak to a rising share of investors attempting to pick the next top.
CAC 40 Technical Analysis
On the 4-hour chart below, the CAC 40 continues to trade within an Ascending Triangle chart pattern. The floor of the triangle is rising support from last month’s bottom with the ceiling holding at 4552. The direction of the breakout may precede the next dominant move. A rise may see the CAC 40 target former rising support from 2011. Otherwise a turn lower exposes 4110 followed by 3624.
CAC 40 Futures 4-Hour Chart
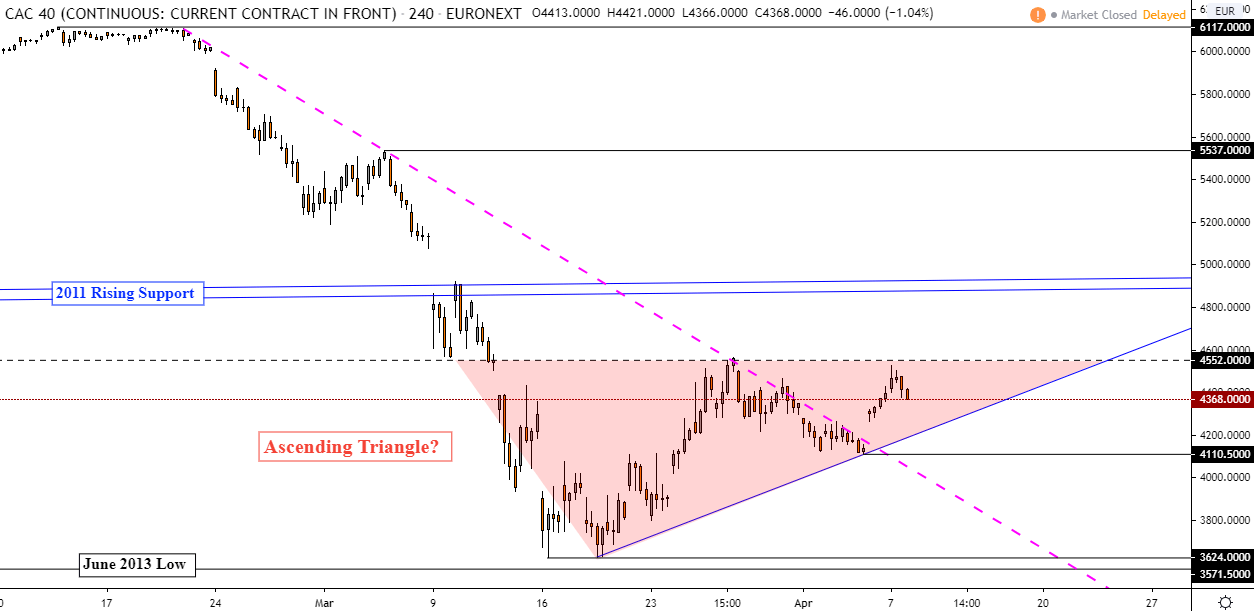
CAC 40 Futures Chart Created in Trading View
*IG Client Sentiment Charts and Positioning Data Used from April 7 Report
— Written by Daniel Dubrovsky, Currency Analyst for DailyFX.com
To contact Daniel, use the comments section below or @ddubrovskyFX on Twitter
Be the first to comment