

martince2
COVID hit Hotel REITs extra hard, but this year has seen a great deal of leisure travel within the U.S. Data from the Transportation Safety Administration shows that travel passengers, as a percentage of 2019 levels, reached essentially 100% in July of this year, after diving to near zero in April 2020.
Hoya Capital Income Builder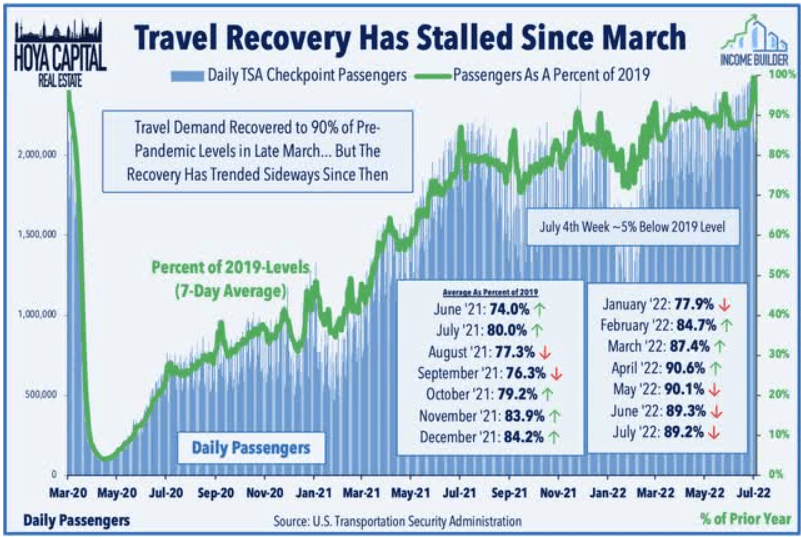
According to Hoya Capital’s research, hotel occupancy is back to 96% of the 2019 rate, while ADR (average daily room rate) is up 11% and RevPAR (revenue per available room) is up 7%. However, when inflation is taken into account, ADR is down about 2.5% and RevPAR is down about 6.2% since 2019. All three metrics (Occupancy, ADR, and RevPAR) are expected to be fully recovered to pre-pandemic levels in real terms by 2024.
Hoya Capital Income Builder
As a result, Hotel REITs are the fourth-best performing REIT sector of 2022, with an average total return of (-6.71)%, compared to the Equity REIT Index mark of (-18.52)%.
Hoya Capital Income Builder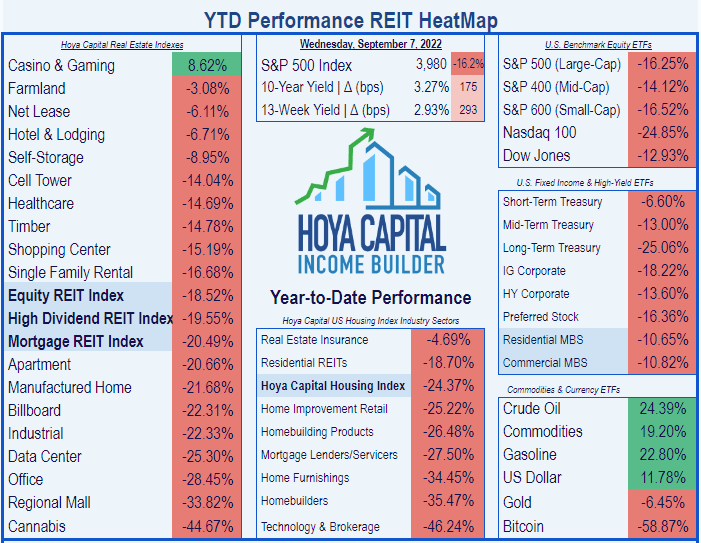
The forecast for earnings growth is outstanding, all across the Hotel REIT sector.
So the question is, if you are interested in starting or increasing a position in a hotel REIT, which company? This article zeroes in on the one Hotel REIT best positioned to reward investors over the next 12 months.
First Criterion: Balance Sheet
There are 15 U.S. Hotel REITs. Since a solid balance sheet is the necessary foundation of any strong investment, let’s look at how these 15 companies are positioned for liquidity and debt, in order by market cap.
| Hotel REIT | Liquidity | Debt Ratio | Debt/EBITDA | Bond |
| Host Hotels & Resorts (HST) | 2.29 | 32% | 3.4 | BB+ |
| Ryman Hospitality (RHP) | 1.00 | 38% | 6.9 | B |
| Apple Hospitality (APLE) | 3.07 | 30% | 4.0 | — |
| Park Hotels (PK) | 1.81 | 57% | 10.6 | B |
| Pebblebrook Hotel (PEB) | 1.95 | 43% | 15.0 | — |
| Sunstone Hotel Investors (SHO) | 3.14 | 19% | 2.5 | — |
| RLJ Lodging (RLJ) | 1.95 | 56% | 7.5 | B+ |
| DiamondRock Hospitality (DRH) | 2.00 | 36% | 8.0 | — |
| Xenia Hotels (XHR) | 1.90 | 49% | 7.0 | B |
| Service Properties Trust (SVC) | 1.21 | 93% | 14.9 | B+ |
| Summit Hotel (INN) | 1.45 | 44% | 8.0 | — |
| Chatham Lodging (CLDT) | 2.41 | 46% | 9.0 | — |
| Hersha Hospitality (HT) | 1.44 | 62% | 9.0 | — |
| Braemar Hotels (BHR) | 1.43 | 89% | 11.5 | — |
| Ashford Hospitality (AHT) | 0.98 | 102% | 15.5 | — |
| Sotherly Hotels (SOHO) | 1.13 | 73% | 18.7 | — |
| InnSuites Hospitality (IHT) | 1.60 | 29% | — | — |
| Hotel REIT average | 1.81 | 41% | 9.5 | — |
| Overall REIT average | 1.90 | 25% | 6.4 | — |
Source: Hoya Capital Income Builder and TD Ameritrade
In the table above, values shaded in green are better than both the Hotel REIT average and the overall REIT average. Values shaded in yellow lie between the Hotel REIT average and the overall REIT average. Values shaded in red are below both averages.
As you can see from the bottom two rows, the Hotel REIT sector is in worse shape than the REIT sector overall, with liquidity lower and debt considerably higher.
There are a lot of distressed balance sheets in this sector. Since we are looking for the best Hotel REIT to invest in, we can safely eliminate every company whose Liquidity Ratio, Debt Ratio, or Debt/EBITDA is worse than the Hotel REIT average. That includes every company with any red in its row of values. This eliminates all but four candidates: HST, APLE, SHO, and DRH.
This is not to say that none of the other Hotel REITs could make you some money as an investor. For example, Sotherly Hotels (SOHO) was recently designated by Zacks as a Strong Buy. It’s just that with balance sheets that weak, they are too big a risk for my taste.
Second Criterion: Funds From Operations
Healthy companies do a good job of steadily increasing revenues, which are best measured in the REIT world by FFO (Funds From Operations) per share. Let’s see how our 4 candidates are doing in that regard.
| Ticker | 3-year FFO Growth | 5-year FFO Growth | * 2022 FFO Growth | * 2023 FFO Growth |
| HST | ( -2.1)% | ( -0.3)% | 174% | 7.2% |
| APLE | ( -3.2)% | ( -3.1)% | 58% | 13.6% |
| SHO | (-11.3)% | ( -8.0)% | 1750% | 33.8% |
| DRH | ( -6.1)% | ( -2.5)% | 633% | 17.0% |
| Hotel REIT average | ( -6.4)% | (-15.0)% | 888% | 29.9% |
Source: Hoya Capital Income Builder
*Projected
The trailing 3-year and 5-year FFO growth numbers show that all four of our candidates are outperforming the Hotel REIT average, which still hasn’t recovered to its pre-pandemic levels. But all four significantly lag the overall REIT averages of 9.1% and 7.8%, respectively. The exception is SHO, which is outperforming Hotels on 5-year growth, but underperforming on 3-year growth. Thus, Sunstone has been a little slower to recover from COVID than the other three candidates.
The projected growth figures for 2022 are gaudy. That is mostly because most Hotel REITs just returned to positive FFO last year, so the comparables are extremely easy. Thus, the projected 2022 Hotel REIT average FFO of $1.58 per share looks great, compared to 2021’s average of just $0.16. (Wow! that’s an 887.5% increase! See what I mean?)
SHO looks great in this year’s projected FFO growth column, precisely because it was the slowest of the four candidates to return to positive FFO. By the same token, APLE’s projected growth of 58% looks anemic alongside the others’ triple-digit rates, but that is because APLE emerged sooner and stronger than the others, so its comparables are more challenging.
The most meaningful and eye-opening figure in this table is the Hotel REIT sector’s projected average FFO growth per share for 2023: a whopping 29.9%. Of our four candidates, only SHO outpaces the pack on that metric. The others lag the projected average, precisely because they have emerged sooner and stronger than the others.
All four of our candidates are projected to grow at healthy rates.
Dividend metrics
This is where we start to see some separation. Listing our four candidates again in order by market cap, a clear favorite emerges.
| Company | Div. Yield | 3-yr Div. Growth | Div. Score | Payout | Div. Safety |
| HST | 2.72% | (-18.9)% | 1.45 | 30% | A |
| APLE | 5.29% | (-11.2)% | 3.70 | 50% | A+ |
| SHO | 0.00% | (-33.0)% | 0.00 | 10% | — |
| DRH | 0.00% | (-33.0)% | 0.00 | 10% | — |
| Hotel REIT avg | 1.71% | (-26.3)% | 0.68 | 17% | A |
| REITs overall | 3.38% | 6.2% | 4.05 | 59% | C |
Source: Hoya Capital Income Builder, TD Ameritrade, Seeking Alpha Premium
Dividend Score projects the Yield three years from now, on shares bought today, assuming the Dividend Growth rate remains unchanged.
As you can see, APLE far outshines the other candidates in current Yield, and in fact, APLE is paying well above the REIT average, at 5.29%. Every company in the Hotel sector eliminated its dividend during the COVID sell-off. APLE was the first to restore its dividend. So when dividend growth rate is taken into account in the Dividend Score, APLE emerges just a little below the REIT average, at 3.70, but far ahead of second-place HST at 1.45.
Valuation metrics
Let’s list our candidates in order by dividend score now, and look at valuation.
| Company | Div. Score | Price/FFO ’22 | Premium to NAV |
| APLE | 3.70 | 10.4 | (-16.5)% |
| HST | 1.45 | 9.9 | (-23.3)% |
| SHO | 0.00 | 13.9 | (-14.6)% |
| DRH | 0.00 | 9.1 | (-19.0)% |
| Hotel REIT average | 0.68 | 10.2 | (-22.4)% |
| Overall REIT average | 4.05 | 19.5 | (-5.0)% |
Source: Hoya Capital Income Builder, TD Ameritrade, and author calculations
The average Hotel REIT nowadays is “bargain” priced at 10.2 times FFO for 2022, barely over half the Price/FFO ’22 of the average REIT. Our four candidates are clustered near the Hotel REIT average, with SHO on the high side at 13.9x, and DRH on the low end at 9.1. The difference is enough to drop SHO to fourth place, but doesn’t warrant any change in the first and second choices. Only Host Hotels (HST) trades at a discount greater than the Hotel REIT average, and just barely.
Market cap “Sweet Spot”
Research by Hoya Capital indicates that the size of a REIT exerts a real influence on its total return. The optimum size is “upper mid-cap,” from $4 – $10 billion. This is the Sweet Spot. Next best is large cap, then “lower mid-cap,” from $1.4 – $4 billion. Small cap REITs bring up the rear.
Here is how our four candidates stack up on this key factor.
| Company | Market Cap |
| Host Hotels & Resorts (HST) | $12.6 B |
| Apple Hospitality (APLE) | $3.6 B |
| Sunstone Hotel Investors (SHO) | $2.4 B |
| DiamondRock Hospitality (DRH) | $1.9 B |
Source: TD Ameritrade
Of the four, APLE is the closest to the Sweet Spot, at $3.6 billion. The next most favorable spot is held by HST, at $12.6 billion.
Discussion
This is kind of a no-brainer. Because nearly all Hotel REITs pay very low dividends, investing in any of them except APLE is a value play. Investors are not quite as yield-crazy as they were earlier in the year, and the real cost of money has come down some. So the environment for growth investing is better than it was in January, but it still is more of a value investor’s environment. From a growth standpoint, it is difficult to identify a leader in the pack. However, from a value standpoint, there is no contest, because one company boasts a vastly superior dividend.
And the winner is . . .
The Hotel REIT that emerged first and strongest from the pandemic, with a strong runway of FFO growth, the first to restore its dividend, and the only one that pays an above-REIT-average Yield:
Apple Hospitality REIT
Be the first to comment