

Robert Way
By The Valuentum Team
One of our favorite industrial ideas is Honeywell International Inc (NASDAQ:NASDAQ:HON). The company is well-positioned to capitalize on the ongoing recovery in the aerospace industry as Honeywell is a supplier of engines, avionics, auxiliary power units, and other aerospace products along with related aerospace services.
Additionally, Honeywell provides warehouse automation solutions, which should benefit from the proliferation of e-commerce activities, and smart building technologies, which should benefit from a general desire to boost the energy efficiency of buildings in the wake of elevated energy prices.
At the high end of our fair value estimate range, which will be cover in great detail in this article, we assign Honeywell a fair value estimate of $235 per share. That’s well above where shares of HON are trading at as of this writing, and as such, we view the industrial firm’s capital appreciation upside potential favorably.
However, the biggest source of upside from Honeywell concerns its dividend growth potential. The company has pushed through annual dividend increases over the past 10+ years and is a stellar cash flow generator with a bright growth outlook, indicating there is ample room for future payout boosts. Shares of HON yield ~2.0% as of this writing.
Honeywell’s Key Investment Considerations
Image Source: Valuentum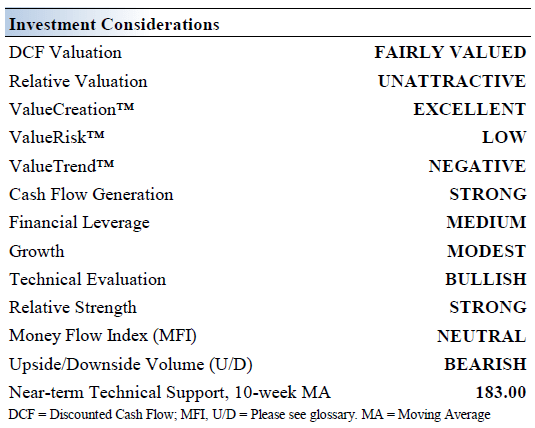
Honeywell operates in four segments: Aerospace, Building Technologies, Performance Materials and Technologies, and Safety and Productivity Solutions. Its aerospace products are used on virtually every aircraft. Honeywell is working to optimize fixed costs in its manufacturing and logistics facilities. The firm was founded in 1920 and is based in New Jersey.
The company generates rock-solid normalized margins through the economic cycle. Honeywell’s ‘Aerospace,’ ‘Honeywell Building Technologies,’ and ‘Performance Materials and Technology’ segments boast profit margins in the 20s% range. In addition to its highly-respected brand name, the company’s massive installed base and large services business offer considerable competitive advantages. Its recurring software sales have also been growing at a robust clip in recent years.
During its 2022 Investor Day event held on March 3, Honeywell increased its long-term financial targets. Now Honeywell is guiding for ~4%-7% annual organic sales growth and ~40-60 basis points of margin expansion per year over the long haul. In turn, that should drive Honeywell’s cash flows higher over the long haul, enabling the company to increase its dividend payout to investors in a sustainable manner.
Honeywell issued out favorable long-term guidance during a major investor update in March 2022. (Honeywell – March 2022 IR Presentation)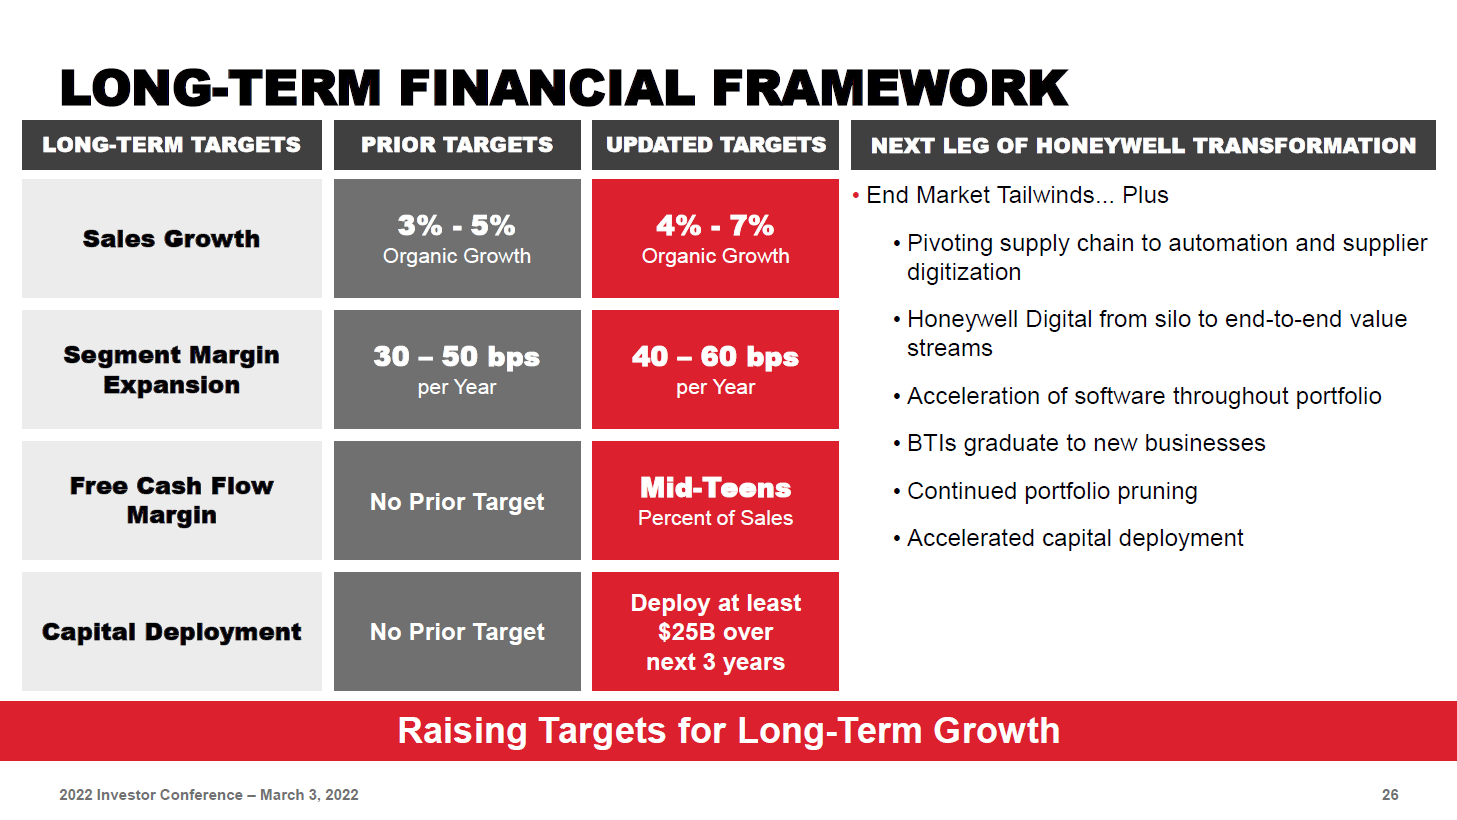
The company sees room for ample growth opportunities across its four core business operating segments. Honeywell’s improving outlook is aided by its robust order backlog and ample pricing power. Over the long haul, Honeywell expects strength across is major end markets including commercial aviation, defense, and process automation, which will be driven by flight hours growth, robust defense budgets, and warehouse building.
Earnings and Guidance Update
On July 28, Honeywell reported second quarter 2022 earnings that beat both consensus top- and bottom-line estimates. During the second quarter, Honeywell’s GAAP revenues grew by 2% year-over-year with growth at its Aerospace, Honeywell Building Technologies, and Performance Materials and Technologies segment’s offsetting weakness at its Safety and Productivity Solutions segment. The latter segment is facing headwinds from declining COVID-related mask and other safety solution sales, though the rest of Honeywell’s business is performing quite well. Its organic sales grew by 4% annually in the second quarter. Rising operating expenses and a reduction in its non-operating income saw Honeywell’s GAAP diluted EPS fall to $1.84 in the second quarter of 2022 versus $2.04 in the same quarter last year.
The company also raised its full-year organic revenue growth, its segment margin, and its non-GAAP adjusted EPS forecasts for 2022 during the earnings update. Its reported sales guidance for 2022 was marginally lowered, in large part due to Honeywell suspending its business in Russia and Belarus in March 2022, however, it maintained its free cash flow guidance for 2022 during the report. We define free cash flow as net operating cash flow less capital expenditures, though Honeywell’s definition varies slightly. We appreciate the favorable guidance boost, on a net basis, as Honeywell appears to be adeptly navigating various exogenous shocks seen of late (such as inflationary pressures, supply chain hurdles, and the Ukraine-Russia crisis).
Honeywell is now guiding for its organic sales to grow by 5%-7% (up from 4%-7% previously), its segment margin to expand by 30-70 basis points (up from 10-50 basis points previously), and its adjusted EPS to grow by 6%-9% (up from 5%-9% previously) this year. Please note that these are adjusted non-GAAP metrics meant to provide investors a snapshot of the firm’s underlying performance. Under Honeywell’s definition, it continues to expect that it will generate $4.7-$5.1 billion in free cash flow in 2022. The firm noted in its earnings press release that “we define free cash flow as cash provided by operating activities less cash expenditures for property, plant and equipment plus cash receipts from” Garrett Motion Inc (GTX), a spinoff of Honeywell as Honeywell retains an economic interest in Garrett.
Honeywell issued out a favorable guidance update, on a net basis, during its second quarter earnings update. (Honeywell – Second Quarter of 2022 IR Earnings Presentation)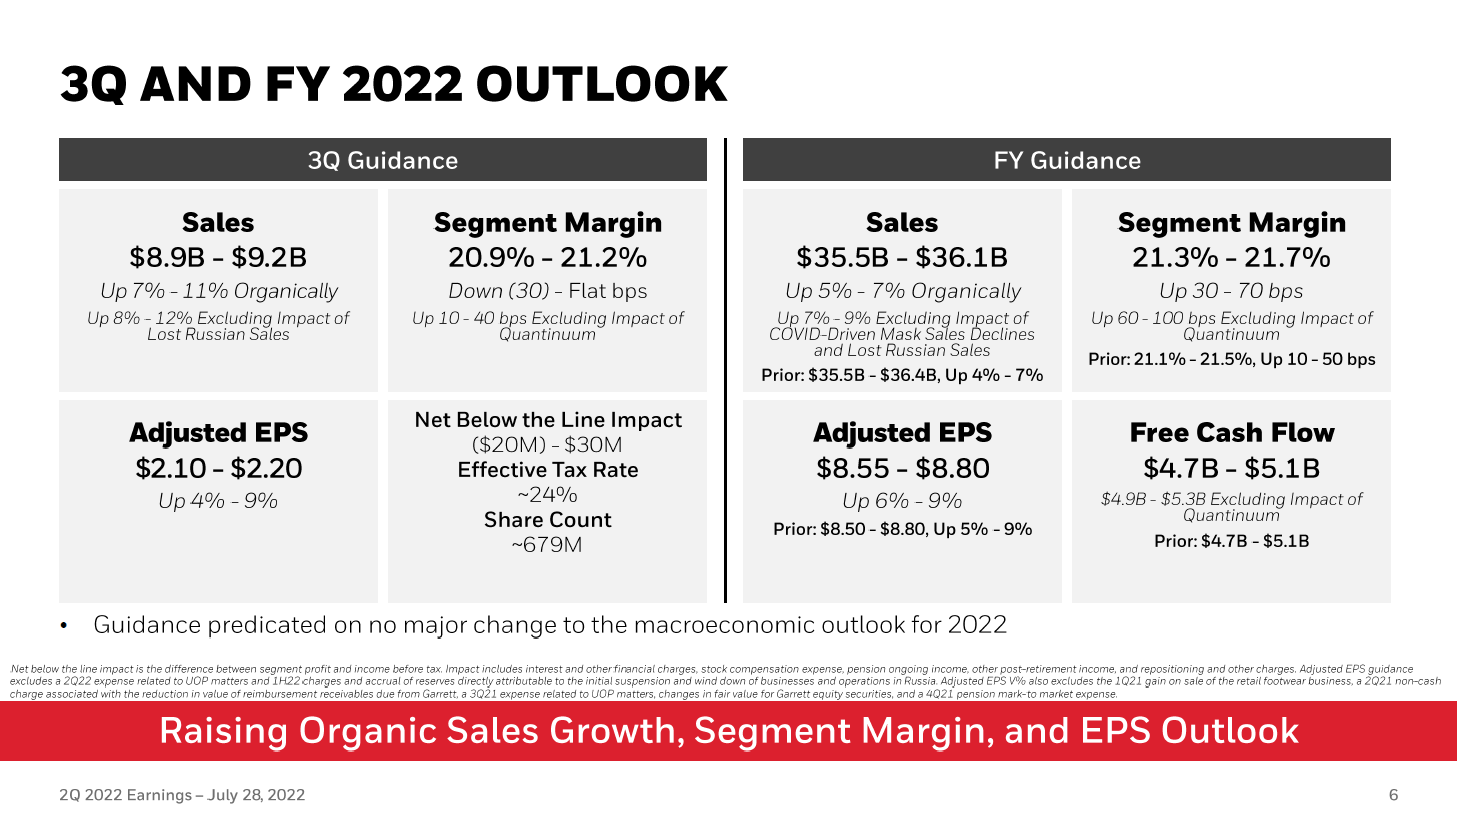
Downside Risks and Balance Sheet Considerations
Honeywell exited June 2022 with $8.7 billion in cash, cash equivalents, and short-term investments on hand versus $6.6 billion in short-term debt and $12.5 billion in long-term debt. Though we would prefer that Honeywell have a net cash position, the firm has ample liquidity on hand to meet its near term funding needs. Additionally, the firm has a nice ‘A-rated’ investment grade credit rating (A2/A/A) which should support its future refinancing activities.
We caution that the single biggest risk to Honeywell’s dividend is its large net debt load. The firm needs to maintain its “normalized” free cash flow generating abilities to manage its net debt load going forward. Honeywell exited the second quarter of 2022 with a backlog of $29.5 billion, up 12% year-over-year, which provides ample visibility as it concerns its future financial performance.
In 2021, Honeywell generated $5.1 billion in free cash flow (not including cash receipts from Garrett) and spent $2.6 billion covering its dividend obligations along with $3.4 billion buying back its stock. The company’s dividend obligations are well-covered by its free cash flows, defined again as net operating cash flow less capital expenditures. Due to a large working capital build, Honeywell generated just $0.5 billion in free cash flow during the first half of 2022, though its free cash flows should swell higher going forward.
The second thing that comes to mind with respect to Honeywell’s dividend resiliency, after its net debt load, is the threat that comes with serving cyclical end markets. Though the company is well-diversified across the industrial economy and commercial aerospace, future downturns are inevitable. Foreign exchange headwinds are another concern in light of the strong US dollar seen of late. Competing capital allocation priorities, such as share buybacks and M&A activity, could weigh negatively on the pace of Honeywell’s future dividend growth.
Honeywell’s dividend remains a priority in management’s capital deployment strategy, in our view.
Honeywell’s Economic Profit Analysis
The best measure of a firm’s ability to create value for shareholders is expressed by comparing its return on invested capital [‘ROIC’] with its weighted average cost of capital [‘WACC’]. The gap or difference between ROIC and WACC is called the firm’s economic profit spread. Honeywell’s 3-year historical return on invested capital (without goodwill) is 51.1%, which is above the estimate of its cost of capital of 8.3%.
In the chart down below, we show the probable path of ROIC in the years ahead based on the estimated volatility of key drivers behind the measure. The solid grey line reflects the most likely outcome, in our opinion, and represents the scenario that results in our fair value estimate. Honeywell has historically been a solid generator of shareholder value and we forecast that will keep being the case for years to come.
Image Source: Valuentum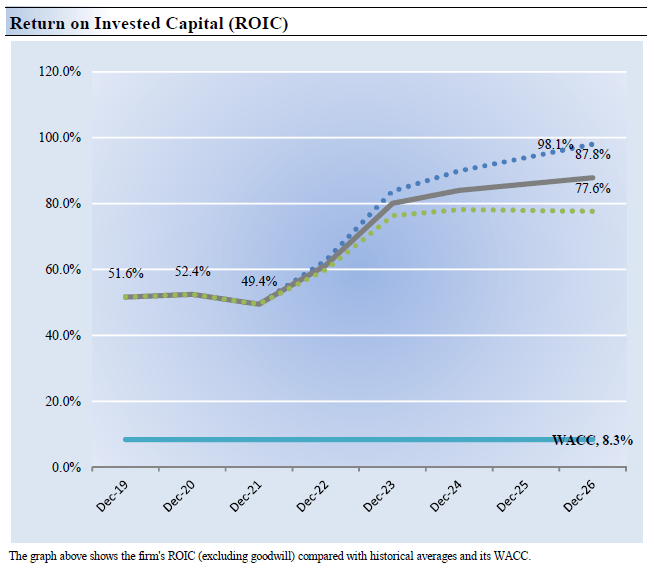
Honeywell’s Cash Flow Valuation Analysis
Image Source: Valuentum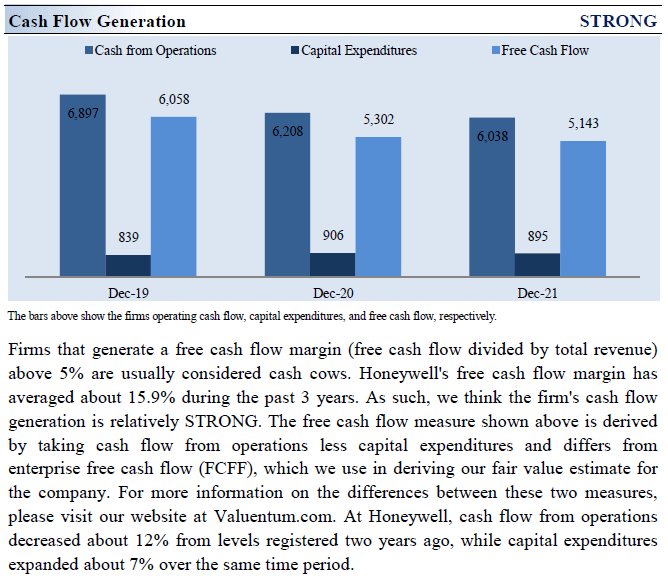
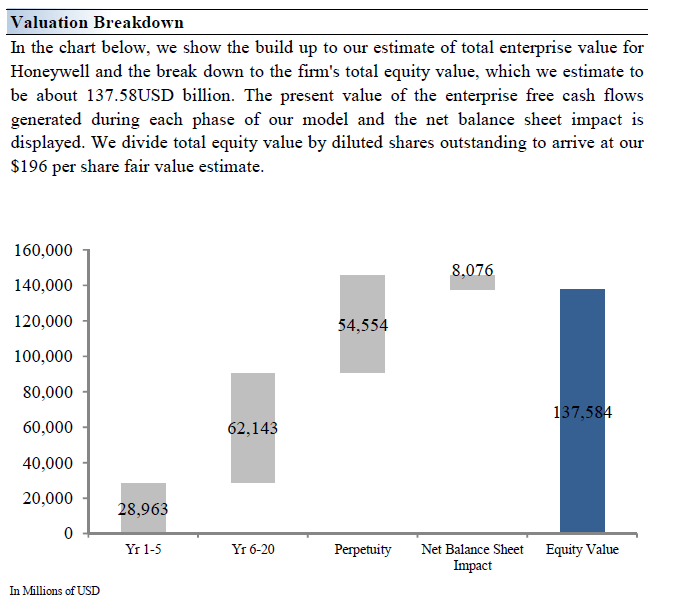
Our discounted cash flow process values each firm on the basis of the present value of all future free cash flows, net of balance sheet considerations. We think Honeywell is worth $196 per share with a fair value range of $157.00 – $235.00. Considering that Honeywell recently boosted its longer term guidance and has been firing on all-cylinders of late, we see room for shares of HON to test the upper end of that range.
The near-term operating forecasts used in our cash flow models, including revenue and earnings, do not differ much from consensus estimates or management guidance. Our model reflects a compound annual revenue growth rate of 5.2% during the next five years, a pace that is higher than the firm’s 3-year historical compound annual growth rate of -6.3%. Our model reflects a 5-year projected average operating margin of 23.2%, which is above Honeywell’s trailing 3-year average. Beyond Year 5, we assume free cash flow will grow at an annual rate of 3.2% for the next 15 years and 3% in perpetuity. For Honeywell, we use an 8.3% weighted average cost of capital to discount future free cash flows.
Image Source: Valuentum Image Source: Valuentum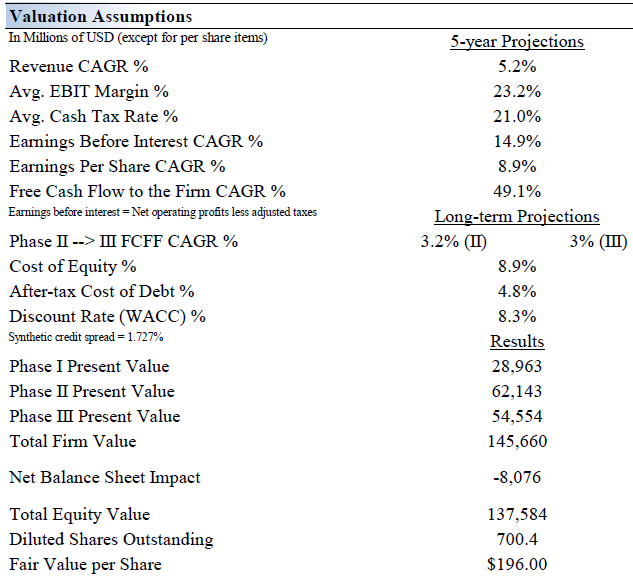
Honeywell’s Margin of Safety Analysis
Image Source: Valuentum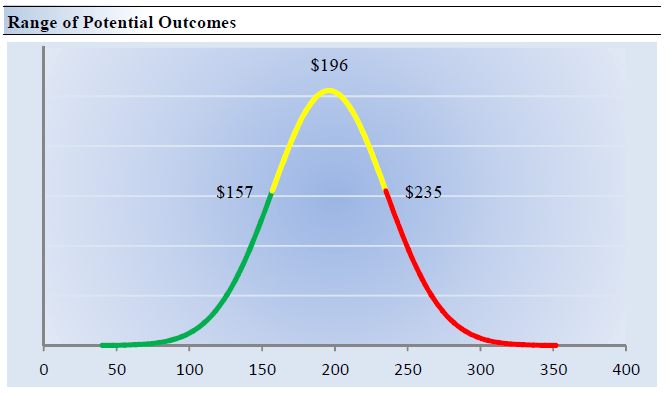
Although we estimate Honeywell’s fair value at about $196 per share, every company has a range of probable fair values that’s created by the uncertainty of key valuation drivers (like future revenue or earnings, for example). After all, if the future were known with certainty, we wouldn’t see much volatility in the markets as stocks would trade precisely at their known fair values.
In the graphic up above, we show this probable range of fair values for Honeywell. We think the firm is attractive below $157 per share (the green line), but quite expensive above $235 per share (the red line). The prices that fall along the yellow line, which includes our fair value estimate, represent a reasonable valuation for the firm, in our opinion.
Dividend Analysis
Honeywell’s forward-looking dividend coverage is quite strong, according to our forecasts. (Valuentum)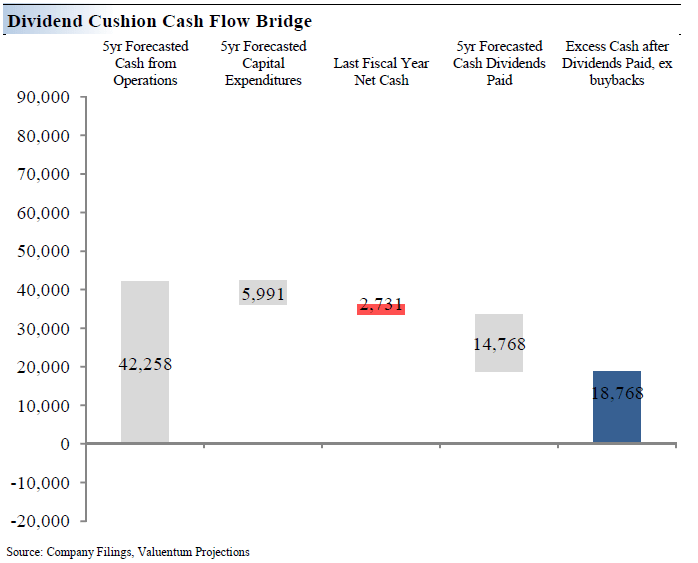
The Dividend Cushion Ratio Deconstruction, shown in the image above, reveals the numerator and denominator of the Dividend Cushion ratio. At the core, the larger the numerator, or the healthier a company’s balance sheet and future free cash flow generation, relative to the denominator, or a company’s cash dividend obligations, the more durable the dividend. Honeywell is a solid free cash flow generator, though its net balance sheet considerations (namely its net debt load) weigh negatively on its dividend strength.
The Dividend Cushion Ratio Deconstruction image up above puts sources of free cash in the context of financial obligations next to expected cash dividend payments over the next 5 years on a side-by-side comparison. Because the Dividend Cushion ratio and many of its components are forward-looking, our dividend evaluation may change upon subsequent updates as future forecasts are altered to reflect new information.
In the context of the Dividend Cushion ratio, Honeywell’s numerator is larger than its denominator suggesting strong dividend coverage in the future. The company’s favorable near and longer term forecasts put out this year, along with its sizable and growing backlog, underpins our expectations that Honeywell will be able to grow its dividend at a robust pace going forward.
Concluding Thoughts
Honeywell pays a strong and competitive dividend supported by its healthy financial position. The firm has pushed through annual dividend increases over the past 10+ consecutive years, and we expect that Honeywell will maintain its payout growth trajectory going forward. Management continues to target high return capital spending opportunities as it pursues key process initiatives and productivity improvements, a healthy combination for ongoing segment margin expansion. We’re huge fans of Honeywell’s robust order backlog and its ample pricing power.
We view Honeywell’s dividend growth potential quite favorably, and its capital appreciation upside potential is decent as well.
Be the first to comment