

patty_c/iStock Unreleased via Getty Images
In this analysis of Home Depot, Inc. (NYSE:HD) vs. Lowe’s Companies, Inc. (NYSE:LOW), we compared the two largest home improvement retailers with a combined share of 48% in 2021. First, we compared the company in terms of market leadership where we looked into the market share of both companies in the home improvement retail market, revenue stream by geographic region and sales metrics including sales per store and retail square foot, customer transactions and average ticket size.
Next, we compared both companies in terms of their service capabilities where we examined their customer reviews on third-party review sites, product range based on their websites, average pricing of products and distribution & logistics capabilities.
Lastly, we examined their company profitability by looking into their profit margins in terms of gross, operating and net as well as its cash flows by FCF margins and company financials through its net debt as a % of market cap and credit ratios.
Market Leadership
To compare the two companies in terms of their market leadership, we looked into 3 factors which were their market share, geographical revenue, store count and sales metrics.
Market Share
Company Data, Khaveen Investments
In terms of the market share of home improvement retail, Home Depot and Lowe‘s are two of the largest companies. Though, Home Depot is larger than Lowe‘s and has retained its position as the number one company in the past 10 years. Although both companies gained a share in the past 10 years, Home Depot edged out Lowe‘s with a higher share gain as its revenue growth was 8.4% compared to 7.19% for Lowe‘s.
Geographic Revenue
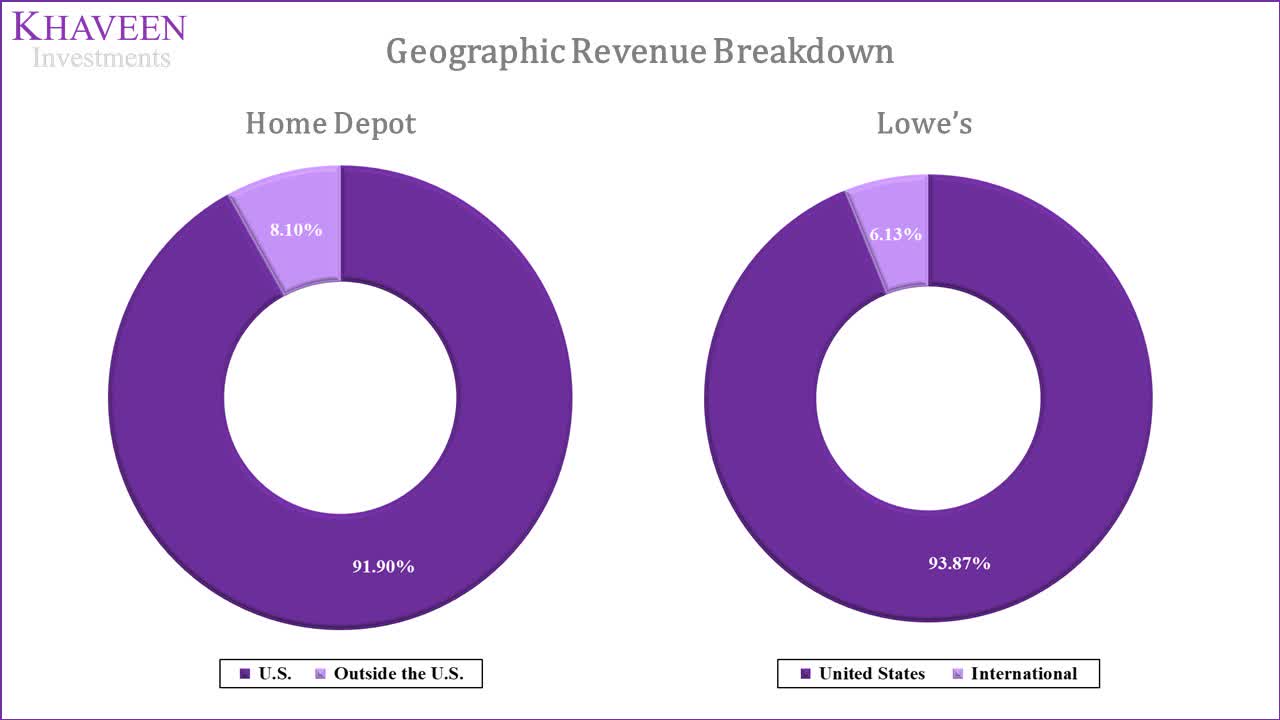
Moreover, based on their annual reports, both companies show a high revenue concentration in the US which accounted for over 90% of their revenues in 2021 with Lowe‘s having a slightly higher revenue contribution from the US. On the other hand, Home Depot had a slightly higher revenue contribution from its international operations in Canada. Overall, we believe both companies show a high revenue concentration risk as their revenues lack geographical diversification being heavily dependent on the US but Home Depot has a slightly lower risk than Lowe‘s.
Sales Metrics
While we believe the number of stores to be a key indicator of its ability to serve customers, we also consider other metrics which could indicate the strengths of its business including sales per store, sales per square foot, customer transactions and average ticket size.
|
Sales Metrics |
Home Depot |
Lowe’s |
|
Revenue |
151,157 |
96,250 |
|
Growth % (10-year) |
8.4% |
7.2% |
|
Sales per Store |
65.2 |
48.8 |
|
Growth % (10-year) |
8.1% |
6.0% |
|
Customer Transactions (‘mln’) |
1,760 |
1,002 |
|
Growth % (10-year) |
3.0% |
2.3% |
|
Average Ticket |
85.9 |
96.1 |
|
Growth % (10-year) |
5.3% |
4.8% |
Source: Home Depot, Lowe‘s, Khaveen Investments
Based on the table, Home Depot had higher revenues than Lowe‘s and a higher 10-year growth rate. Besides that, Home Depot was superior to Lowe‘s in all sales metrics except average ticket size, with higher sales per store, sales per retail square foot and customer transactions. Moreover, Home Depot even had a higher 10-year average growth rate for all these metrics. Therefore, we believe that although Home Depot had lower store count growth than Lowe‘s, it had been focused on growing its sales and transactions in its stores which had been driving its revenue growth.
To forecast both companies’ revenues, we used their average 10-year sales per store growth tapered down by 1% per year and store growth to derive their total revenue growth.
|
Revenue Projections |
2019 |
2020 |
2021 |
2022F |
2023F |
2024F |
2025F |
2026F |
|
Home Depot Stores |
1,984 |
2,296 |
2,317 |
2,329 |
2,341 |
2,352 |
2,364 |
2,376 |
|
Growth % |
-13.2% |
15.7% |
0.9% |
0.5% |
0.5% |
0.5% |
0.5% |
0.5% |
|
Home Depot Sales per Store |
55.6 |
57.5 |
65.2 |
69.9 |
74.1 |
77.9 |
81.1 |
83.6 |
|
Growth % |
17.4% |
3.6% |
13.4% |
7.1% |
6.1% |
5.1% |
4.1% |
3.1% |
|
Home Depot Revenue ($ mln) |
110,225 |
132,110 |
151,157 |
162,705 |
173,500 |
183,268 |
191,744 |
198,684 |
|
Growth % |
1.9% |
19.9% |
14.4% |
7.6% |
6.6% |
5.6% |
4.6% |
3.6% |
|
Lowe’s Stores |
1,977 |
1,974 |
1,971 |
1,998 |
2,025 |
2,052 |
2,080 |
2,108 |
|
Growth % |
-1.9% |
-0.2% |
-0.2% |
1.3% |
1.3% |
1.3% |
1.3% |
1.3% |
|
Lowe’s Sales per Store |
36.5 |
45.4 |
48.8 |
51.3 |
53.3 |
54.9 |
55.9 |
56.5 |
|
Growth % |
3.1% |
24.4% |
7.6% |
5.0% |
4.0% |
3.0% |
2.0% |
1.0% |
|
Lowe’s Revenue ($ mln) |
72,148 |
89,597 |
96,250 |
102,385 |
107,874 |
112,564 |
116,317 |
119,016 |
|
Growth % |
1.2% |
24.2% |
7.4% |
6.4% |
5.4% |
4.3% |
3.3% |
2.3% |
Source: Home Depot, Lowe‘s, Khaveen Investments
Overall, we believe Home Depot has an advantage over Lowe‘s for the market leadership point as it has the highest market share in the home improvement retail market, slightly more revenue exposure to international business and better sales metrics in terms of revenue growth, store count, sales per average retail square foot, customer transactions and average ticket growth.
|
Market Leadership |
Advantage |
|
Market Share |
Home Depot |
|
Geographic Revenue |
Home Depot |
|
Sales Metrics |
Home Depot |
|
Overall |
Home Depot |
Source: Khaveen Investments
Service Capability
To compare the two companies in terms of their service capability, we looked into 3 factors which were their customer reviews, product range, pricing and distribution and logistics.
Customer Reviews
To compare both companies in terms of their customer service, we looked into their average customer reviews from Trust Pilot and identified the company with the best ratings.
|
Company |
Average Customer Reviews |
|
Home Depot |
1.4 |
|
Lowe‘s |
1.5 |
Source: Trust Pilot
From the table, both companies had poor reviews on Trust Pilot with both under 2 out of 5 stars. Based on the reviews, we found the customer complaints to be in terms of a variety of factors including customer service. Though, Lowe‘s had a slightly better rating than Home Depot. We believe this indicates a similar customer service level for both companies, but Lowe‘s is slightly better off.
Product Range
Moreover, we examined the companies in terms of their product range to determine which company has an advantage in product variety. To compare their product range, we looked into their websites and compiled the number of product subcategories for 14 categories below.
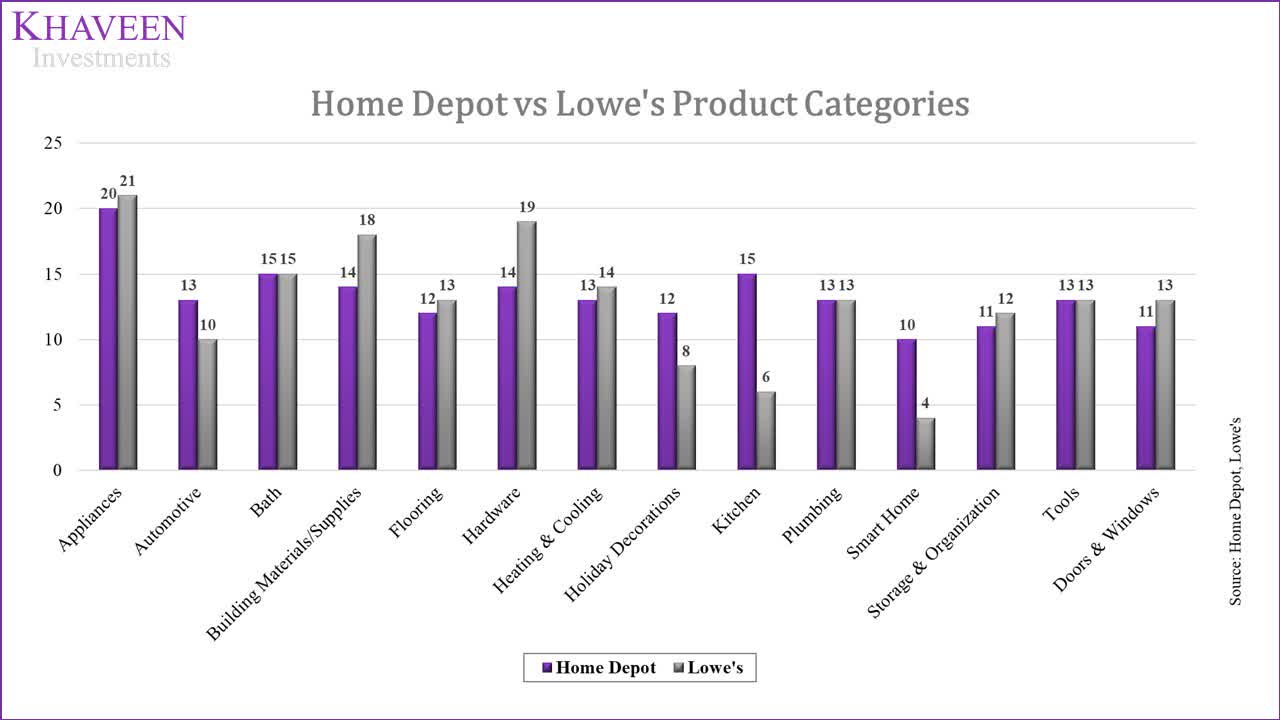
Based on the chart, we found Lowe‘s to have a higher number of product subcategories across 7 of the 14 product categories which are appliances, building materials & supplies, flooring, hardware, heating & cooling, storage & organization and doors & windows. On the other hand, Home Depot has a higher number of subcategories in 4 product categories such as automotive, holiday decorations, kitchen and smart home. In 3 product categories, both companies were tied with an equal number of subcategories which are bath, plumbing and tools. However, Home Depot have a higher number of product subcategories in total across all 14 product categories at 186 subcategories compared to 179. We believe this highlights Home Depot‘s advantage by having a higher number of product subcategories in total. Though, Lowe‘s has been expanding its private brand portfolios such as allen + roth and Stainmaster. Notwithstanding, we believe Home Depot have an advantage over Lowe‘s with a greater variety of products to attract and serve customers.
Pricing
Besides that, we also compared these companies in terms of their product pricing. Similar to the previous factor, we compiled the product listing price for 14 selected products for each category and calculated the price difference between them.
|
Category |
Product |
Home Depot ($) |
Lowe’s ($) |
Difference |
|
Appliances |
GE 4.8 cu. ft. High-Efficiency White Top Load Washing Machine with FlexDispense and Sanitize with Oxi, ENERGY STAR |
899 |
999 |
-11% |
|
Automotive |
Battery Extender 12-Volt 1,200 Amp Battery Jump Starter |
154 |
149 |
3% |
|
Bath |
Genta Single Hole Single-Handle Bathroom Faucet in Chrome |
263.85 |
292.62 |
-11% |
|
Building Materials/Supplies |
Quikrete 20 lb. Hydraulic Water-Stop Cement Concrete Mix |
15.37 |
24.48 |
-59% |
|
Flooring |
BrucePlano Oak Gunstock 3/4 in. Thick x 3-1/4 in. |
4.39 |
5.29 |
-21% |
|
Hardware |
Tapcon1/4 in. x 3-1/4 in. Hex-Washer-Head Concrete Anchors (75-Pack) |
31.98 |
31.98 |
0% |
|
Heating & Cooling |
8,000 BTU ENERGY STAR Window Smart Room Air Conditioner |
249 |
319 |
-28% |
|
Holiday Decorations |
6 ft. Downswept Douglas Fir Artificial Christmas Tree with Clear Lights |
250.55 |
323.99 |
-29% |
|
Kitchen |
KRAUSLoften All-in-One Dual Mount Drop-In Stainless Steel 33 in. 2-Hole Single Bowl Kitchen Sink |
429.95 |
419.95 |
2% |
|
Plumbing |
ISPRINGCountertop Multi Filtration Drinking Water Filter Dispenser |
66.8 |
61.17 |
8% |
|
Smart Home |
TP-LINKAC1200 Wi-Fi Range Extender |
49.98 |
49.98 |
0% |
|
Storage & Organization |
ClosetMaid SuperSlide 48 in. W x 12 in. D Wire Fixed Mount Shelf Kit with Closet Rod |
37.98 |
41.78 |
-10% |
|
Tools |
DEWALTATOMIC 20-Volt MAX Cordless Brushless Compact 1/2 in. Drill/Driver, (2) 20-Volt 1.3Ah Batteries |
159 |
159 |
0% |
|
Doors & Windows |
KwiksetJuno Satin Nickel Exterior Entry Door Knob and Single Cylinder Deadbolt Combo Pack Featuring SmartKey Security |
47.97 |
50.97 |
-6% |
|
Average |
– |
– |
– |
-12% |
Source: Home Depot, Lowe‘s
In the table, Home Depot had lower pricing for 8 of the 14 total products than Lowe‘s. The average pricing for all products was 12% lower than Lowe‘s. Though, 3 out of the 14 products were the same price. Thus, we believe this could provide Home Depot with a pricing advantage for its products to make it more competitive and attract customers.
Distribution and Logistics
Lastly, both companies have large distribution systems to handle and fulfil their customers‘ orders and purchases. We compared both companies‘ distribution and logistics capabilities based on their delivery times and the number of distribution centers to determine which has a better distribution system. Moreover, both companies had introduced BOPIS to customers to purchase online and pick up from stores. Thus, we compared the number of store locations to determine which company has an advantage with more locations.
|
Distribution and Logistics |
Home Depot |
Lowe‘s |
|
Delivery Time |
Average 4 Business Days |
Average 2.5 Business Days |
|
Distribution Centres |
90 |
15 |
|
Number of Stores |
2,317 |
1,971 |
Source: Home Depot, Lowe‘s
Based on the table above, Lowe‘s stated delivery time is comparably shorter than Home Depot and even provides same-day delivery services as well. However, in terms of distribution centers, Home Depot have a higher number of facilities compared to Lowe‘s. Additionally, Home Depot also have a larger store footprint with a higher number of stores which we believe bodes well for its BOPIS services.
All in all, while we see Lowe‘s having an advantage in customer reviews, we determined that Home Depot have a greater product selection, more competitive pricing and better distribution which we believe could provide it with an advantage over Lowe‘s.
|
Service Capability |
Advantage |
|
Customer Reviews |
Lowe‘s |
|
Product Range |
Home Depot |
|
Pricing |
Home Depot |
|
Distribution and Logistics |
Home Depot |
|
Overall |
Home Depot |
Source: Home Depot, Lowe‘s, Khaveen Investments
Company Financials
For the last point, we compared both companies by looking at their revenue growth, profit margins, profit per store and growth, net debt, credit ratios and cash flow.
Profitability
The first part we looked into for both companies was in terms of their profitability as measured by their gross, operating and net margins based on their 10-year historical average.
|
Profitability |
Home Depot |
Lowe’s |
|
Gross Margins (10-year average) |
34.13% |
33.5% |
|
Operating Margins (10-year average) |
13.66% |
9.25% |
|
Net Margins (10-year average) |
8.65% |
5.2% |
Source: Home Depot, Lowe‘s
According to the table above, both companies have positive earnings. However, Home Depot is superior to Lowe‘s with margins on a 10-year basis. Its gross, net and operating margins were all higher than Lowe‘s which we believe provides it with an advantage over Lowe‘s.
Home Depot, Khaveen Investments Lowe‘s, Khaveen Investments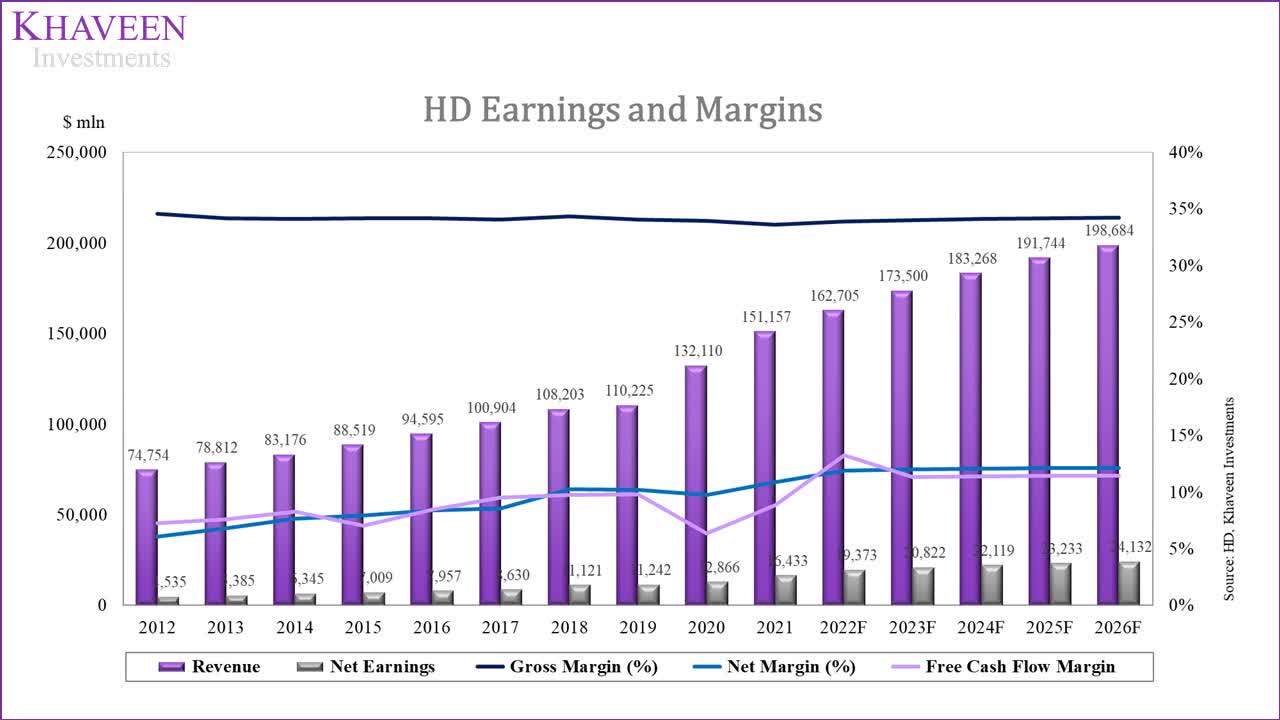
Financial Health
Besides profitability, we compared both companies by their financial health in terms of their net debt and credit ratios including EBITDA interest coverage, FCF interest coverage and EBITDA/Net Debt.
Home Depot, Khaveen Investments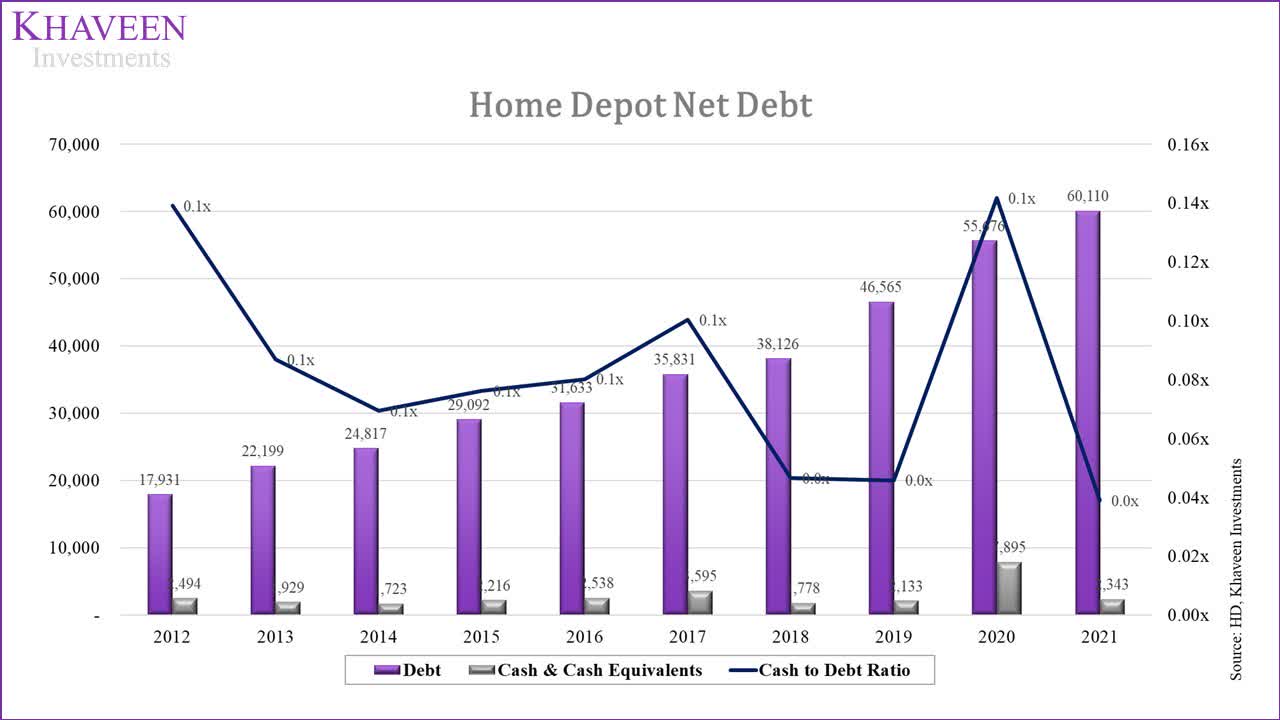
For Home Depot, the company had a net debt of $57.7 bln in 2021 which was 18.1% of its market cap. Its net debt had steadily increased in the past 10 years while its cash to debt ratio declined.
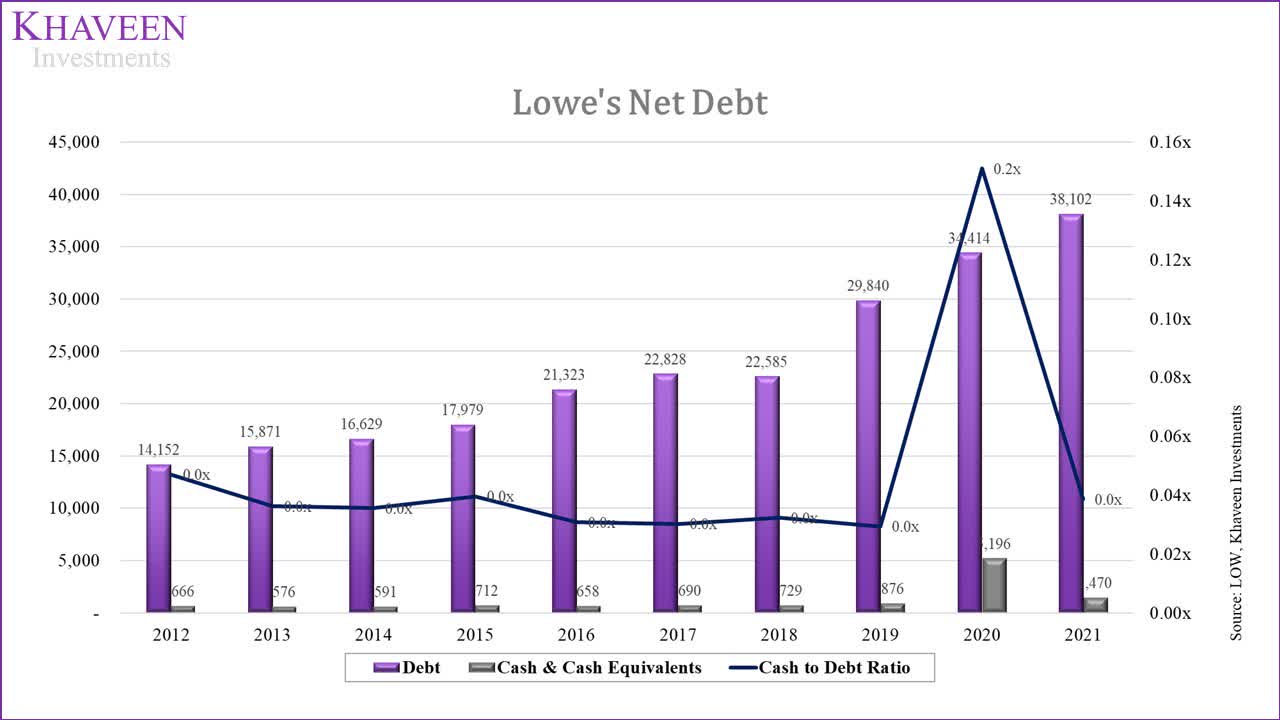
In comparison, Lowe‘s had a lower net debt of $36.6 bln but is higher in terms of % of market cap at 26.4%. Similar to Home Depot, its net debt had increased in the past 10 years.
|
Credit Ratios |
Home Depot |
Lowe’s |
|
Net Debt ($ mln) |
57,767 |
36,632 |
|
Net Debt as % of Market Cap |
18.10% |
26.40% |
|
EBITDA interest coverage (10-year Average) |
18.02x |
12.69x |
|
FCF interest coverage (10-year Average) |
9.52x |
6.63x |
|
EBITDA/Net Debt (10-year Average) |
0.51x |
0.37x |
Source: Home Depot, Lowe‘s
Moving to their credit ratios, generally, Home Depot had better credit ratios as its EBITDA and FCF interest coverage as well as EBITDA/Net Debt were higher than Lowe‘s. Overall, we believe that Home Depot has an advantage over Lowe‘s as its net debt as a % of market cap is lower than Lowe‘s indicating its relatively less risk and supported by Home Depot‘s better credit ratios.
Cash Flows
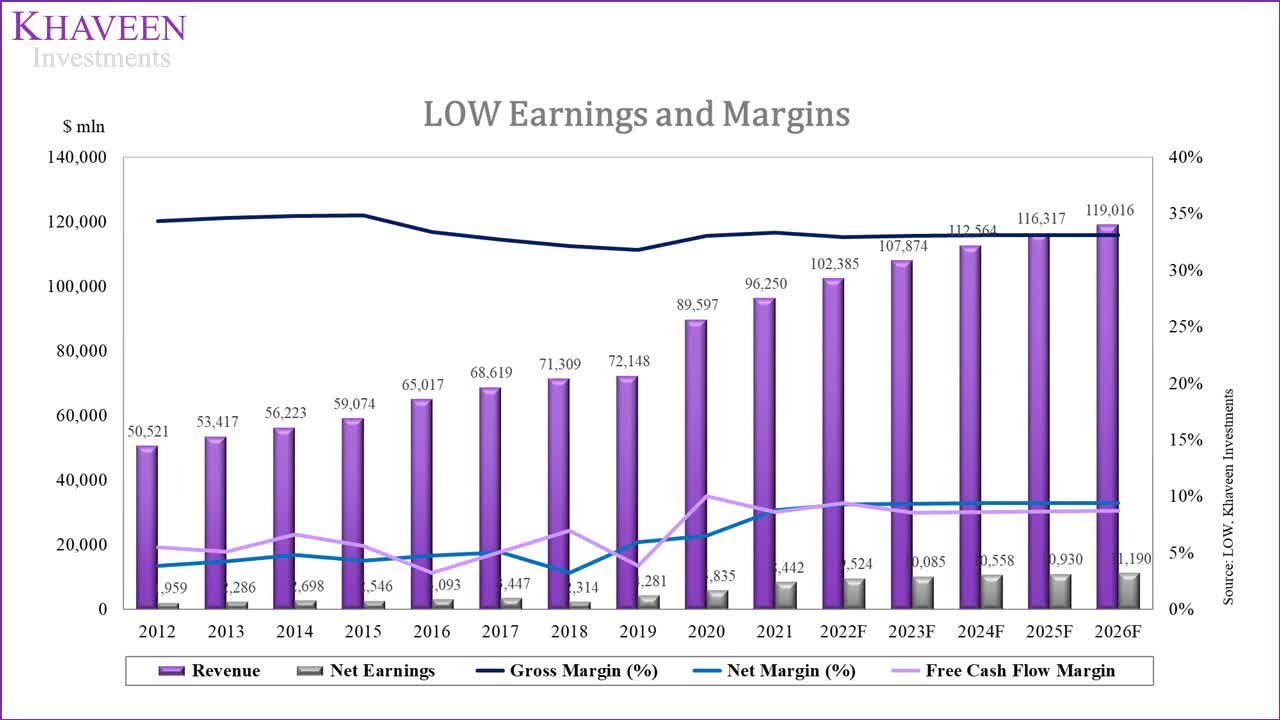
Finally, we compared the companies in terms of their cash flow generation abilities as measured by their FCF margins.
Home Depot, Khaveen Investments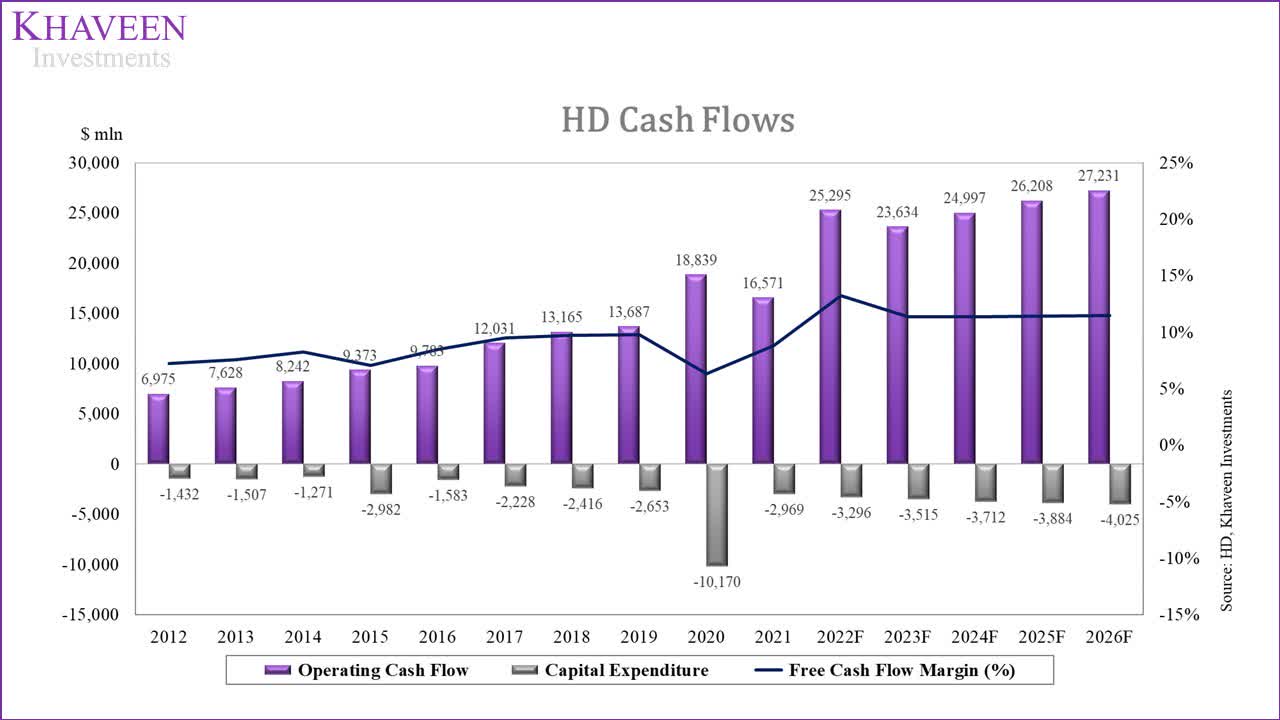
Home Depot had an average FCF margin of 8.3% and had been increasing in the past 10 years.
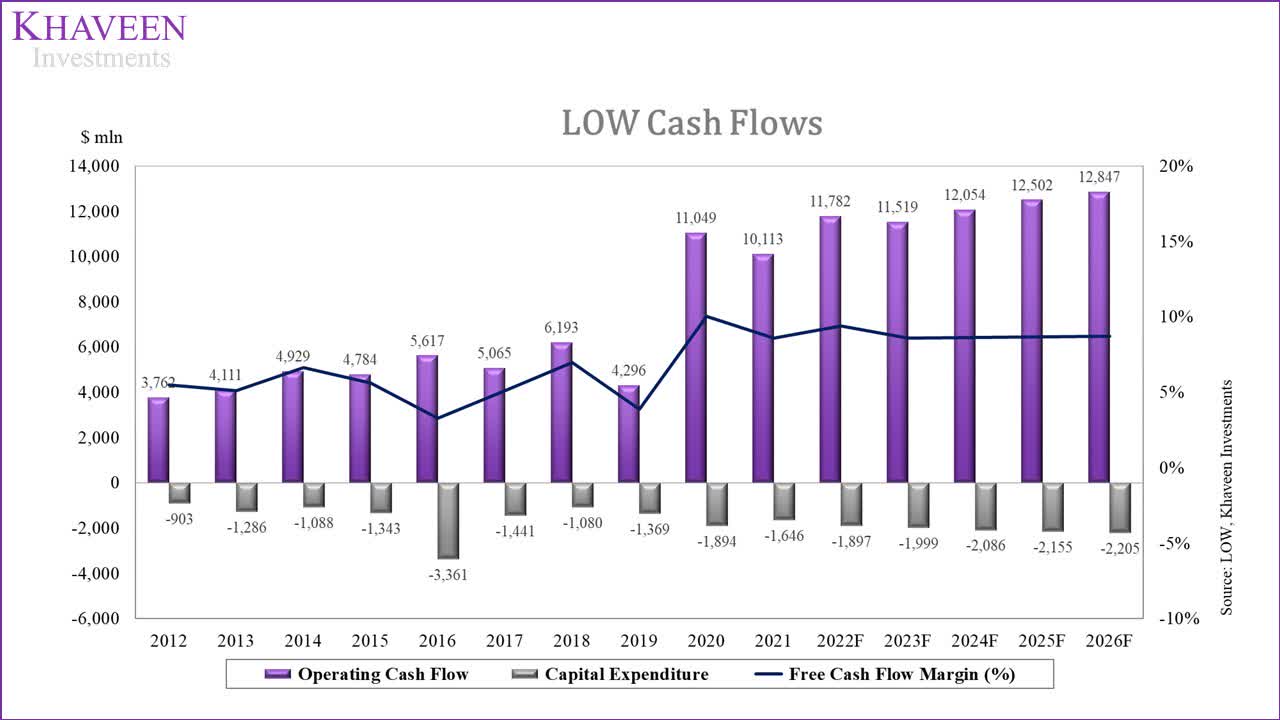
In comparison, Lowe‘s had an average FCF margin of 6.1% and had been increasing in the past 10 years.
|
Cash Flow |
Home Depot |
Lowe’s |
|
FCF ($ mln) |
13,328 |
8,281 |
|
FCF Margin (10-year) |
8.3% |
6.1% |
|
Capex as % of Revenue (10-year average) |
1.9% |
1.9% |
|
FCF per Share ($) |
12.90 |
12.52 |
Source: Home Depot, Lowe‘s, Khaveen Investments
Based on the table, Home Depot had higher FCF margins and also a lower capex as a % of revenue. Similarly, its 10-year average FCF margins were also higher than Lowe‘s. Additionally, its FCF per share is higher than Lowe‘s. Overall, we believe Home Depot is superior to Lowe‘s in terms of its cash flows.
To conclude, as Home Depot had better profitability with higher margins and profit per store, lower net debt and solid credit ratios as well as higher FCF margins, we believe Home Depot edges out over Lowe‘s in terms of financials.
|
Company Financials |
Advantage |
|
Profitability |
Home Depot |
|
Financial Health |
Home Depot |
|
Cash Flows |
Home Depot |
|
Overall |
Home Depot |
Source: Khaveen Investments
Risk: Competition from E-commerce Companies
Both Home Depot and Lowe‘s were relatively late to adopt e-commerce and depend primarily on their physical stores for business. With the rise of e-commerce, we believe these companies could be faced with greater competition.
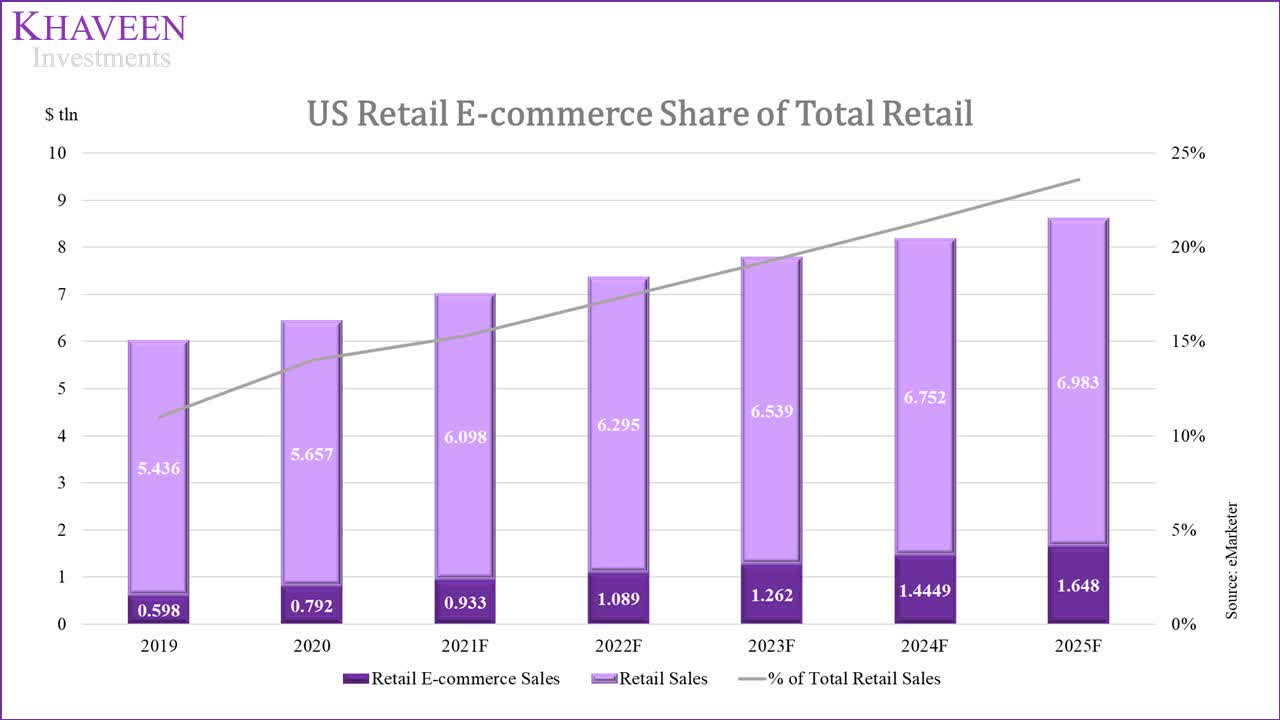
According to eMarketer, the share of e-commerce sales is forecasted to increase to 23.6% by 2025 from 11% in 2019. For example, Amazon (AMZN) which is the largest e-commerce company in the US with a 41% market share had expanded into home improvement retail. We believe that this could pose a risk to both Home Depot and Lowe‘s growth outlook with increased competition from e-commerce competitors.
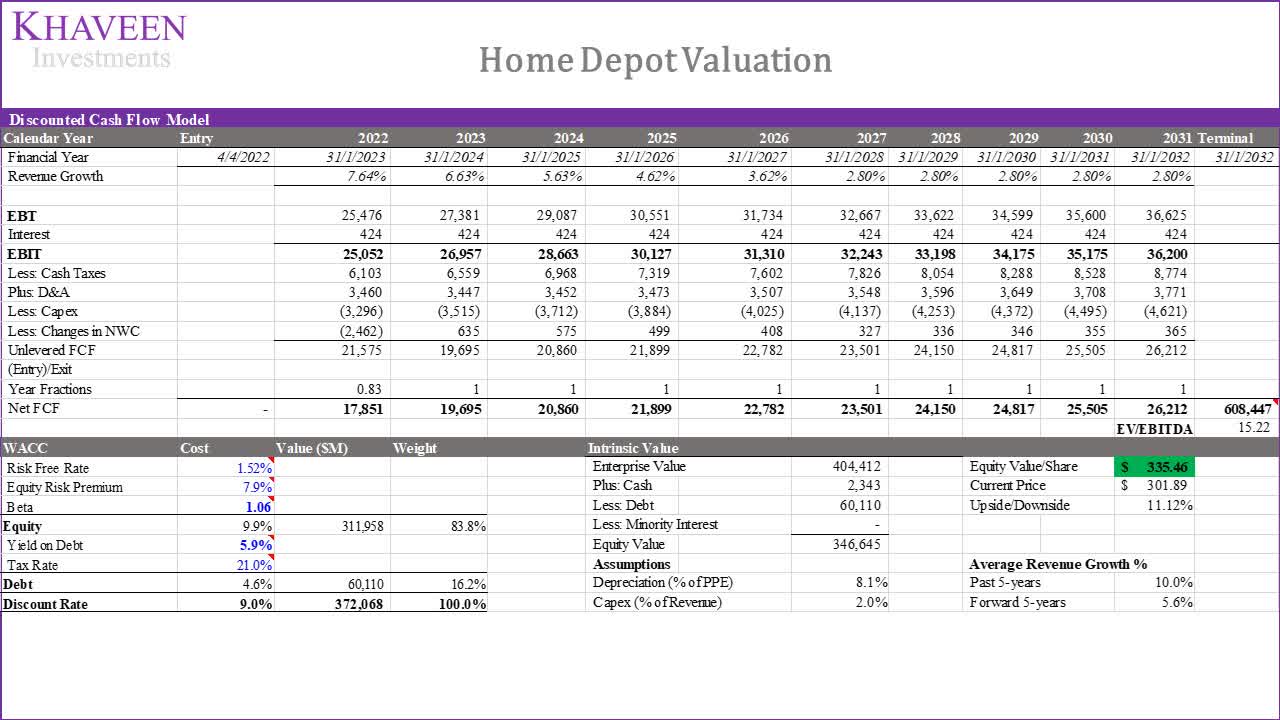
Valuation
Home Depot
To value the company, we used a DCF valuation as we expect the company to continue having positive FCFs. We summarized our revenue projections for the company in the table below.
|
Revenue Projections |
2020 |
2021 |
2022F |
2023F |
2024F |
2025F |
2026F |
|
Home Depot Stores |
2,296 |
2,317 |
2,329 |
2,341 |
2,352 |
2,364 |
2,376 |
|
Growth % |
15.7% |
0.9% |
0.5% |
0.5% |
0.5% |
0.5% |
0.5% |
|
Home Depot Sales per Store |
57.5 |
65.2 |
69.9 |
74.1 |
77.9 |
81.1 |
83.6 |
|
Growth % |
3.6% |
13.4% |
7.1% |
6.1% |
5.1% |
4.1% |
3.1% |
|
Home Depot Revenue ($ mln) |
132,110 |
151,157 |
162,705 |
173,500 |
183,268 |
191,744 |
198,684 |
|
Growth % |
19.9% |
14.4% |
7.6% |
6.6% |
5.6% |
4.6% |
3.6% |
Source: Home Depot, Khaveen Investments
We derived our industry average EV/EBITDA multiple based on its competitors with an average of 15.22x.
Seeking Alpha, Khaveen Investments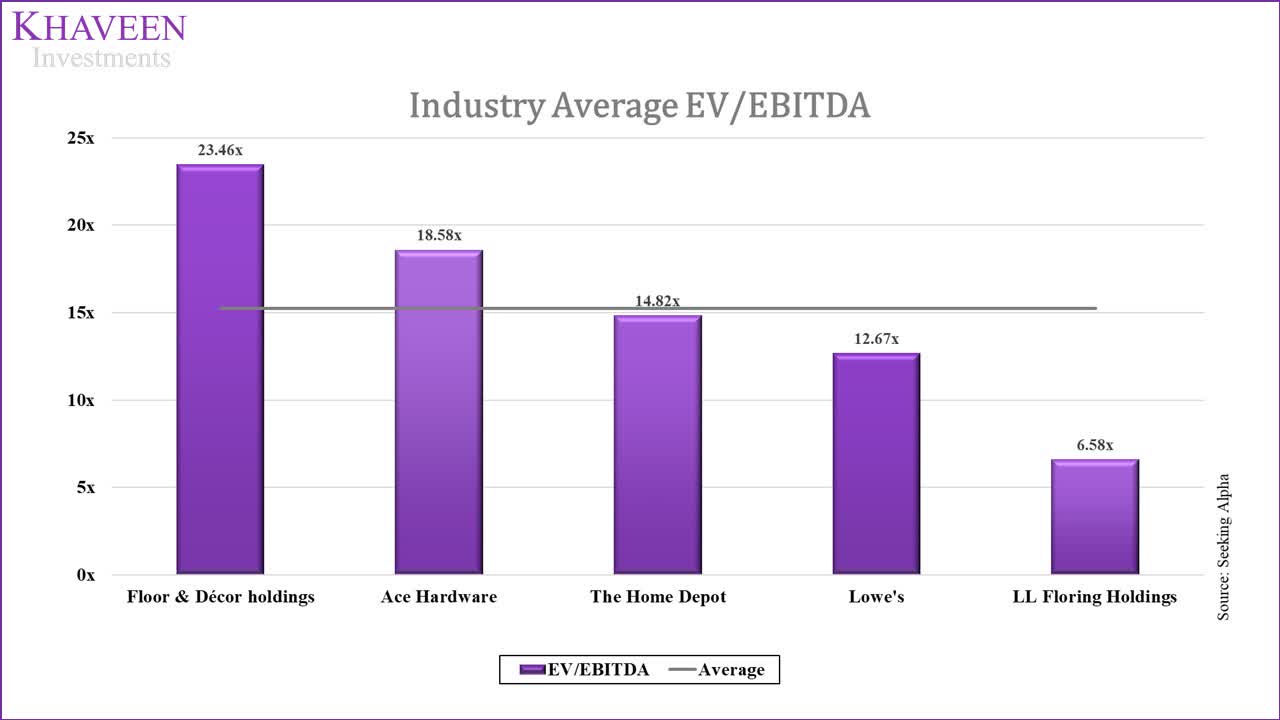
Based on a discount rate of 9%, our model shows its shares are undervalued by 11%.
Lowe‘s
Similarly, we valued Lowe‘s with a DCF valuation with our revenue projections summarized below.
|
Revenue Projections |
2020 |
2021 |
2022F |
2023F |
2024F |
2025F |
2026F |
|
Lowe’s Stores |
1,974 |
1,971 |
1,998 |
2,025 |
2,052 |
2,080 |
2,108 |
|
Growth % |
-0.2% |
-0.2% |
1.3% |
1.3% |
1.3% |
1.3% |
1.3% |
|
Lowe’s Sales per Store |
45.4 |
48.8 |
51.3 |
53.3 |
54.9 |
55.9 |
56.5 |
|
Growth % |
24.4% |
7.6% |
5.0% |
4.0% |
3.0% |
2.0% |
1.0% |
|
Lowe’s Revenue ($ mln) |
89,597 |
96,250 |
102,385 |
107,874 |
112,564 |
116,317 |
119,016 |
|
Growth % |
24.2% |
7.4% |
6.4% |
5.4% |
4.3% |
3.3% |
2.3% |
Source: Lowe‘s, Khaveen Investments
Based on a discount rate of 9.8%, our model shows its shares are fairly valued.
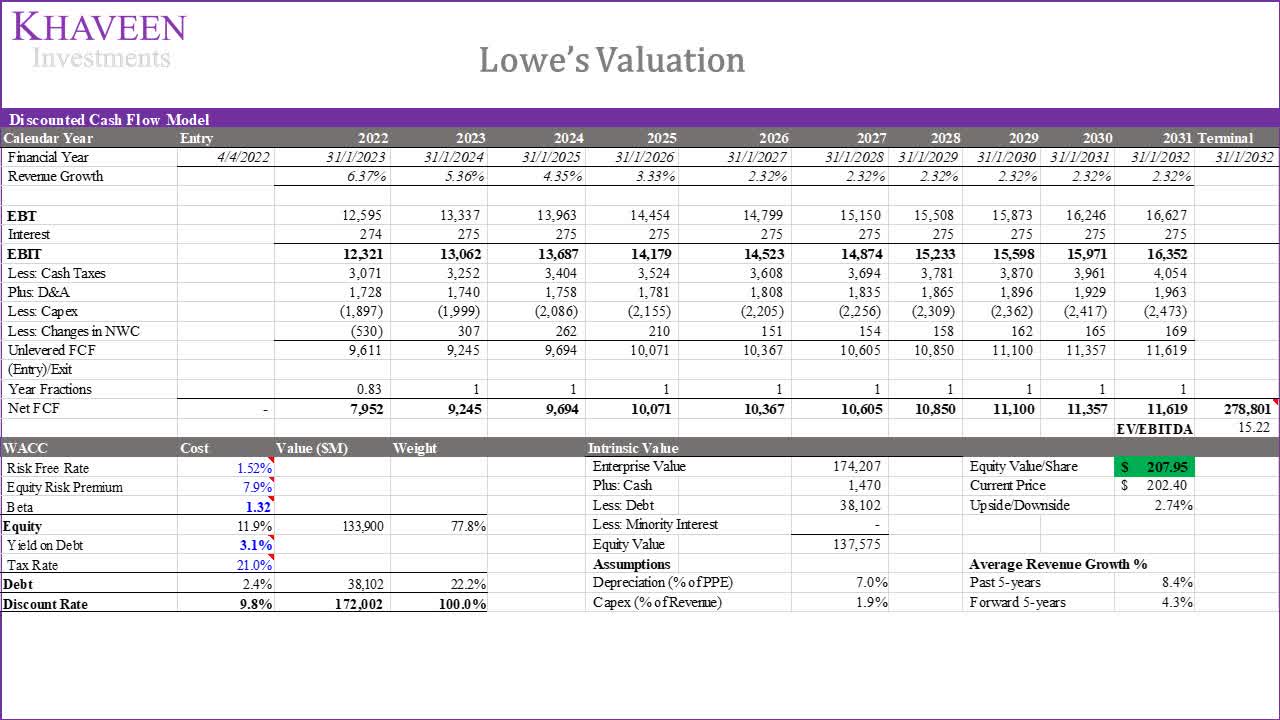
|
Valuation |
Price Target |
Upside |
Rating |
|
Home Depot |
$ 335.46 |
11.12% |
Buy |
|
Lowe’s |
$ 207.95 |
2.74% |
Hold |
Source: Khaveen Investments
Verdict
|
Market Leadership |
Home Depot |
|
Market Share |
Home Depot |
|
Geographic Revenue |
Home Depot |
|
Sales Metrics |
Home Depot |
|
Service Capability |
Home Depot |
|
Customer Reviews |
Lowe‘s |
|
Product Range |
Home Depot |
|
Pricing |
Home Depot |
|
Company Financials |
Advantage |
|
Profitability |
Home Depot |
|
Financial Health |
Home Depot |
|
Cash Flows |
Home Depot |
|
Valuation |
Home Depot |
|
Overall |
Home Depot |
Source: Khaveen Investments
To summarize, we analyzed both companies as the two largest home retail improvement retailers. For the first point, we examined the companies and determined that Home Depot had an edge over Lowe‘s with its dominant market share of 28% to Lowe‘s share of 18%. Both companies are highly dependent on the US which accounts for the majority of their revenues but Home Depot had slightly better international exposure. Additionally, we believe Home Depot is superior to Lowe‘s with better sales and operating metrics such as sales per store, retail square foot, and average ticket size which were all larger than Lowe‘s.
Furthermore, we believe Home Depot has an advantage in saving customers despite Lowe‘s slightly better customer reviews. This is due to its wider product selection as we analyzed 14 product categories and found Home Depot to have 4% more product subcategories than Lowe‘s. In addition, we found Home Depot to derive a pricing advantage through our analysis of 14 product categories with a difference of 12%. We also believe that Home Depot has better distribution and logistics systems with a higher number of facilities and stores for its BOPIS services.
Lastly, in terms of financials, we found Home Depot‘s financials to be superior in terms of profitability with higher margins, better cash flows, and a stronger financial position with a lower net debt as a % of market cap. Overall, we believe Home Depot to be a better home improvement retailer. We rate Home Depot as a Buy with a target price of $335.46 and Lowe‘s as a Hold with a $207.95 price target.
Be the first to comment