

gustavofrazao/iStock via Getty Images
Introduction
After a clearly exuberant 2021 (Figure 1), shares of home improvement giant The Home Depot (NYSE:HD) fell about 35%, hitting $270 during the broader market sell-off in late June 2022. Since then, the stock has recovered some of its losses and is now trading in the $330 range, in part due to an overall improvement in investor sentiment (e.g., the signing of the Inflation Reduction Act, somewhat positive inflation data, and HD management’s reaffirmation of its full-year guidance).
I opened a position in HD at the end of June and believe the improved investor sentiment is largely unfounded – especially with respect to the retail sector (see my recent article on Walmart (WMT) versus Target (TGT) and my update on Target). So, the current situation raises the question of whether I should sell my position in HD and book a nice short-term gain in anticipation of deteriorating investor sentiment, or whether I should continue to play the boring game and hold on to my shares, or perhaps even increase my position at this level.
Figure 1: FAST Graphs chart for HD, based on the 20-year adjusted operating earnings history and a market P/E ratio of 15 and a normal P/E ratio of 19.4 (obtained with permission from www.fastgraphs.com, Copyright FAST Graphs)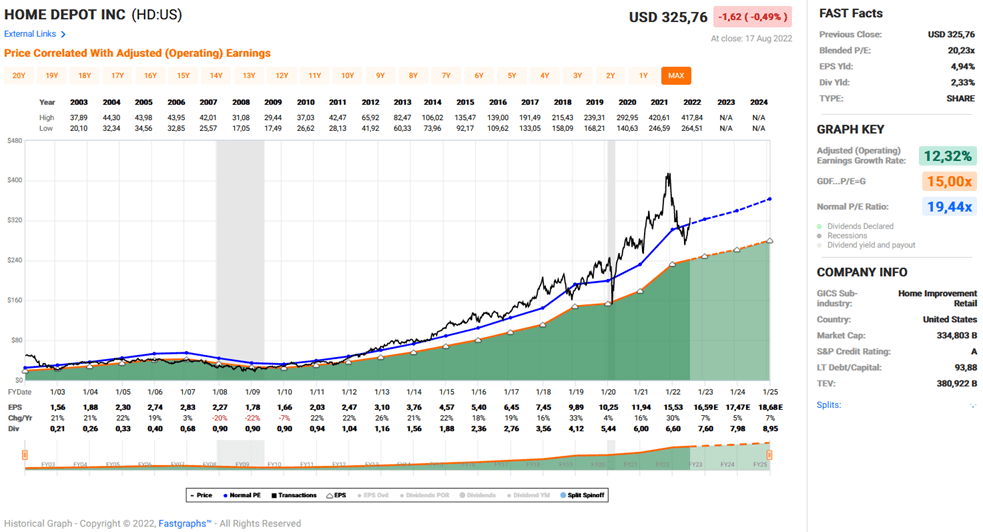
A Company Operating In a Duopoly
The Home Depot operates in a duopoly with Lowe’s (LOW). The two companies had a 30% share of the home improvement market in 2020, and their combined sales of $247 billion in 2021 (split roughly 39%/61% between LOW and HD) indicate that they continue to expand their presence. Their size and resulting dominance puts them on par with conventional retail giants Walmart (WMT) and Costco Wholesale (COST), and investment service Morningstar has rightly given a “wide economic moat” rating to the companies. HD has pricing power, which is of particular importance at a time of near double-digit inflation. Of course, as middle-man’s businesses, the companies have to be careful in passing on price increases to consumers, and might therefore suffer from intermittent margin pressures.
However, HD has a 44-year history and has therefore lived through periods of comparatively high inflation and six recessions, including the Great Financial Crisis caused in part by the bursting of the U.S. housing bubble. Given the known high operating leverage of retailers in general and the correlation of HD’s earnings with the performance of the housing market in particular, it would not have been surprising if the company had cut its dividend during the 12-month recession between the third quarter of 2008 and the second quarter of 2009. However, HD was able to maintain its quarterly dividend at Q4 2006 levels ($0.225 per share), and it also seems worth noting that the dividend had increased by 50% that year. This is another sign of the company’s dominant position in the market.
Strong Free Cash Flow Growth
The Home Depot is a surprisingly strong generator of free cash flow. Since fiscal 2004, the company has grown its free cash flow (normalized for working capital movements, impairment charges and stock-based compensation) at a compound annual growth rate (CAGR) of 11.4%. The company’s operating leverage is highlighted by the sharp decline in free cash flow in fiscal 2007 and 2008 (-35% and -5% year-over-year, respectively, Figure 2). Note that these figures take into account working capital movements, and without them the decline would have been even more significant, as the company increased its working capital base by $731 million in 2007. The same observation holds true for FY2021, a year in which HD increased its working capital by $3.8 billion, due in part to replenishing accounts that were severely depleted in fiscal 2020 (by $3.0 billion) and, of course, to inventory accounting (first-in, first-out method, p. 31, 2021 10-K). On average, the company has increased its working capital base by $265 million each year since 2004.
Figure 2: The Home Depot’s historical free cash flow, normalized for working capital movements, stock-based compensation expenses, and impairments (own work, based on the company’s fiscal 2004 to fiscal 2021 10-Ks)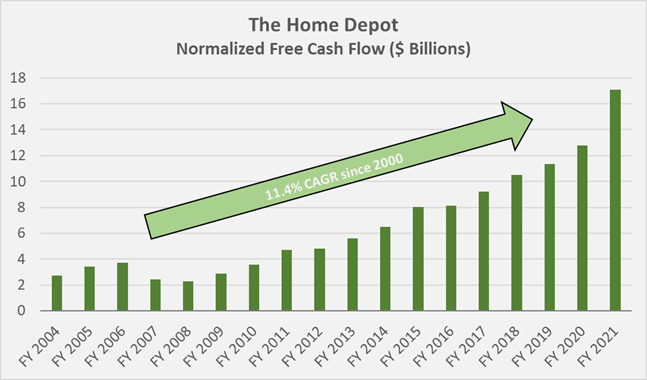
Robust Margins
As would be expected from an obviously well-managed company with a wide economic moat, HD’s margins are very robust (Figure 3). While the company’s gross margin (34.0% on average since 2004) does not suggest a particularly strong business, it is important to remember that HD is in the retail business. I therefore prefer to look at the standard deviation of the company’s gross margin, which is surprisingly low at just 30 basis points, based on data since 2004 and accordingly taking the Great Financial Crisis into account. The “worst” gross margin during this period – 33.6% – was observed in fiscal 2004, fiscal 2007, and fiscal 2020.
Figure 3: The Home Depot’s historical gross and normalized free cash flow margins and operating expenses in terms of sales (own work, based on the company’s fiscal 2004 to fiscal 2021 10-Ks)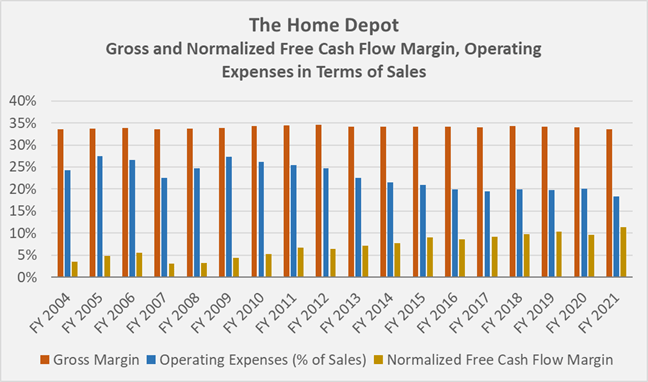
While gross margin is arguably difficult for a retailer to improve, operating costs offer many opportunities for savings and thus margin expansion. The Home Depot’s operating costs (selling, general and administrative, and depreciation) in terms of sales decreased from 26% (2004-2006 average) to 19% (2019-21 average).
Over the period covered here, HD’s free cash flow margin has doubled, from 5% in 2004-06 to 10% in 2019-21 (thee-year averages), indicating first-class execution skills. For example, HD’s management has relentlessly focused on improving working capital efficiency. Days sales outstanding are generally low (7 days on average), as most of HD’s customers pay directly. Days payables outstanding also remained about the same during the period (41 days on average). However, HD’s management was able to reduce the inventory days from 83 days (average 2004-2006) to 60 days (average 2019-21), which is the main reason for the decline in the firm’s cash conversion cycle (Figure 4).
Figure 4: The Home Depot’s historical cash conversion cycle (own work, based on the company’s fiscal 2004 to fiscal 2021 10-Ks)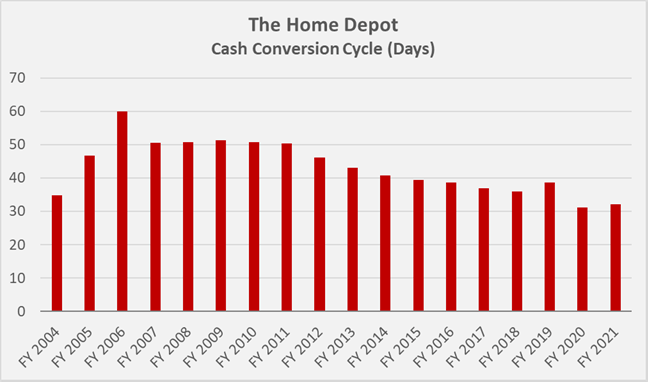
Stock-Based Compensation In Line With Operating Performance
Given the strong business performance, it is not surprising that stock-based compensation accounts for a significant portion of the company’s free cash flow. However, the growth in share-based payments (7.1% CAGR since 2004) appears very acceptable given the double-digit growth in free cash flow. As a result, stock-based compensation has actually declined relative to normalized free cash flow – from 5.6% in 2004-06 to 2.3% in 2019-21 (three-year averages). Of course, this figure should not be over-interpreted as it is based on data that may depend, for example, on the accounting treatment of the options at the time of grant.
Risks – And A Self-Inflicted Wound
Even though HD has monopolistic tendencies, the company naturally also harbors risks. Due to its focus on the U.S., HD’s currency risk is very low and the company could even benefit from a strong U.S. dollar due to lower import costs. Conversely, increasing protectionism may have a negative impact on the company, which is largely dependent on the sale of goods manufactured overseas.
It is well-known that HD is cyclical and exhibits a close correlation with the housing market (which is showing signs of a slow-down). As I mentioned earlier, I would not overstate HD’s cyclicality, as the company’s management is very experienced and the company has already lived through six recessions.
However, the company’s balance sheet has definitely seen better days. Management has been aggressively buying back shares, thereby significantly boosting earnings per share. Arguably, management has not demonstrated particularly good timing in repurchasing shares, as is evident from the $3.0 and $6.7 billion repurchased in fiscal 2006 and 2007, respectively, and the $14.8 billion (!) repurchased in fiscal 2021 (Figure 5). It seems only fair to say, however, that such conclusions are always easy with the benefit of hindsight. Conversely, it does not seem unreasonable to demand more foresight from management, considering that the cracks in the real estate market were already visible in 2007 and the fact that 2021 was an exuberant year from a stock market perspective was also very obvious.
Figure 5: The Home Depot’s historical share repurchases compared to the average price per share (own work, based on the company’s fiscal 2004 to fiscal 2021 10-Ks and the weekly closing stock price of HD)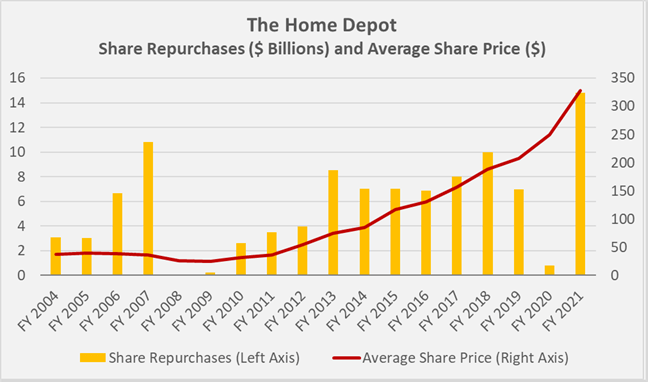
The number of diluted weighted average common shares declined from 2.2 billion in fiscal 2004 to 1.1 billion in fiscal 2021 – management has effectively repurchased 4.2% of the shares outstanding each year over the past 17 years, representing an increase in earnings per share of nearly 110% over the period. Of course, this must be taken into account when analyzing the company’s earnings on a per share basis and the growth trajectory – as usually reported – should be taken with a grain of salt.
Since 2004, management has spent an incredible $104 billion on share repurchases. Another $52 billion has been distributed to shareholders in the form of cash dividends (current payout ratio of around 50% based on 2019-21 average normalized free cash flow). Management spent significantly more on dividends and share repurchases than the business threw off in cash (i.e., $120 billion since 2004). This is the main reason for HD’s slightly negative equity ($1.7 billion at the end of fiscal 2021).
Because of the negative equity, and the amount of debt, HD’s balance sheet could be seen as inferior. However, I would not over-interpret the negative equity, even though it reeks a bit of aggressive management behavior, which I think is somewhat inappropriate for a cyclical retail business. At the end of fiscal 2021, the company had net debt of $44 billion, which includes about $6 billion in operating lease liabilities. This is certainly a large debt pile in absolute terms, but when put in relation to the company’s free cash flow, it does not seem worrisome. In the hypothetical scenario that HD suspends its dividend and share buybacks, the company would only need 3.2 years to pay off all of its interest-bearing debt, based on average free cash flow from 2019-21. In a recession, HD’s free cash flow would likely decline by 50%, increasing the company’s leverage ratio to about 6 times normalized free cash flow. The company’s interest coverage ratio of currently more than 11 times normalized pre-interest free cash flow is also very reassuring. A review of HD’s long-term debt maturity profile likewise does not reveal any bodies in the basement. With mostly fixed-rate debt, the company is reasonably shielded from rising interest rates, also because HD is only looking at $7.7 billion of long-term debt maturities until 2026. More than 50% of the company’s debt matures in 2033 and beyond, and the weighted-average interest rate of 3.45% is very reasonable.
Figure 6: The Home Depot’s long-term debt maturities at the end of fiscal 2021 (own work, based on the company’s fiscal 2021 10-K)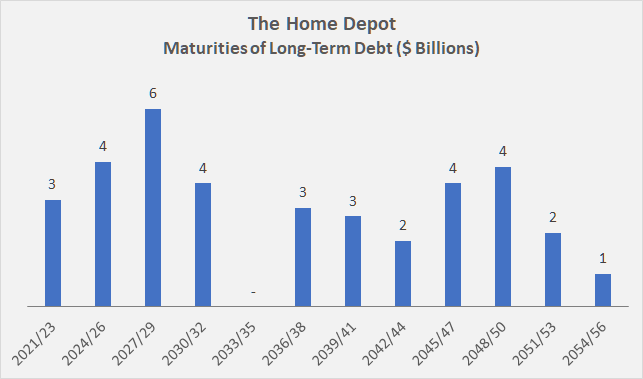
The buybacks can therefore be seen in a different light – management took advantage of very low financing costs, and I have a hard time dismissing their decision as completely wrong, even if the 2021 buybacks were particularly aggressive and likely have a low return on investment.
Why I Nevertheless Do Not Currently Consider HD Stock A Buy
In summary, everything sounds rosy from a long-term operational perspective. And indeed, HD is a great company that is well run, oozes cash, and has monopolistic tendencies.
However, I always try to factor valuation into my analyses, and that is where I think the stock is a bit overvalued right now. HD has benefited massively from a booming housing market since the Great Financial Crisis. In addition, artificially low interest rates and low commodity prices have provided further tailwinds. However, it increasingly looks as if the wind is shifting.
Investors should therefore ask themselves whether HD stock justifies the earnings multiple at which it has traded in recent years. FAST Graphs (Figure 1) suggests a price-to-earnings ratio of 19.44 as normal, based on the growth trajectory of the past 20 years. Based on HD’s 10-year earnings growth rate, a multiple of almost 23 could be considered normal (Figure 7).
Figure 7: FAST Graphs chart for HD, based on the 10-year adjusted operating earnings history and a market P/E ratio of 15 and a normal P/E ratio of 19.4 (obtained with permission from www.fastgraphs.com, Copyright FAST Graphs)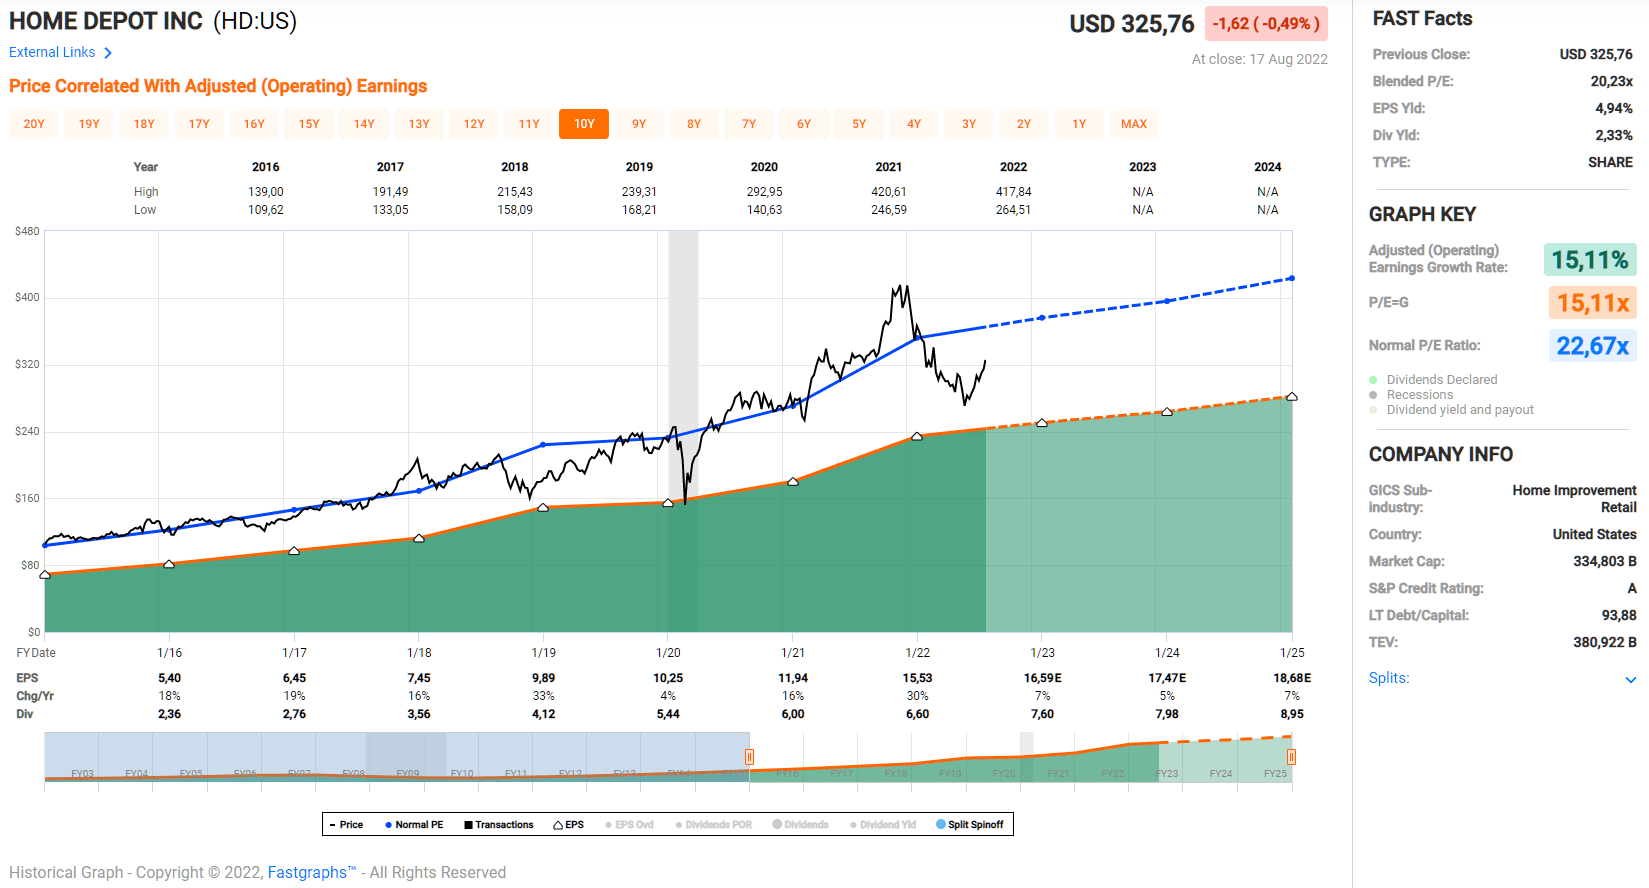
Of course, the multiple expansion over the past few years has been well deserved, as I have shown above, but I personally think both estimates are a bit optimistic when it comes to the valuation of the stock going forward. In addition to the headwinds mentioned above, it is important to remember that HD is already very large and growth will be limited at some point. Analysts expect earnings per share to grow at a fairly modest rate of 5% to 7% per annum through fiscal 2024. Such a growth rate makes sense from the perspective of the aforementioned fading tailwind, while recognizing that DIY home improvement customers play an important role at HD. As consumers’ disposable income declines, increasingly expensive professionals will likely have to give way to DIY approaches.
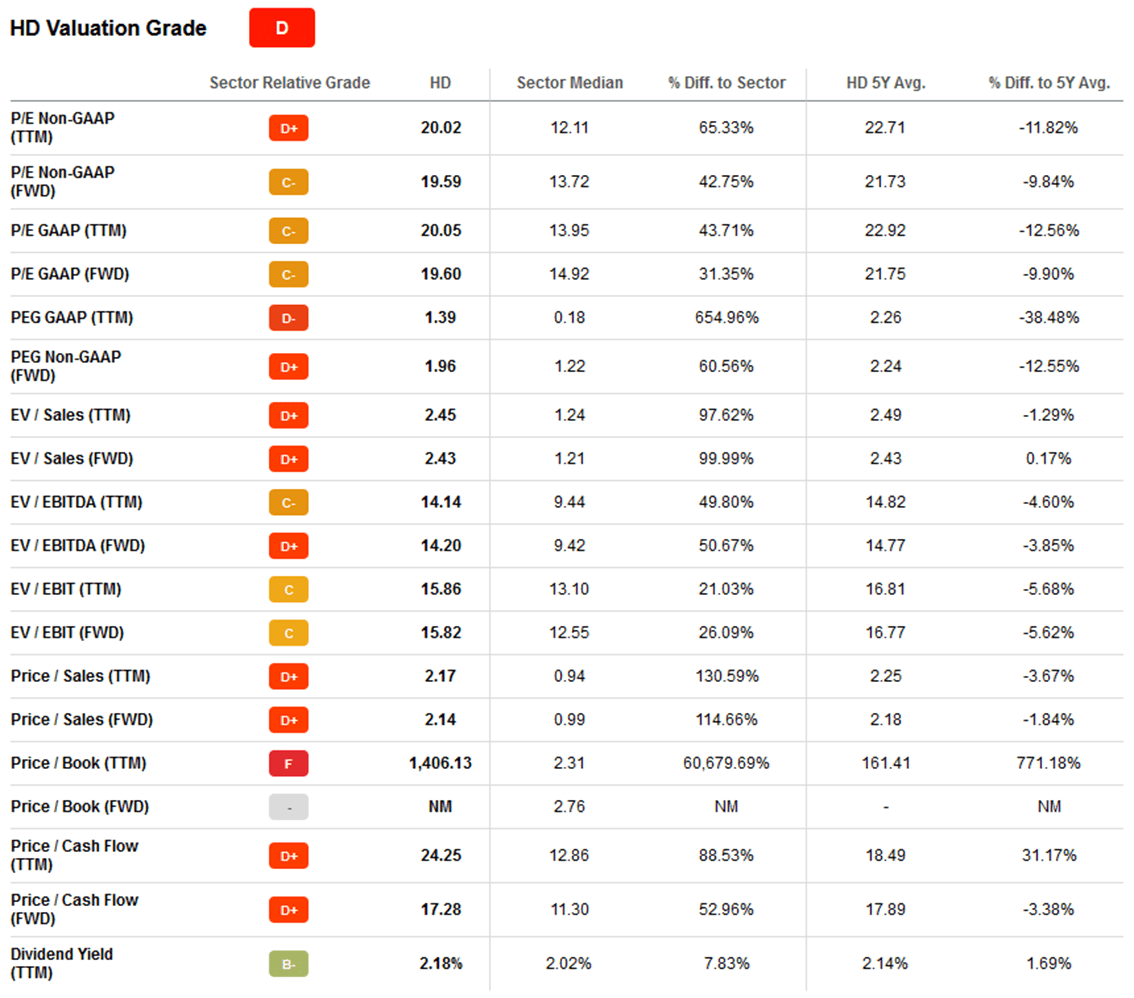
5% to 7% is certainly a good growth rate for a retailer against this backdrop, but I find it difficult to pay 20 times earnings, the current price of HD stock. I opened a position in the $270 range and am happy to hold on to my shares. Selling at a 20% gain sounds good in theory, but of course I would have to factor taxes into the equation. I also think my yield on cost (2.8%) is pretty good given the strong dividend growth (Figure 8). 2.8% also compares very favorably to the five-year average yield of 2.1% (Table 1). From this perspective, the shares still appear slightly undervalued with a current yield of 2.3%, but as mentioned earlier, a P/E ratio of 20 (and a free cash flow yield in the high 3% range) is quite a bit for a retailer that is likely past its strongest growth years. Earnings growth due to share buybacks should also be factored into the equation, as management has used debt to reduce share outstanding – an approach that will continue in the near term (management just announced another $15 billion buyback program) but should not necessarily be extrapolated into the future.
Figure 8: The Home Depot’s historical quarterly dividend as declared each quarter (own work, based on the data found on https://ir.homedepot.com/stock-information/dividend-history) Table 1: Valuation metrics according to Seeking Alpha (taken from the valuation tab on Seeking Alpha’s stock quote page)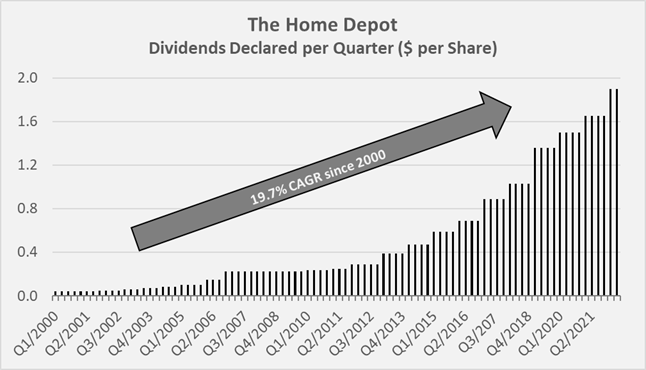
In conclusion, I rate The Home Depot as a solid hold. If my paper gains evaporate, which could easily be the case given the – in my opinion – unfounded optimism of market participants, I will of course add to my still modest position. I own the stock as a dividend growth stock and believe the company has the potential to become a dividend aristocrat like TGT or WMT, although this is certainly a tall order given the cyclicality of the business.
Thank you very much for taking the time to read my article. In case of any questions or comments, I’m very happy to read from you in the comments section below.
Be the first to comment