

kamisoka/E+ via Getty Images
According to Hoya Capital’s recent sector report, Office REITs have been the top performing sector thus far in 2022.
Office REITs have rebounded in early 2022 . . . following resilient fourth-quarter earnings results, better-than-expected job growth, and a broader rotation from growth into value . . . Office REITs . . . have become relative “value plays” in the post-pandemic period, trading at similar valuations as retail and hotel REITs. Private market pricing suggests that office REITs currently trade at a 10-20% discount to Net Asset Value (“NAV”), the widest NAV discount in the REIT sector. Also of note, office REITs are some of the most pro-cyclical sectors and as a result, provide some of the better inflation-hedging properties of any REIT sector despite their rather healthy dividend yields.
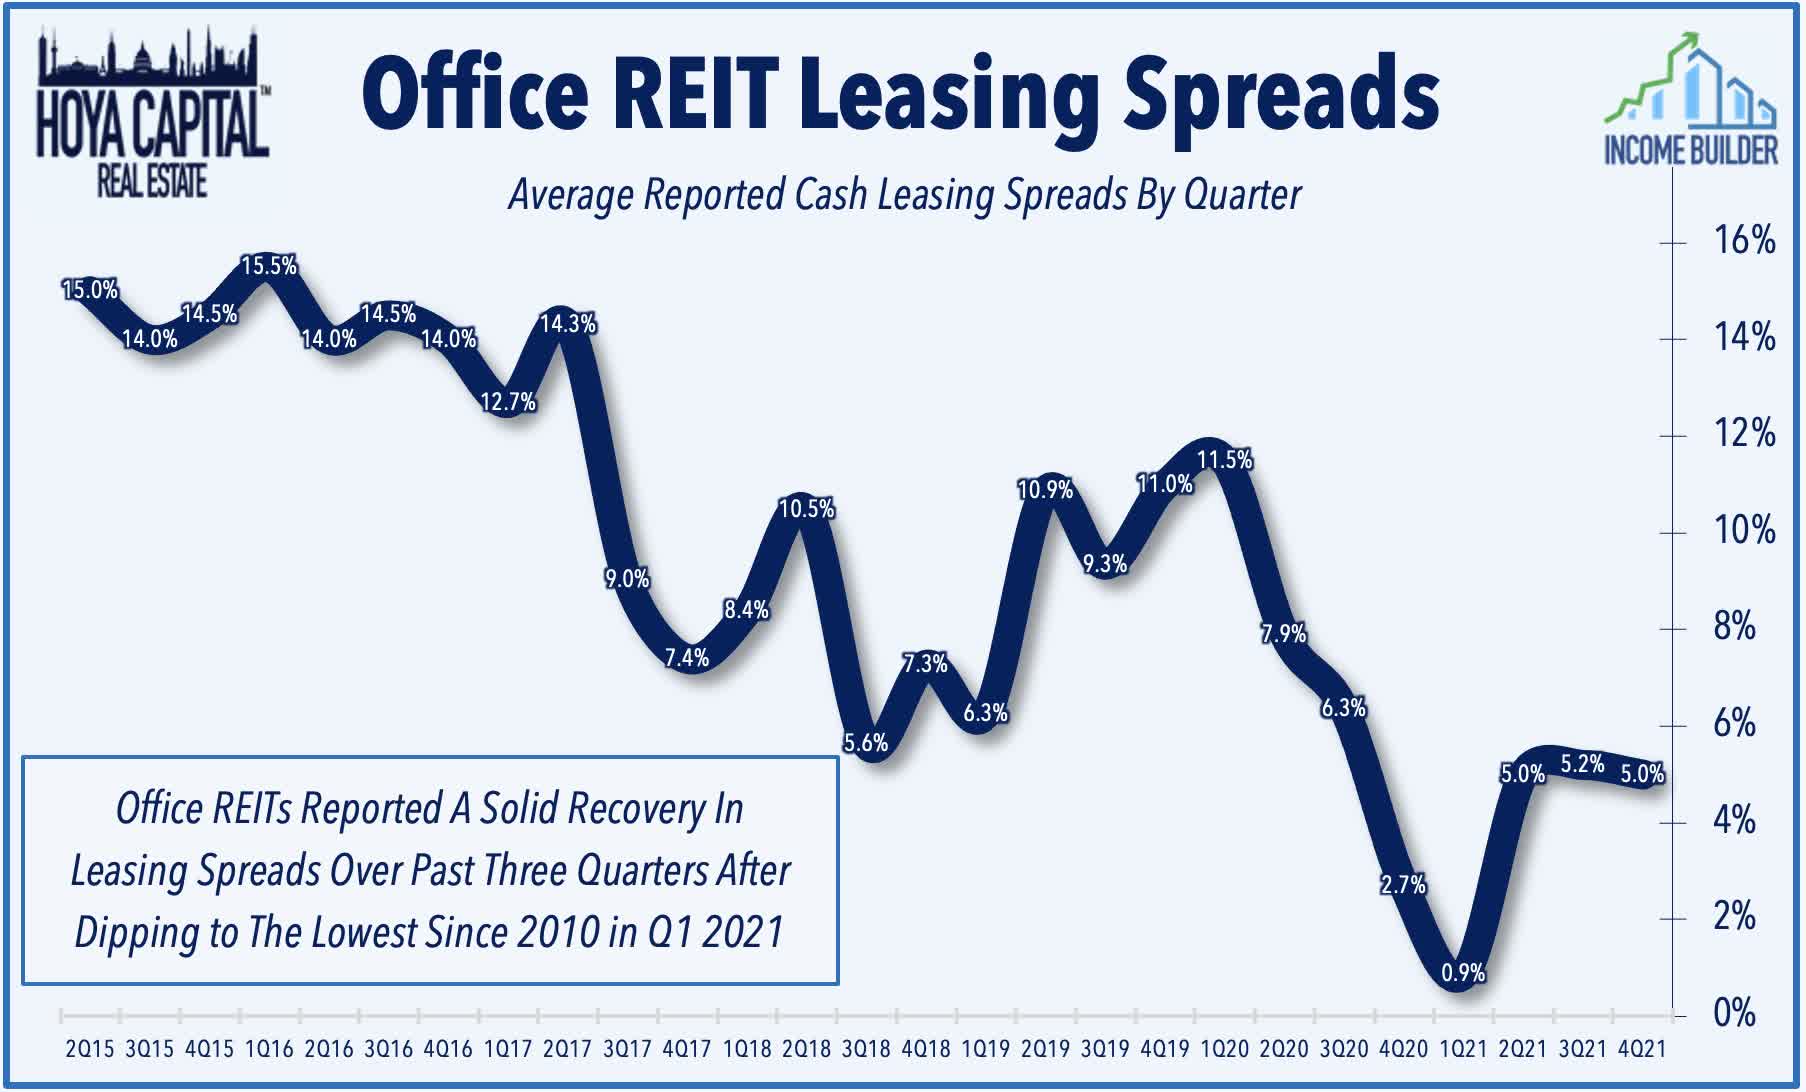
Office REIT occupancy nationwide is still below 50%, but Office leasing spreads have begun bouncing back, averaging about 5% for each of the past 3 quarters.
Kastle Hoya Capital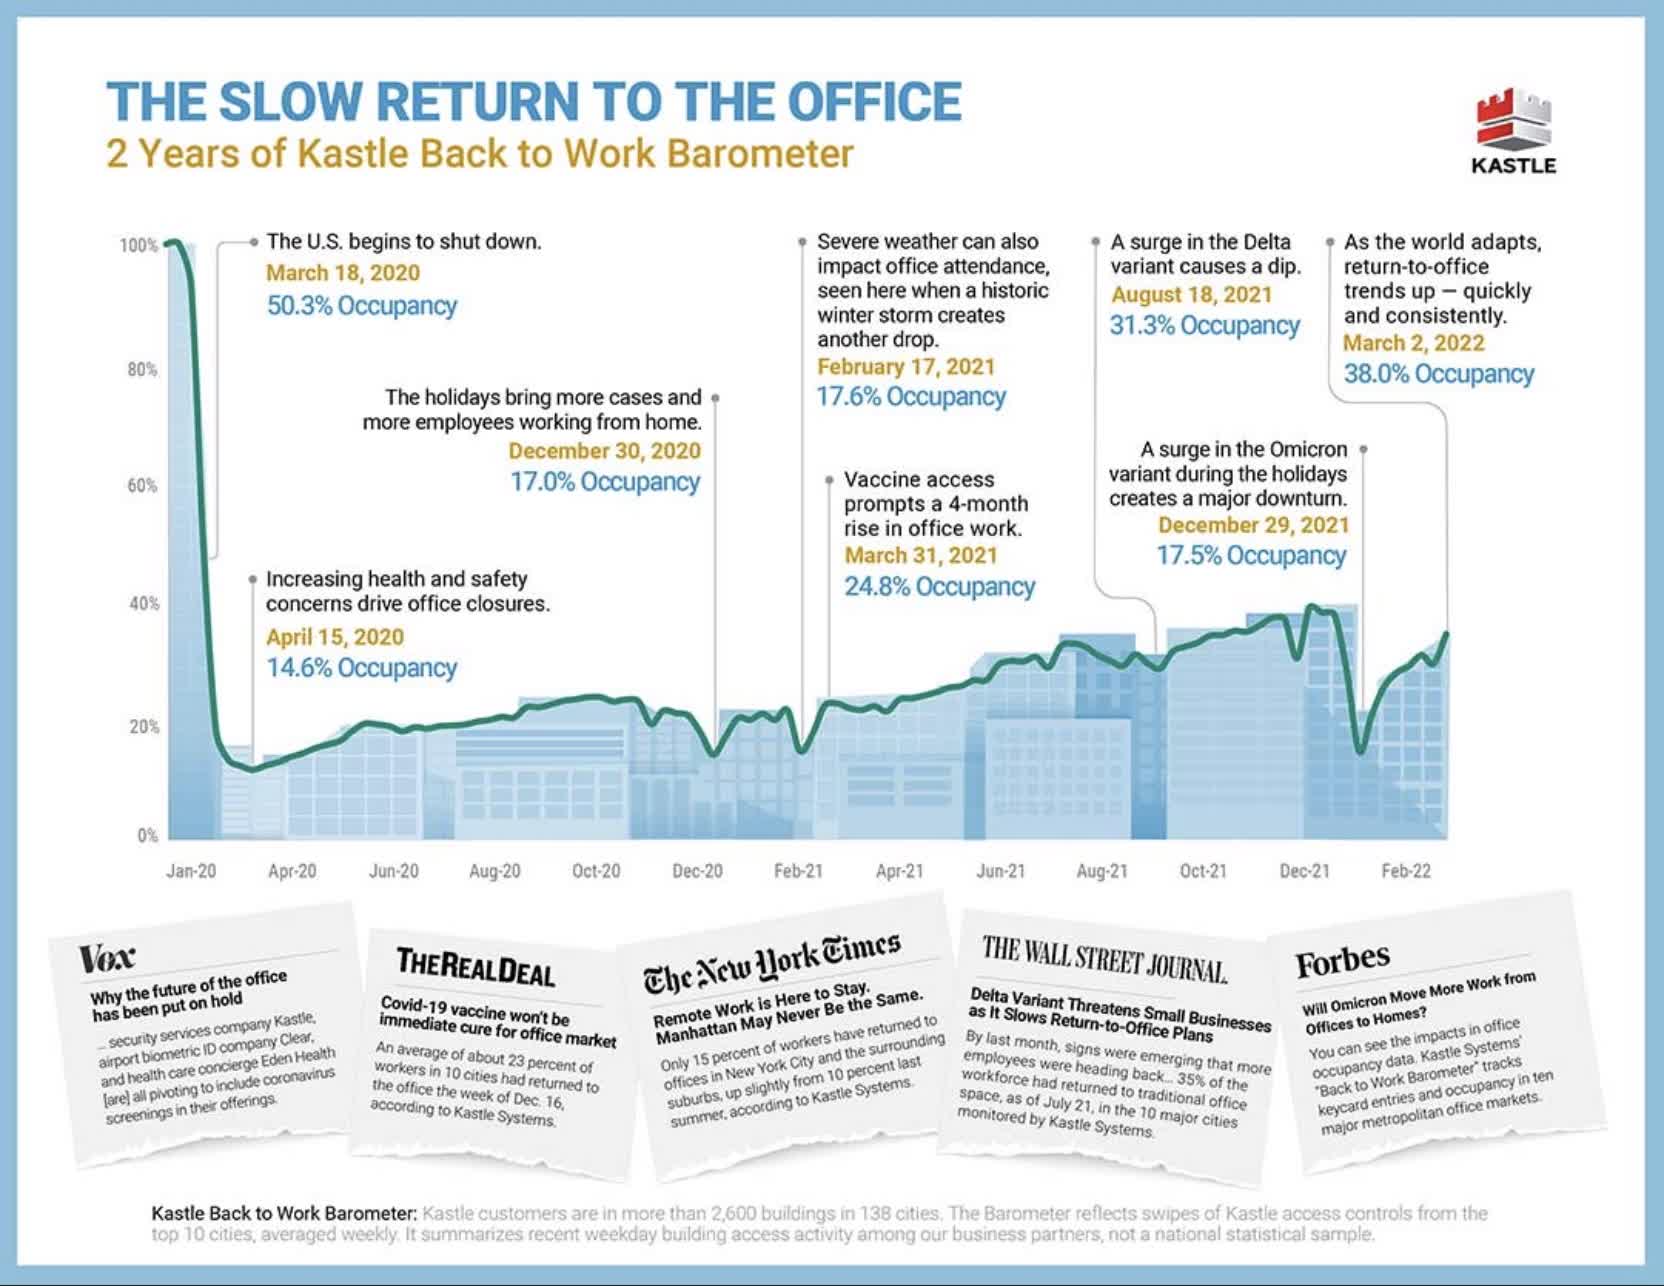
There are no solid growth plays in Office REITs at the moment. However it’s a good time to look for healthy Office COWs (Cash Only Wanted).
Office REITs with assets concentrated in the Sunbelt are benefitting from a significant demographic shift in the U.S. population. Large numbers of Americans left crowded coastal and urban areas in 2020 and 2021, relocating to secondary markets in the Sunbelt.
Hoya Capital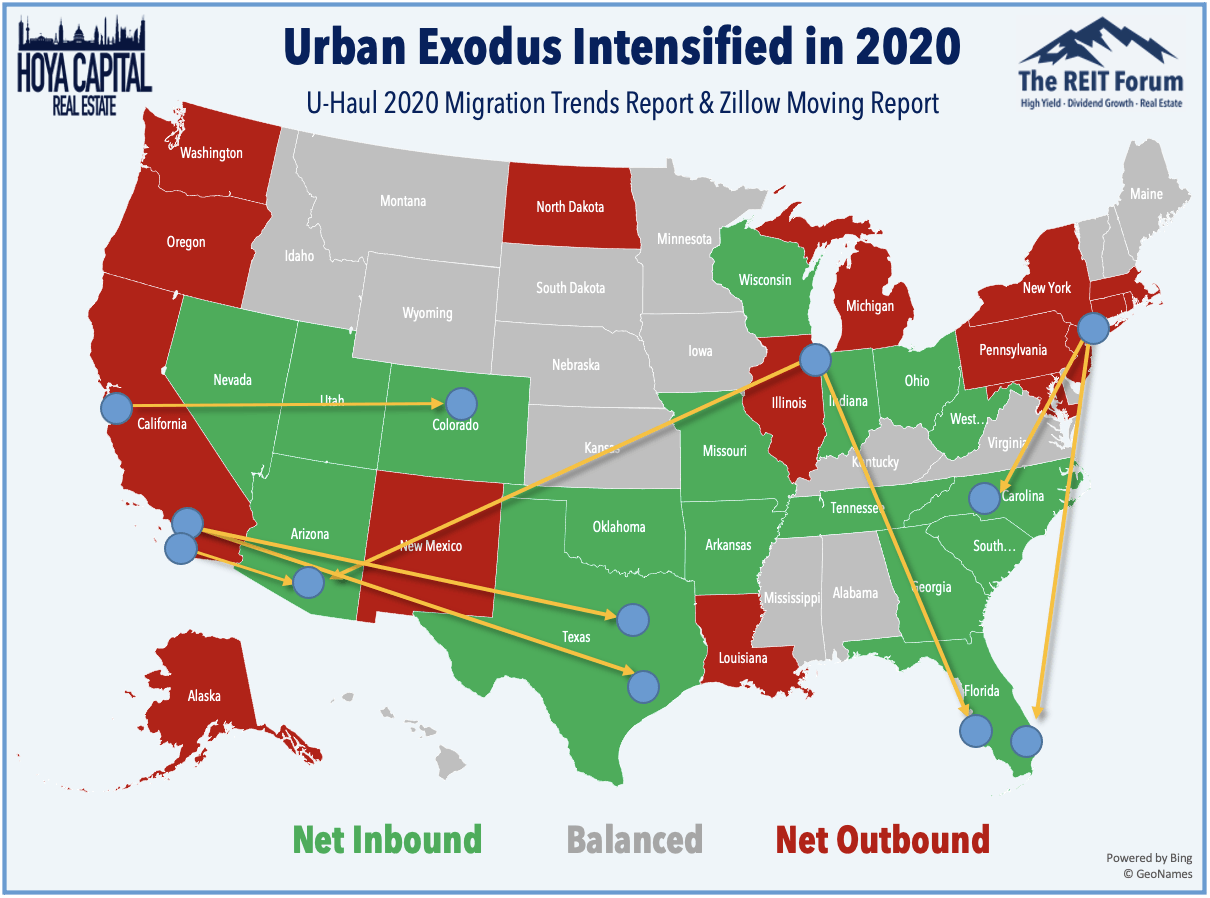
According to Hoya,
Office leasing demand – and earnings results from these office REITs – have been surprisingly resilient, however, particularly for REITs focused on business-friendly Sunbelt regions
Sunbelt-focused Highwoods Properties (NYSE:HIW) is arguably the best buy in Office REITs right now. According to Hoya, HIW grew its FFO/share by a cumulative 16% in the two pandemic years of 2020 and 2021, which was the strongest performance in the office sector. Highwoods also has posted the best trailing five-year total returns in the Office sector.
Meet the company
Highwoods Properties
Headquartered in Raleigh, North Carolina, and founded in 1978, this 44-year-old REIT owns and manages over 25 million square feet of office buildings in high-dollar business districts, primarily in the Southeastern U.S., including Raleigh, Atlanta, Nashville, Charlotte, Orlando, Pittsburgh, Richmond, and Tampa.
Highwoods Properties investor presentation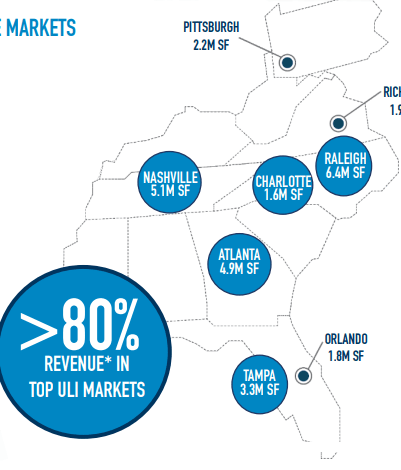
The four markets in which HIW has the most square footage were recently named among the top 8 real estate markets for 2022 by The Urban Land Institute.
Highwoods Properties investor presentation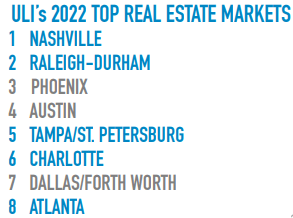
Over the past year, 5 of HIW’s markets ranked in the top 10 nationwide for growth in office-using employment. Six of them also ranked in the top 10 for net absorption, while the U.S. average was below zero at (-0.7%). The supply-demand picture has turned in favor of these markets.
Highwoods Properties investor presentation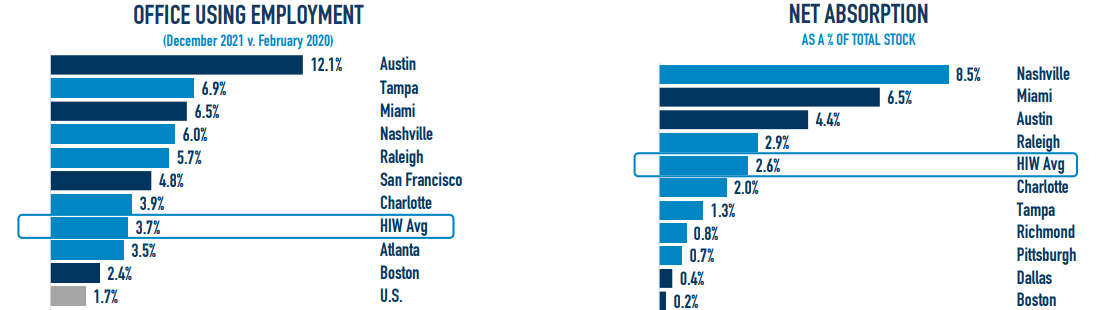
The company’s tenant base is well-diversified, with the top 20 tenants accounting for less than 30% of annual base rent, and the top tenant (the federal government) accounting for only about 4%.
Highwoods Properties 10-K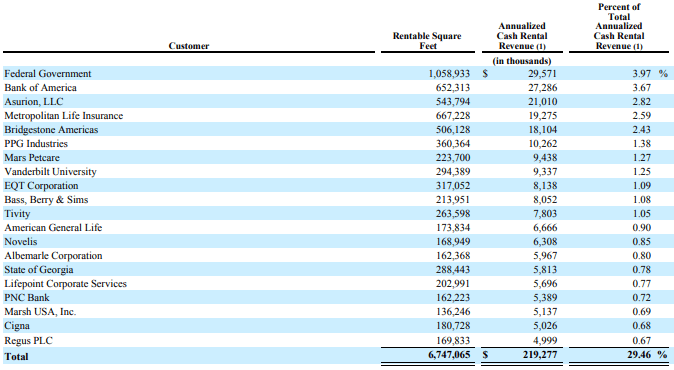
Same-store NOI grew impressively in 2020 and 2021, bouncing back from the pandemic, but is expected to moderate this year due to higher-than-usual operating expenses.
Highwoods Properties investor presentation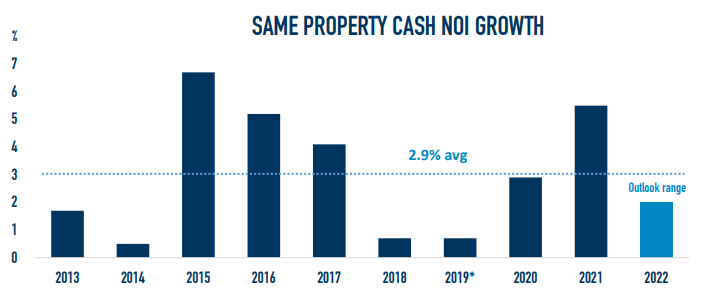
New leasing has returned to pre-pandemic levels across the HIW portfolio.
Highwoods Properties investor presentation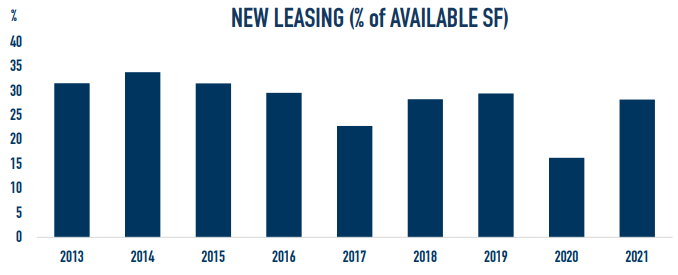
Year-end portfolio occupancy was 91%, almost matching pre-pandemic levels.
Highwoods Properties investor presentation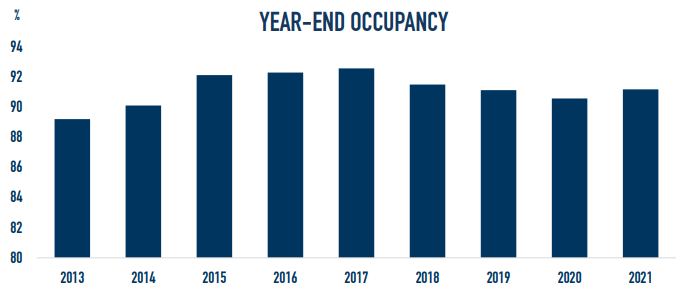
According to CEO Ted Klinck on February’s earnings call,
competition for high quality properties in our markets’ BBDs has continued to increase since the beginning of the pandemic. Institutional investors, both foreign and domestic, recognize the excellent long-term value of assets located in the best submarkets across our footprint.
Since the beginning of 2019, Highwoods has acquired 3.1 million square feet of space at a total cost of $1.3 billion, and put 1.4 million square feet of new development into use, at a total cost of nearly $600 million. Dispositions properties have outstripped acquisitions and development combined, as the company sold 6.7 million square feet assets for $1 billion.
The pace of acquisition slowed in 2021, as HIW acquired $800 million of office buildings in Raleigh and Charlotte, and completed $356 million of new development, which was 92% leased by year’s end. The company also acquired about $100 million worth of land for future development in three markets, and sold $385 million of non-core properties. Building had not yet begun on $174 million of new development that was already 36% pre-leased.
Full year FFO/share for 2021 came in at $3.76, beating the top end of October’s guidance by a penny. Rent spreads were a positive 3.2% on a cash basis and 11.6% on a GAAP basis. Year-end occupancy for the total portfolio was 91%.
The company reports a $283 million development pipeline that is 51% pre-leased, and a land bank that can support $2.3 billion of future office development , and another $2 billion of adjacent mixed-use projects.
Growth metrics
Highwoods Properties is proud of its consistent 3.9% FFO (funds from operations) growth rate over the past 12 years, in spite of the pandemic. This is steady plodding, characteristic of a mature COW.
Let’s look at the 3-year growth rates.
| Metric | 2018 | 2019 | 2020 | 2021 | 3-year CAGR |
| FFO (millions) | $366 | $355 | $382 | $413 | — |
| FFO Growth % | — | (-3.0%) | 7.6% | 8.1% | 4.11% |
| TCFO (millions) | $359 | $366 | $358 | $415 | — |
| TCFO Growth % | — | 1.9% | (-2.2%) | 15.9% | 4.95% |
| Market Cap (billions) | $4.0 | $5.07 | $4.11 | $4.65 | — |
| Market Cap Growth % | — | 26.8% | (-19.0%) | 13.1% | 5.15% |
Source: TD Ameritrade, CompaniesMarketCap.com and author’s calculations
These are not spectacular numbers, but they are solid, particularly in light of the pandemic, which affected the share price far more than it affected the company’s earnings.
Balance sheet metrics
Highwoods has an investment grade balance sheet that is one of the strongest in the Office sector. The company’s Debt/EBITDA is especially strong at 5.6. Here are the key metrics.
| Company | Liquidity Ratio | Debt Ratio | Debt/EBITDA | Bond Rating |
| HIW | 1.77 | 37% | 5.6 | BBB/Baa2 |
Source: Hoya Capital Income Builder, TD Ameritrade, and author’s calculations
The weighted average interest rate of the company’s debt is 3.73%, and there are no maturities at all in 2024 and 2025. Seven years down the road in 2029, HIW faces $500 million in debt payments at 4.12%
Highwoods Properties investor presentation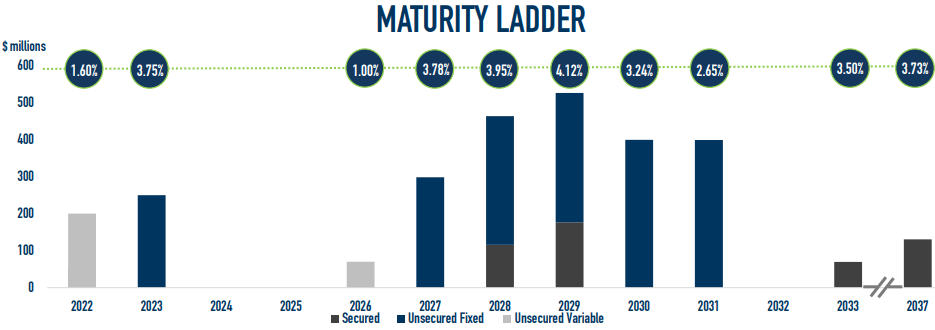
Dividend metrics
Highwoods is a strong dividend payer, as the metrics below indicate.
| Company | Div. Yield | Div. Growth | Div. Score | Payout (FWD) | Div. Safety |
| HIW | 4.63% | 2.63% | 5.03 | 50% | B+ |
Source: Hoya Capital Income Builder, Seeking Alpha Premium, and author’s calculations
Although the company’s dividend growth rate is slow, it’s current Yield is already so high that its Dividend Score is an outstanding 5.03. (Dividend Score projects the Yield 3 years from now, on shares bought today, given the current dividend growth rate.) If anything the dividend is a little too safe, at B+.
Valuation metrics
It should be clear by now that HIW is a value play, rather than a growth investment. That being the case, the Price/FFO ratio becomes very important.
| Company | Div. Yield | Div. Growth | Div. Score | Price/FFO | Premium to NAV |
| HIW | 4.63% | 2.63% | 5.03 | 11.1 | (-17.3)% |
Source: Hoya Capital Income Builder and author’s calculations
Highwoods appears bargain-priced at just 11.1x FFO, and a whopping 17.3% discount to NAV. This is a value investor’s dream come true.
What could go wrong?
For one thing, we are not necessarily out of the pandemic woods yet. The BA.2 variant is just the latest in a seemingly never-ending series of mutations, and is said to be more contagious than Omicron.
The work-from-home trend ignited by the pandemic is here to stay. Skilled workers are willing to sacrifice up to 10% in salary, in exchange for the convenience of working from home at least a couple of days a week. With a tight labor market, employees are likely to get their way on this, for the foreseeable future.
The office REIT sector is pretty crowded, with 24 companies. Some winnowing out may take place over the next couple of years, but until it does, competition for leases is considerable.
Investor’s bottom line
Highwoods has adapted to market conditions in an impressive way, and weathered the pandemic, primarily by judiciously selling off its less attractive assets, and burrowing into a nice, profitable niche in the SunBelt. As a FROG hunter (interested in Fast Rate of Growth REITs), I see this company as a Hold.
However, if you are mostly (or only) interested in getting a safe and much-higher-than-average dividend yield, this company is a safe bet, and near-term growth in the share price is hardly out of the question.
Seeking Alpha Premium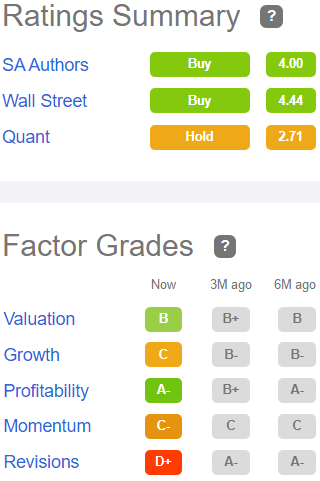
The Seeking Alpha Quant Ratings also show HIW as a Hold, but the authors and Wall Street analysts tracked by Seeking Alpha rate it a Buy, and so do TipRanks and The Street. Ford Equity Research and Zacks both rate it Hold, but Morgan Stanley rates it Overweight with a price target of $48, implying 11.6% upside. Baird and Jeffries upgraded it a month ago to Outperform and Buy, respectively, with respective price targets of $53 and $54, implying about 23% upside. So as usual, it’s anybody’s guess.
Be the first to comment