

Over the past month, the ProShares Ultra VIX Short-Term Futures ETF (UVXY) has seen an erosion in return with shares falling by 16% as the VIX reverts towards the mean. In this piece, I make the case that while the VIX has fallen by a fair bit, there’s still more downside in store for UVXY.
Volatility Markets
This year has been one for the record books in volatility markets as the VIX has witnessed one of its largest increases in history on the back of the S&P 500 collapsing.
While this move certainly has been incredible and only a few prior rallies come close to comparison, this doesn’t mean that we can’t study the VIX to generate a forecast of where it will likely head in the future. Specifically, I am firmly convinced that mean reversion principles strongly apply to volatility markets, which means that if we quantify and study movements in the VIX, we can use statistics to indicate where the VIX may be headed in the future.
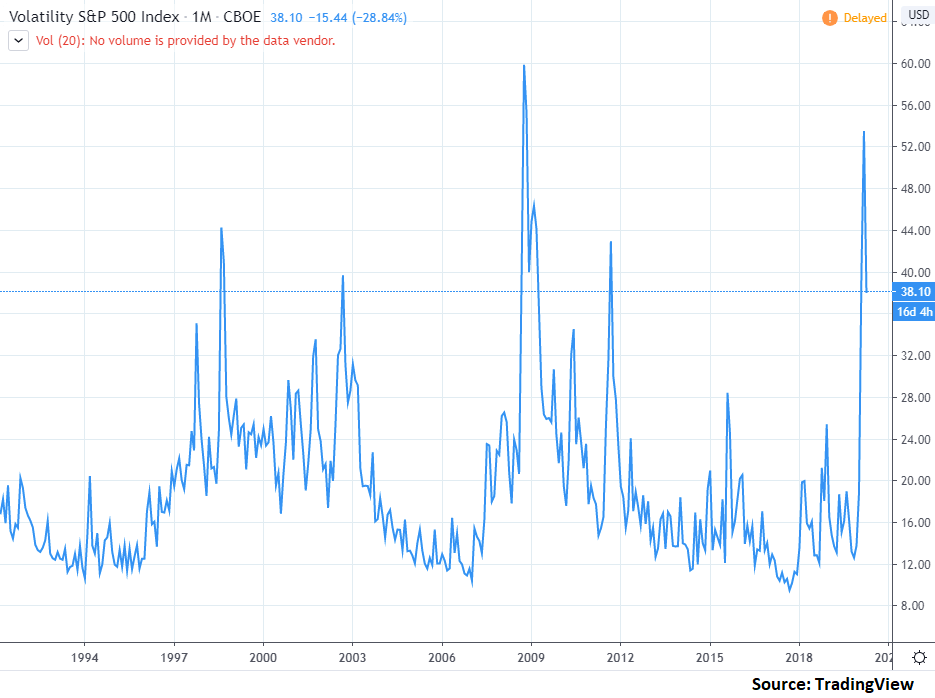
As an overarching theme in my VIX analysis, I rely heavily on the concept of mean reversion. To be honest, we don’t really need extensive quantitative analysis to make the case that the VIX mean reverts in that a simple glance at the history of the index shows that it generally stays around 15 and excursions beyond this point lead to above-average probabilities that the VIX will contract towards the mean.
 On this basis alone, we can have a general directional bias for trading the VIX at almost all times. If the VIX is hitting new highs or new lows, then there’s a very good chance that we’ll see the VIX start to trend in the direction contrary to the recent extreme.
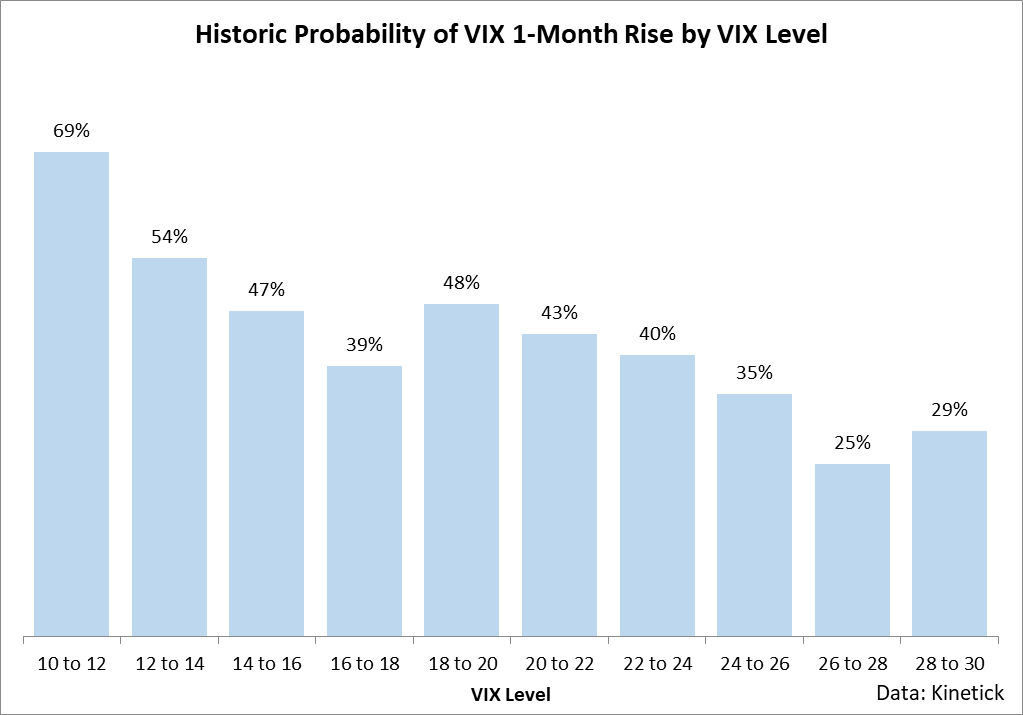
In the chart below, I have quantitatively studied this using a simple test of the VIX hitting fresh 1-month highs or lows using 27 years of history for the index.
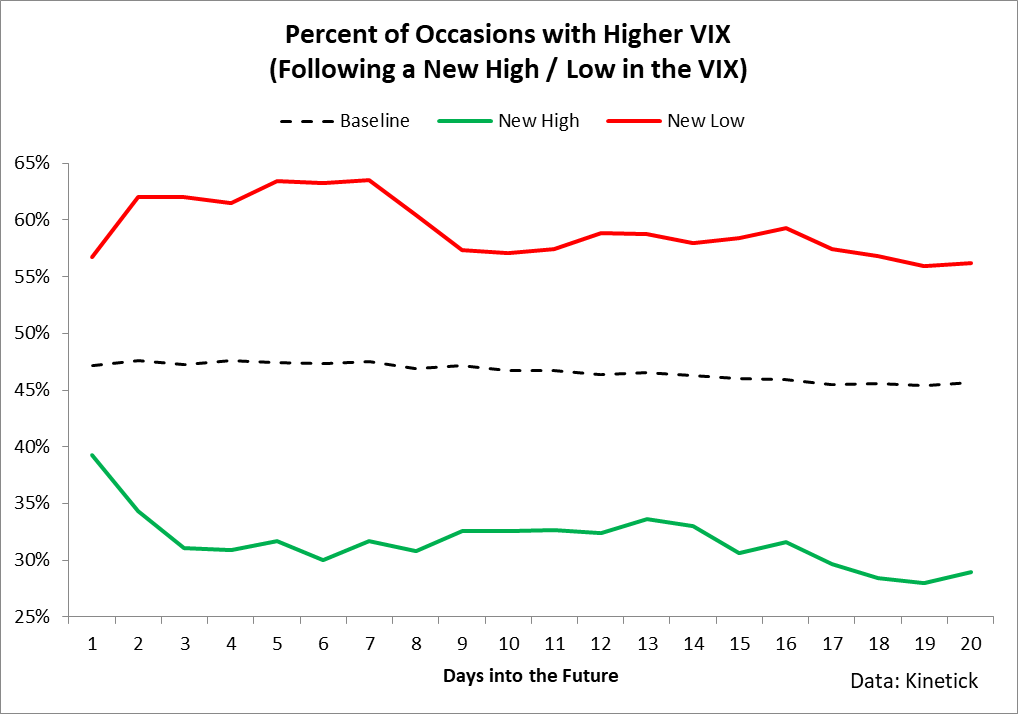
The conclusions are fairly straightforward: when the VIX hits a fresh 1-month high, history would indicate that there’s about a 70% chance that the VIX will decline over the next month.
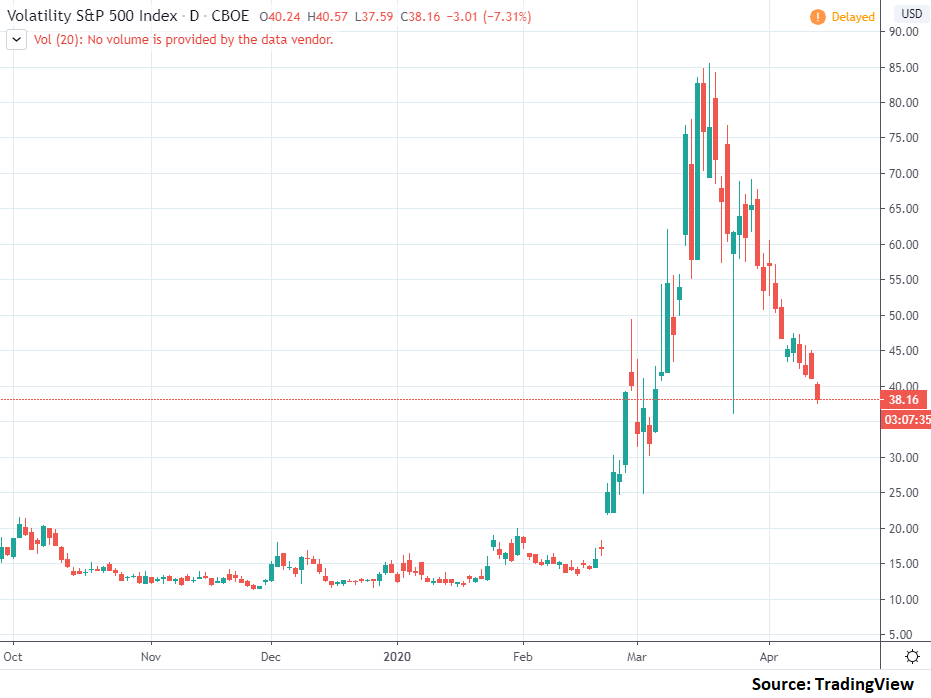
It is important to note that at present, this metric isn’t really telling us anything beyond simply explaining the current downdraft in the VIX. During March, we witnessed the VIX rally to historical highs and throughout April we have seen the VIX drop in line with historical tendencies.
 However, there are still other factors directly related to the VIX itself, which are giving a signal that additional bearishness can be expected in the index.
First off, we can look at the outright level of the VIX as a predictive measure. As a prior chart indicated, the VIX tends to stay around 15 or so and excursions beyond this tend to mean revert. As you can see in this chart, the probability that mean reversion occurs is directly proportional to the extent to which the VIX moves beyond the mean.
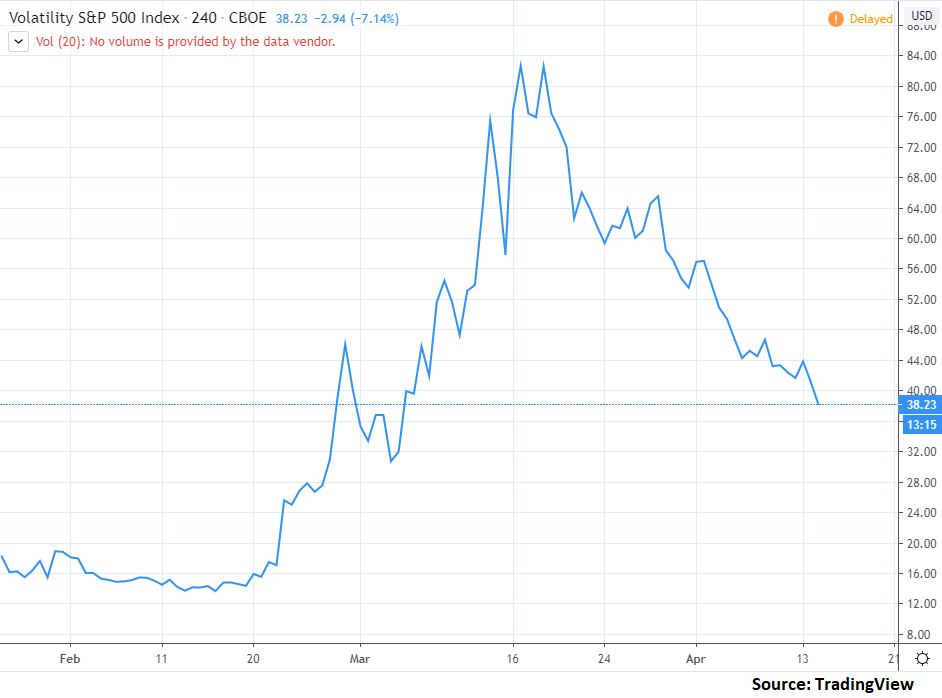
What the above chart means in today’s terms is that given that we are sitting at around 38 in today’s VIX level, market history indicates that there’s about a 70% chance that the VIX will decline over the next month. In other words, we can get an actionable directional trading signal straight from the outright level of the VIX and this signal is strongly indicating that the VIX is going to continue declining.
Not only is the outright level of the VIX indicative as per the probability of future movements in the index, but it is also heavily correlated with the magnitude of price movements.
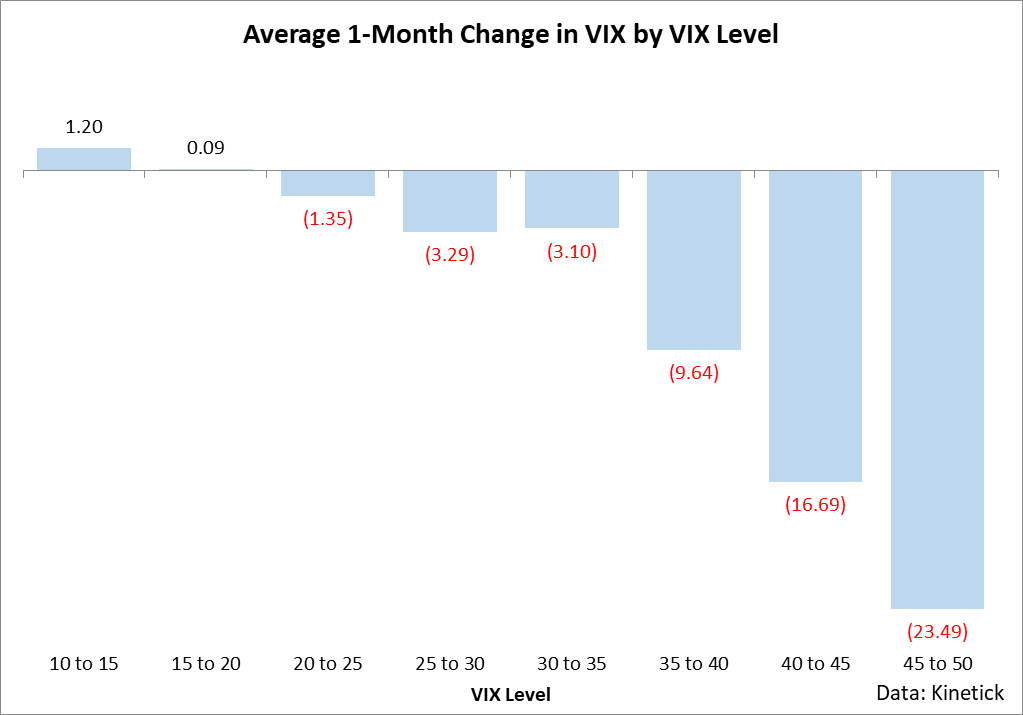
What the above chart basically shows is that the further the VIX is from the “normal” 15-20 range at any given point of time, the greater the historical changes in the VIX towards this 15-20 range. For example, given that the VIX is currently sitting in the 35-40 bucket, the last 27 years of data would indicate that we’re going to see a drop in the VIX of around 9-10 points over the next month. To put this into percentage terms, this would indicate that if the past is to be a rough guide to the future, then we can expect the VIX to fall by about 26% over the next month. For traders in UVXY, this equates to a potential loss of about 39% over the next month since it is an ETF which offers a 1.5x leveraged return of VIX futures.
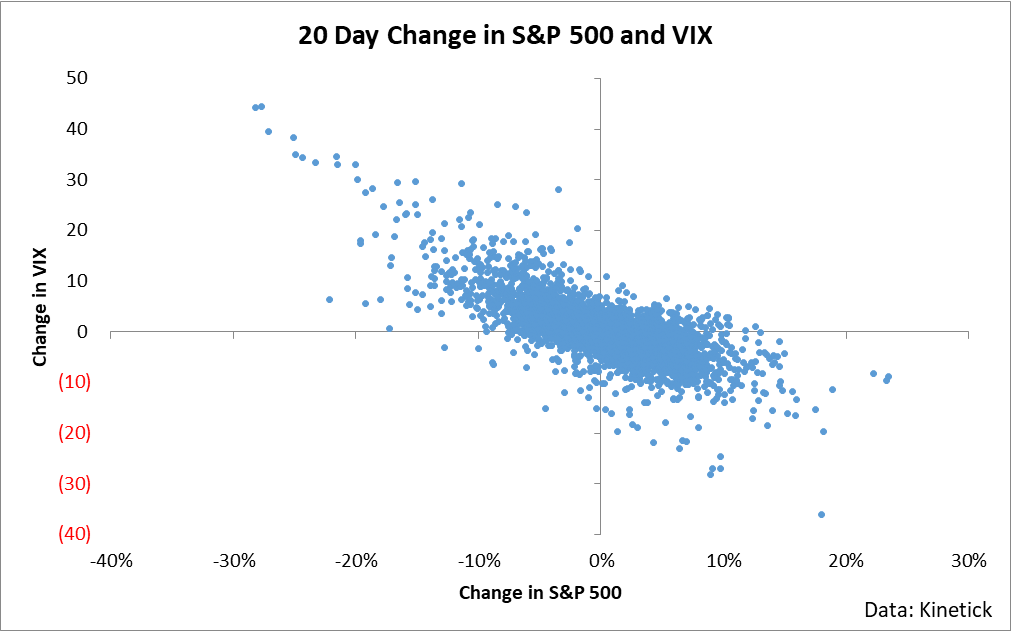
Volatility bulls very well make the case that since we are in a recession (in all likelihood), the market will continue to be bearish and therefore volatility will likely remain higher or increase. There is some validity to this argument in that there is a direct inverse correlation between the S&P 500 and the VIX. As the market falls, the VIX rises.
However, my counter-argument to this position is that if you study historical market crashes, in most extreme-VIX environments, the VIX actually peaks fairly early in a selloff.
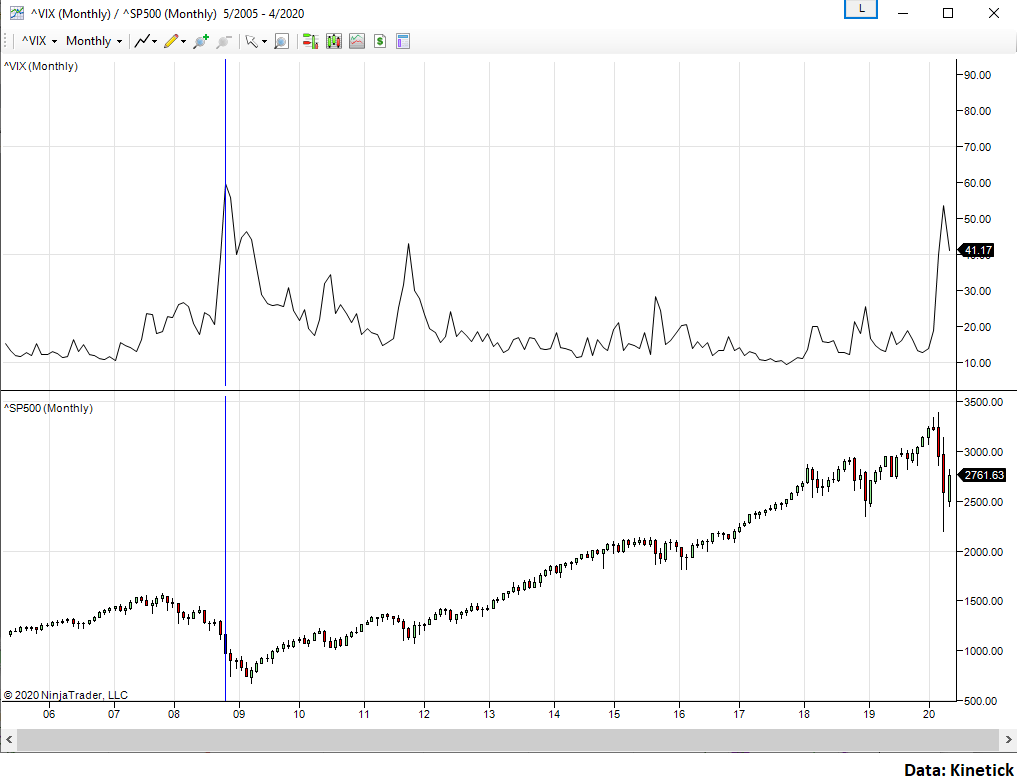
In the prior chart, I have marked the high point of the VIX rally during the 2008-2009 bear market. The important thing to note is that during this specific crisis, the VIX itself actually peaked 6 months or so before the market bottom and the market proceeded to fall by about 30% while volatility declined.
What this essentially means for the bear argument that the VIX is likely going to rally if we see the S&P 500 fall is that during crisis environments, this relationship might not play out as expected since the overall VIX level is elevated at the start of the selloff. In other words, even though the market may continue to fall, VIX bulls may ultimately lose money as the VIX continues to drift downwards since the “fear gauge” has likely already made its move.
Roll Yield
All of the prior analysis is in regards to changes in the VIX itself. But there’s an important issue to consider when you trade an instrument like UVXY: it’s not actually tracking the VIX. It’s tracking VIX futures. And the long-term performance of instruments which track VIX futures is highly dependent upon roll yield to explain returns.
I’ve covered this in-depth in my previous articles (recent one here), so I won’t belabor the point too much. I tend to get excited about this topic and can end up doubling the length of an article when I start talking about it, so I’ll try and explain this in a few short paragraphs.
The basic problem when it comes to systematically investing in futures over lengthy periods of time is that they have an expiration date and you must roll out of a position prior to expiry. There have been a variety of strategies created around this specific issue (shifting rolling dates, changing contracts held, looking at structure to manage holdings, etc.) but the basic problem of needing to roll futures contracts remains.
UVXY follows a strategy which is constantly selling a piece of its exposure every day out of the front-month VIX futures contract and buying into the second-month futures contract. It does this in perpetuity. This specific methodology used is the S&P 500 VIX Short-Term Futures Index.
The basic problem here and why I have an entire section devoted to writing about this is that futures gradually move towards the spot price, resulting in something called “roll yield.” What this tangibly means is that during a given month, there’s a difference between the futures contracts which UVXY is holding and the spot level of the VIX itself. And over a given month, this difference gradually erodes. Here is a chart of the average level of these two futures contracts which UVXY trades in and out of as well as the level of the VIX by the number of trading days into a given month.
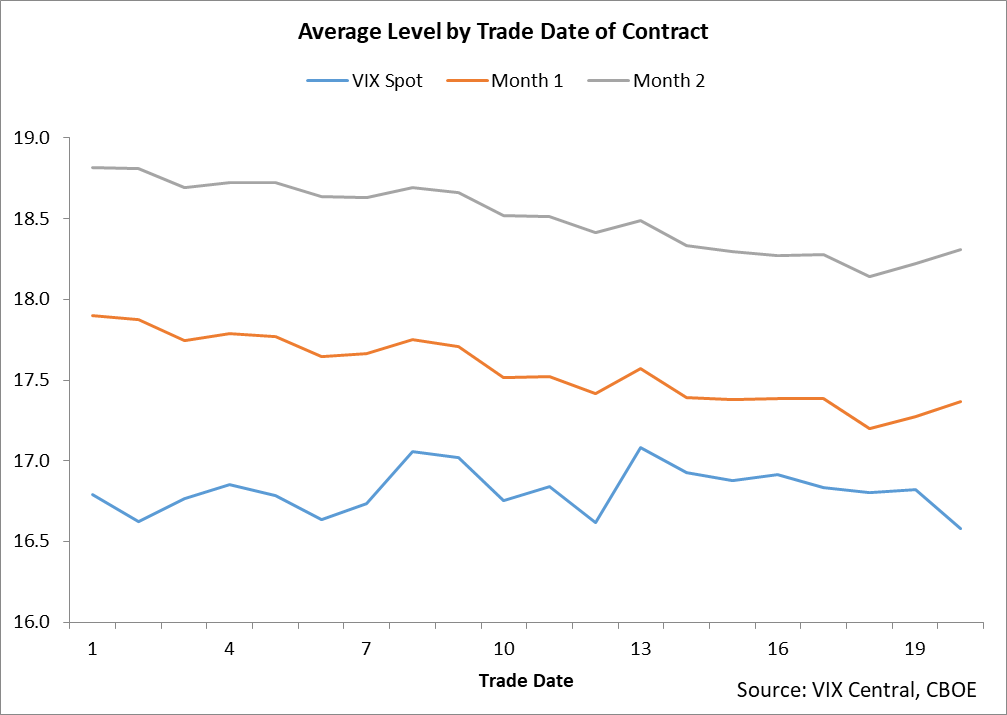
If you notice, there’s a clear trend – the VIX basically goes nowhere (remember, mean reversion is key) during a typical month but the futures contracts start out above the VIX and decline in value throughout the remainder of the month.
And that is the huge problem with investing in UVXY over long periods of time. You’re holding futures contracts which are typically priced above the spot level of the VIX, and this premium over the spot price tends to disappear through time. Since the VIX largely goes nowhere over long periods of time, this means that roll yield explains most of the story when it comes to tracking UVXY.
For example, here are the 10-year returns of the index upon which UVXY provides a 1.5x return.
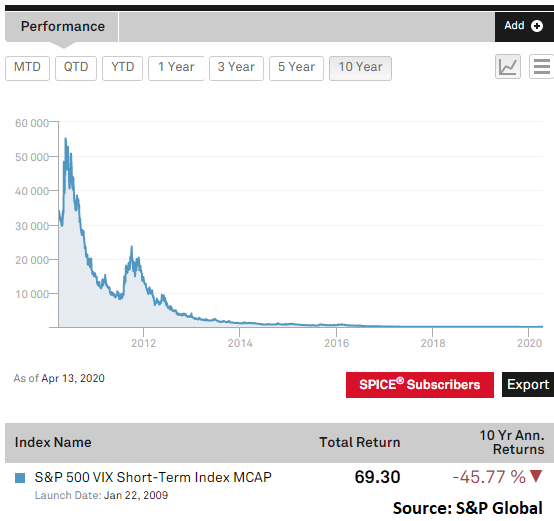
What this chart tangibly shows is that an investment in the index which UVXY leverages has declined at an annualized rate of around half per year for the last decade. There’s no point doing the compounding to make the case that over the long run, this index destroys the wealth of the long crowd.
For this key reason (roll yield), I am short UVXY in the form of put options out along the curve. My core positions in 2022 puts because the forces of roll yield truly come into play over lengthy periods of time. For investors looking to trade UVXY to the downside to capture both the high likelihood of VIX declines as well as long-term losses from roll yield, I would suggest put positions which are at minimum several months out along the curve.
Conclusion
The VIX is highly mean reverting, meaning that since we have recently seen a pop, the odds strongly favor further declines from this point. The outright level of the VIX contains a predictive edge – at present, the odds favor more downside. Roll yield explains the long-term returns of UVXY and as the market normalizes, more downside can be expected.
Disclosure: I am/we are short UVXY. I wrote this article myself, and it expresses my own opinions. I am not receiving compensation for it (other than from Seeking Alpha). I have no business relationship with any company whose stock is mentioned in this article.
Be the first to comment