

grandriver/iStock via Getty Images
Introduction
The Tulsa, Oklahoma-based Helmerich & Payne, Inc. (NYSE:HP) released its fiscal third-quarter 2022 results on July 27, 2022.
This article is an update of my preceding article published on May 3, 2022. I have followed HP on Seeking Alpha since September 2014.
Note: I recommend reading my new article on Nabors Industries (NBR), published on September 6, 2022, first by clicking here.
1 – Fiscal 3Q22 Results Snapshot
Helmerich & Payne, Inc. announced a fiscal third-quarter 2022 net income of $17.75 million, or $0.16 per diluted share, compared to a loss of $0.52 per diluted share in the same quarter a year ago. This quarter, revenues were $550.23 million, up significantly from $332.21 million last year.
Revenues increased due primarily to an increase in average rig count. Also, reactivation costs decreased to $6.5 million compared to $14.2 million in the prior quarter.
The total segment per day expenses, excluding reconditioning costs and excluding reimbursable, decreased to 15,490 per day in the third quarter. Net cash provided by operating activities was $97.75 million for the third quarter of the fiscal year 2022 compared to $22.61 million in the prior quarter.
H&P’s North America Solutions segment left the third quarter with 174 active rigs in June, up from 171 active rigs in fiscal 2Q.
HP Highlights (HP Presentation)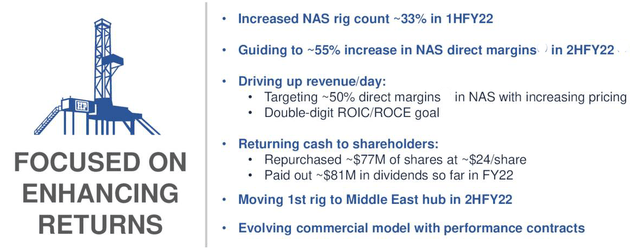
CFO Mark Smith indicated in the conference call:
[W]e averaged 174 contracted flex rigs during the third quarter up from an average of 164 flex rigs in fiscal Q2. We exited the third fiscal quarter with 175 contracted rigs which was in line with our previous guidance. We added four rigs to our active rig count in the third quarter, including three walking flex rig, drilling rig conversions that were completed in fiscal Q3.
HP Rig fleet (HP Presentation)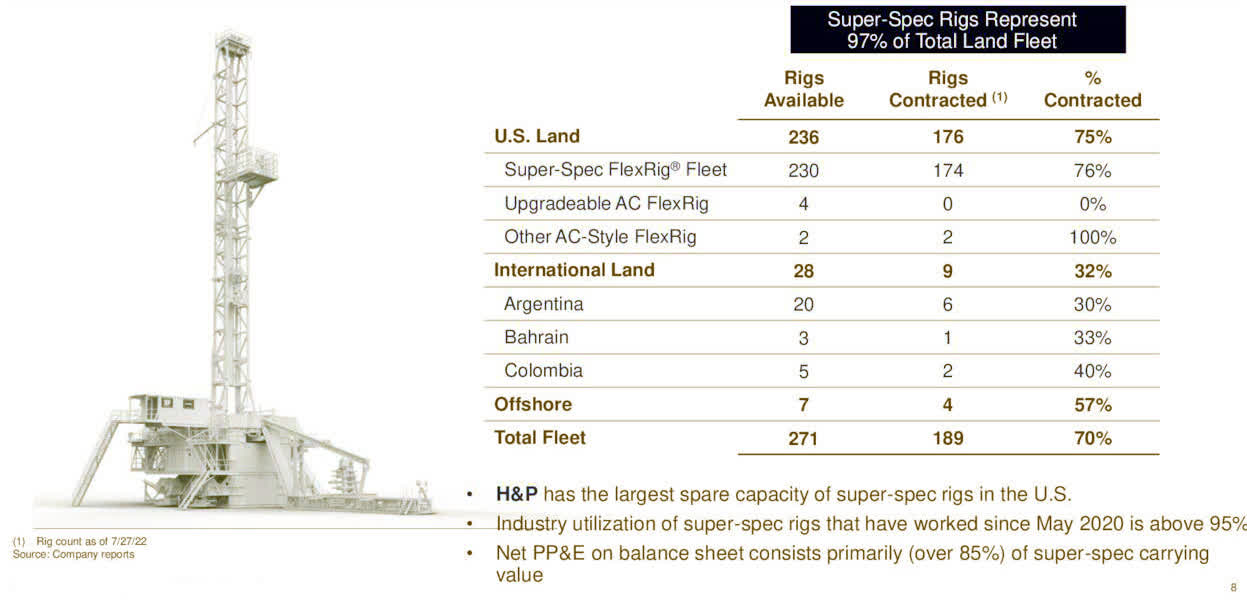
2 – Investment Thesis
Helmerich & Payne beat the analysts’ expectations this quarter, and it was a relief.
The situation is improving, but even so, progress is slow, and the balance sheet is still far from outstanding; we at least can see the light at the end of the tunnel. The usual net loss posted for the past several quarters turned positive this quarter, which is encouraging.
However, since the results were announced, oil prices have dropped significantly, and the risk of recession by the end of 2022 is weighing heavily on the stock price. The FED is expected to hike by 75-point on September 21, and a few market observers believe it could be even a 100-point after the CPI numbers just came in above the consensus at 8.3%.
However, with oil prices reaching a record high and the urgent need to drill the onshore U.S., I believe H&P is a solid long-term investment that should provide some good upside while paying a quarterly dividend of $0.25 per share. H&P’s capital structure is one of the best compared to its three main competitors.
H&P is tightly associated with oil and gas prices and easily could be the first stock to drop if oil prices fall below $85, a possible scenario based on a recession by the end of 2022.
Therefore, I suggest trading 50% LIFO of your long-term position to offset the unfavorable effects of the oil market that could arise suddenly and reduce the risk attached to this volatile sector.
As I always indicate in my public articles, this dual strategy is what I am guiding in my marketplace, forming the backbone of my Gold and Oil marketplace.
The company pays a quarterly dividend of $0.25 per share with a yield of 2.16%.
Investing in HP demands being well acquainted with the US onshore business. The U.S. Land rigs segment is the most significant revenue for the company and represents 88.3% of the total revenue.
HP Revenue per segment 2Q22 (Fun Trading)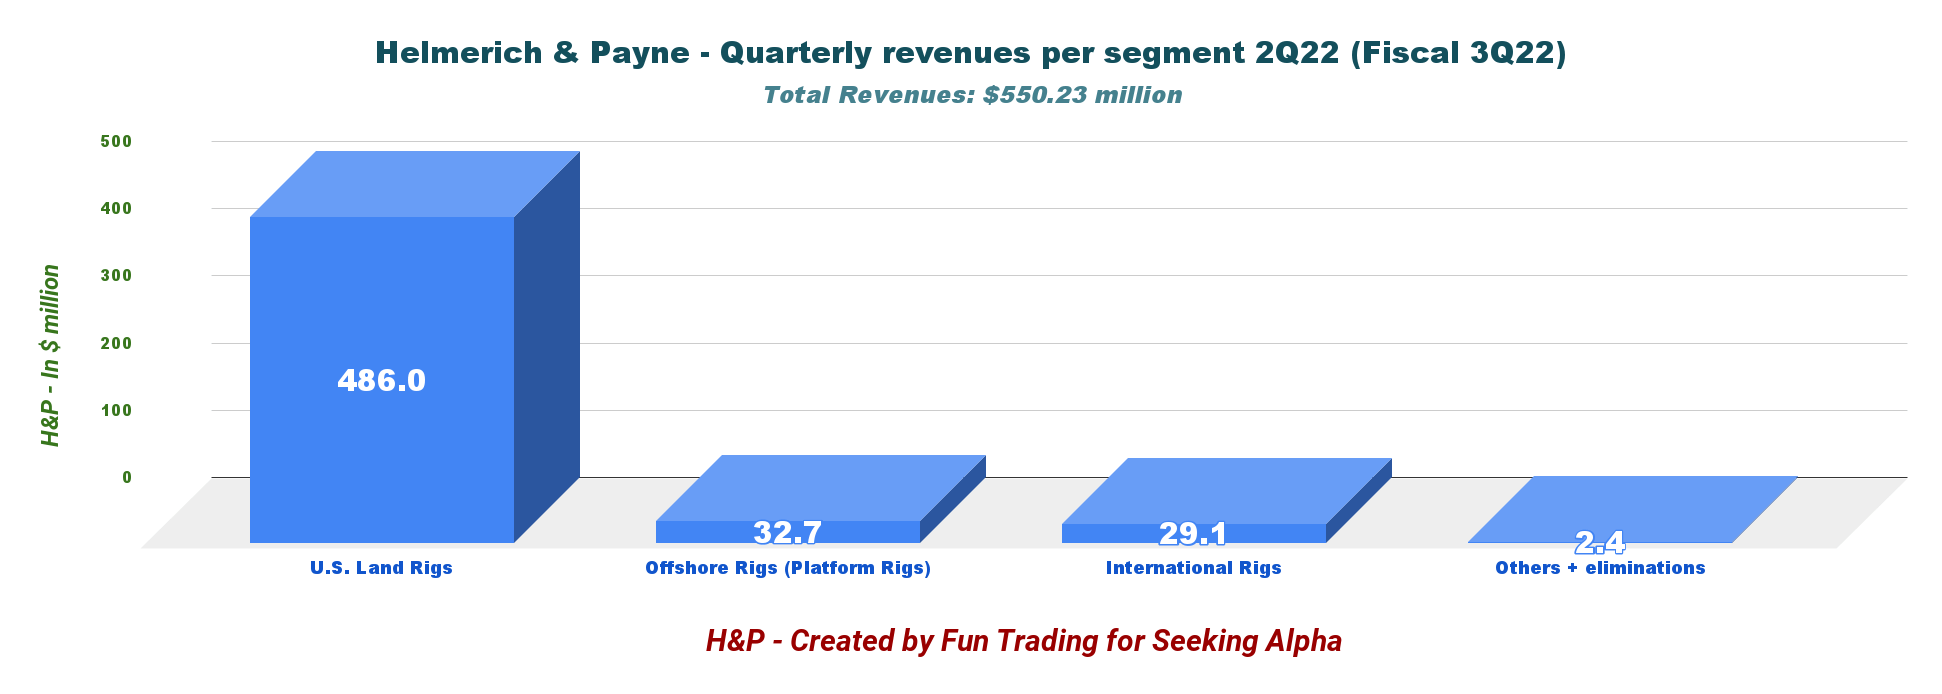
3 – Segment Discussion
3.1 – North America Solutions Segment
Operating revenues were $486.00 million, up 72.9% from last year due to higher activity levels and an average number of active rigs jumping from 119 to 174. Operating profits were $57.3 million ($43.7 million last year). The rising oil and gas prices significantly helped the segment.
3.2 – Offshore Gulf of Mexico Segment
The U.S. offshore had revenues of $32.70 million, or a decrease of 1.98% from the year-ago quarter’s figure of $33.4 million. Also, the segment’s operating profit rose by 2.9% from the prior-year period to $5.9 million.
3.3 – International Rigs Segment
The segment’s operations generated revenues of $29.118 million, up from $15.3 million in the corresponding 2021, due to improved activity levels and an increase in average number of active rigs from five to eight.
The segment reported a loss of $6.5 million due to higher expenses, but smaller than the loss of $3.5 million incurred last year.
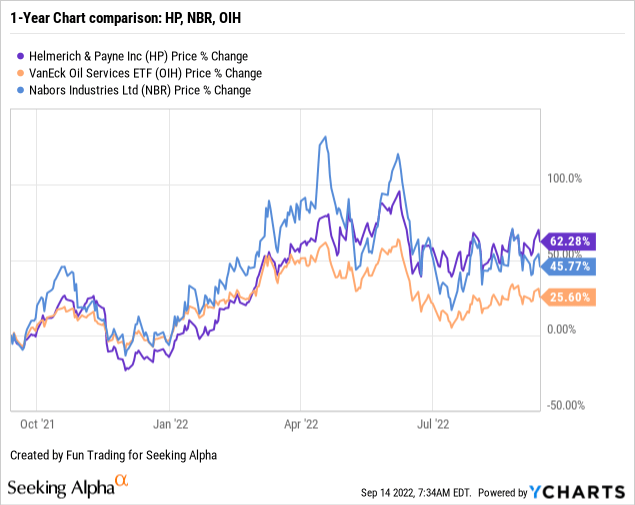
4 – Stock Performance
HP is up 62% on a 1-year basis, while Nabors Industries, its direct competitor, is up 46%. HP outperformed the VanEck Vectors Oil Services ETF (OIH).
CEO John Lindsay said in the conference call:
The operational and financial results continue to reflect the benefits of our strategic initiatives we’ve been working on for several years now. In particular, the efforts by our sales and operations teams to improve pricing and margin growth in our North America solutions segment. On our earnings call last February, and again in April, we discussed how rig pricing needed to reach $30,000 per day. And in our third fiscal quarter, we had roughly 20% of our fleet average revenue per day at or above that level.
Helmerich & Payne – Balance Sheet: 2Q22 (Fiscal Third-Quarter 2022) – The Raw Numbers
| Helmerich & Payne | 2Q21 (fiscal 3Q21) | 3Q21 (fiscal 4Q21) | 4Q21 (fiscal 1Q22) | 1Q22 (fiscal 2Q22) | 2Q22 (fiscal 3Q22) |
| Total Revenues in $ Million | 332.21 | 343.81 | 409.78 | 467.60 | 550.23 |
| Net income in $ Million | -55.56 | -79.16 | -51.36 | -4.98 | 17.75 |
| EBITDA in $ Million | 30.09 | 3.19 | 47.85 | 105.38 | 124.32 |
| EPS diluted in $/share | -0.52 | -0.74 | -0.48 | -0.05 | 0.16 |
| Operating cash flow in $ Million | 31.01 | 46.62 | -3.72 | 22.61 | 97.75 |
| CapEx in $ Million | 18.42 | 32.98 | 47.89 | 67.14 | 78.15 |
| Free Cash Flow in $ Million | 12.59 | 13.64 | -51.61 | -44.53 | 19.59 |
| Total cash in $ Million | 557.81 | 1,116.23 | 441.26 | 350.58 | 332.99 |
| Long-term debt in $ Million | 481.00 | 1,025.49 | 542.24 | 541.97 | 542.29 |
| Dividend per share in $ | 0.25 | 0.25 | 0.25 | 0.25 | 0.25 |
| Shares outstanding (Basic) in Million | 107.89 | 107.90 | 107.57 | 105.39 | 106.02 |
Data Source: Company release
* Estimated by Fun Trading
Financials And Balance Sheet Snapshot
1 – Revenues Were $550.23 Million In Fiscal 3Q22
HP Quarterly Revenues history (Fun Trading) Helmerich & Payne reported $550.23 million in the fiscal third quarter of 2022, up from $332.21 million in the same quarter a year ago and up 17.7% sequentially. HP posted an income of $0.16 per diluted share versus a loss of $0.05 in the previous quarter. We are finally in the green, which is an outstanding achievement. CFO Mark Smith said in the press release: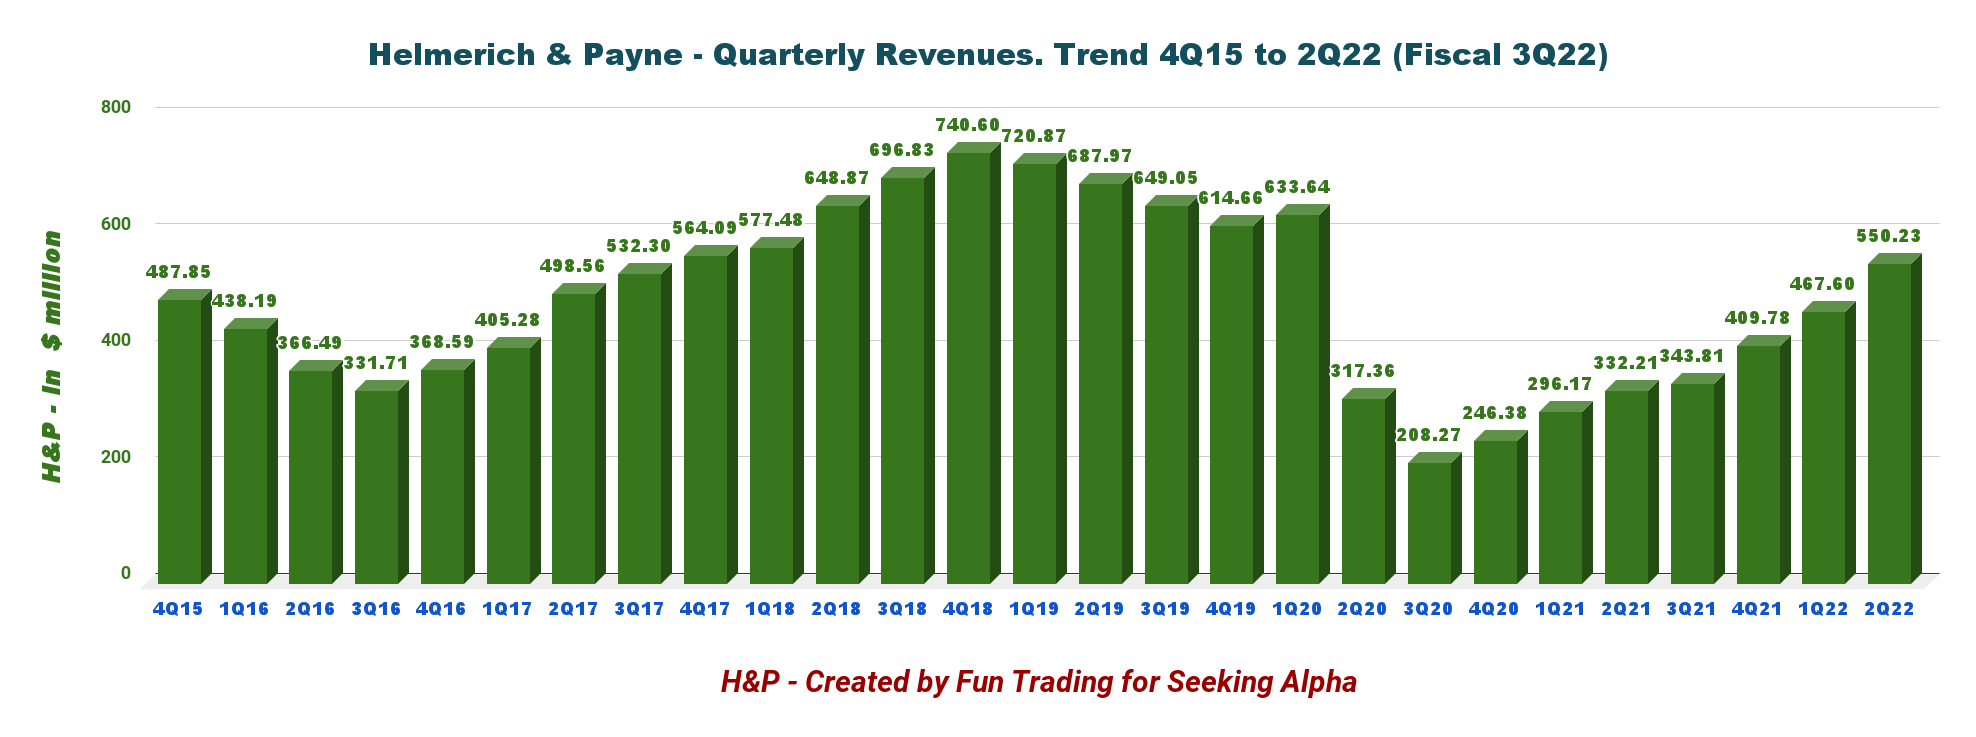
Our financial results reflect the margin expansion we are experiencing which is frankly needed to sustain our capital intensive and technologically demanding business in the long term. We anticipate further improvements in the coming quarters as our contracts in our North America Solutions segment continue to reprice at higher levels.
2 – Free Cash Flow Was $19.59 Million In Fiscal 3Q22
HP Quarterly Free cash flow history (Fun Trading)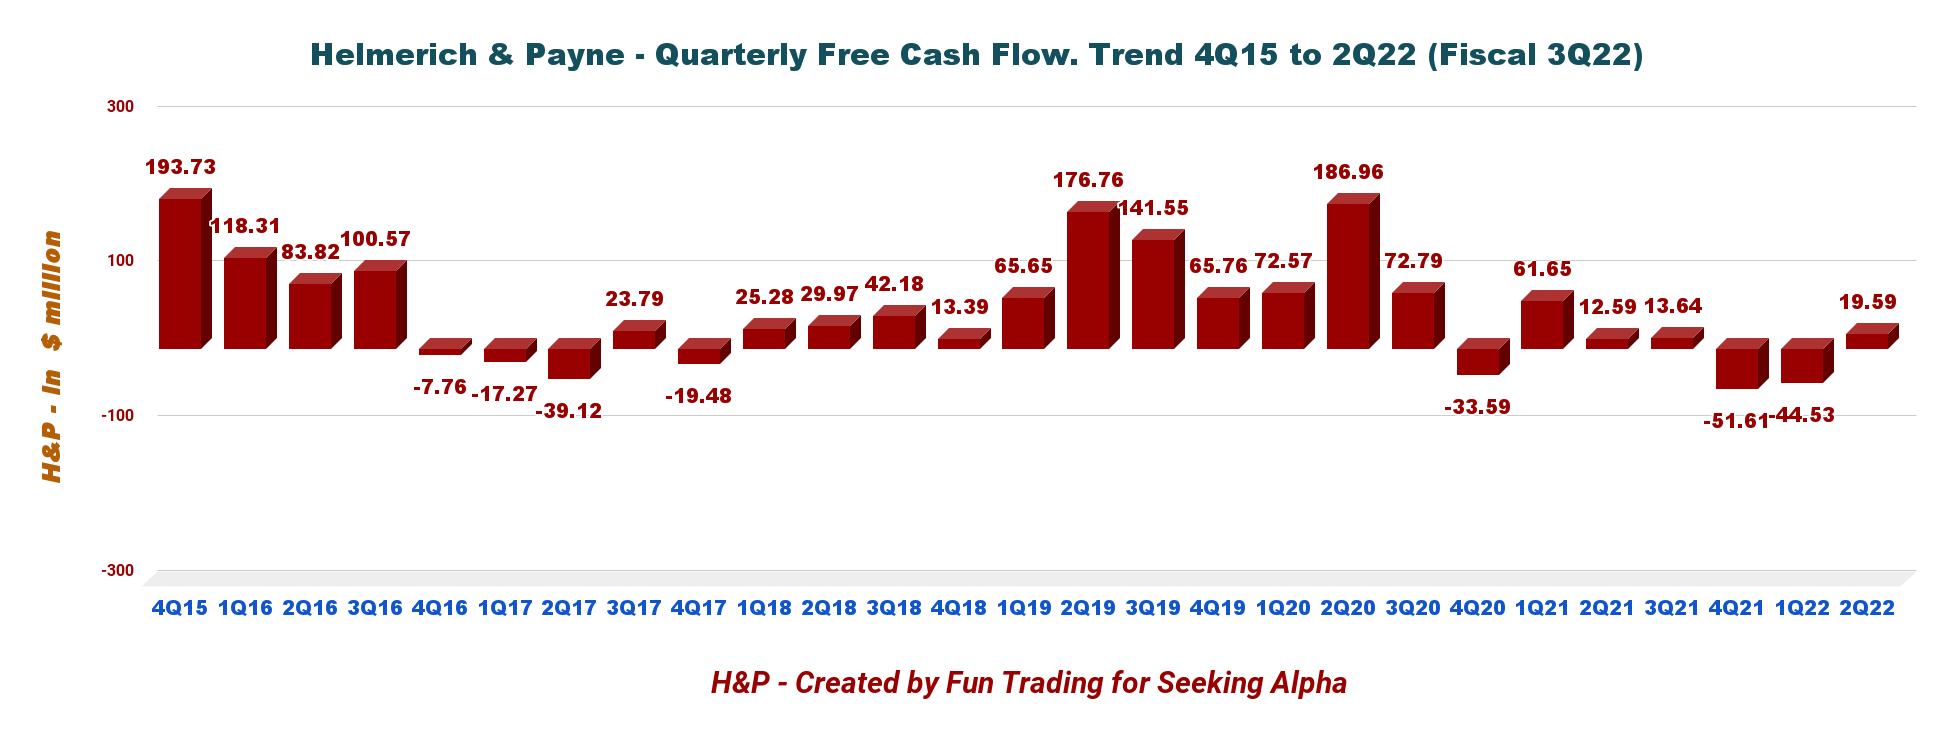
Note: Generic free cash flow is the cash from operations minus CapEx.
The company recorded a negative trailing 12-month FCF of $62.91 million. The free cash flow for the fiscal third quarter is $19.59 million.
The dividend payout represents $106 million annually based on 106.02 million shares and $1.00 per share annually.
3 – Net Debt Rose To $209.3 Million In Fiscal 3Q22
HP Quarterly Cash versus Debt history (Fun Trading)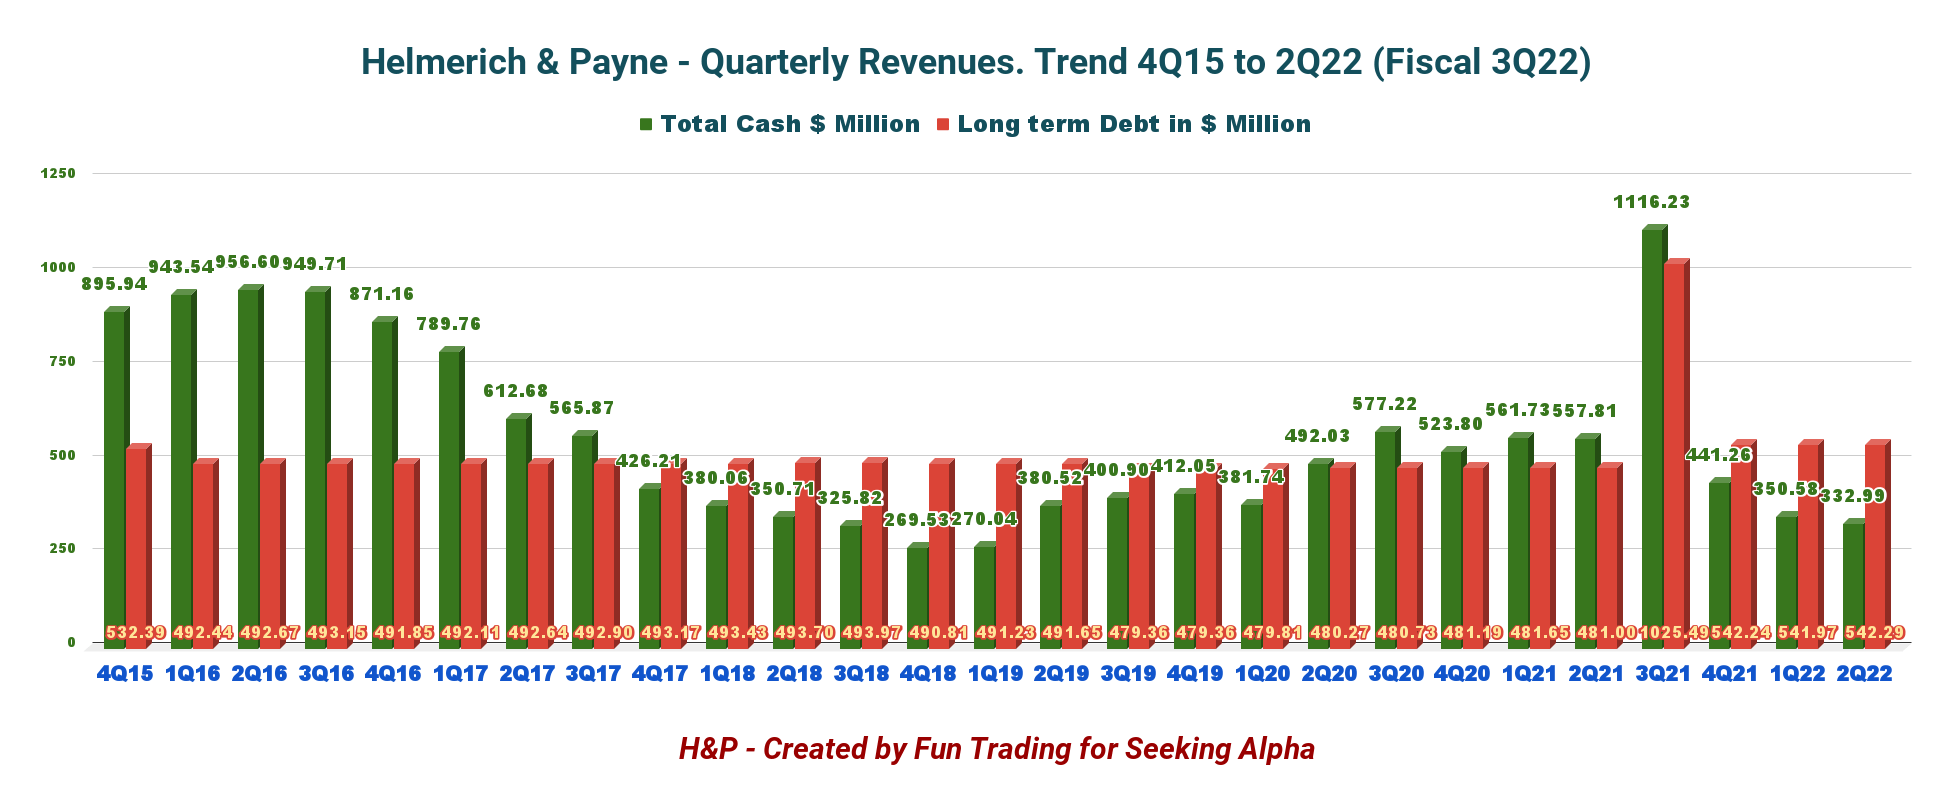
The company shows a net debt of $209.3 million. The company had $332.99 million in cash and short-term investments plus $750 million of availability under its committed revolver. Total liquidity is roughly $1.08 billion at the end of June 30, 2022. The debt-to-capitalization of 16.6% is acceptable.
4 – 2022 Guidance
The company anticipates the gross operating margins of the North America Solutions segment to be between $185 million and $205 million in the fiscal fourth quarter, with around 176 contracted rigs.
In the offshore Gulf of Mexico segment, operating gross margins are expected to be between $9 and $11 million for the fiscal fourth quarter.
Finally, International Solutions’ operating gross margins are expected to be between $4 and $7 million for the next fiscal quarter.
CapEx remains within $250 and $270 million.
Technical Analysis And Commentary
HP TA Chart short-term (Fun Trading StockCharts)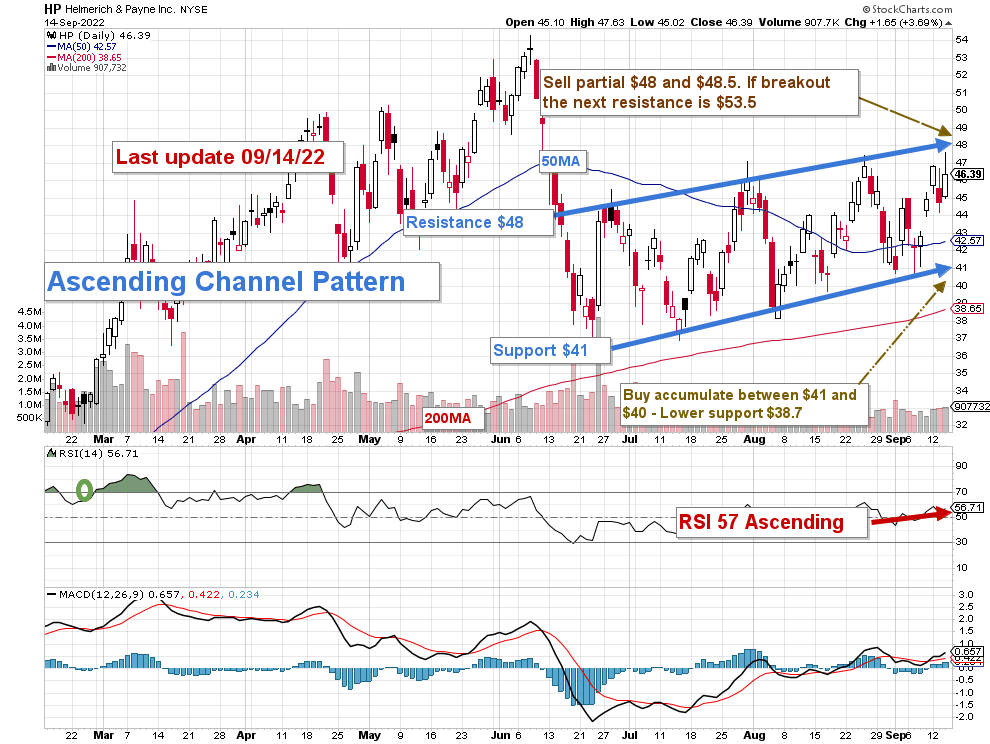
Note: The chart is adjusted for the dividend
HP forms an ascending channel pattern with resistance at $48 and support at $41.
In my preceding article, the short-term trading strategy is to trade LIFO for about 50% of your position, which is still what I recommend now.
I suggest selling between $48 and $48.5 and waiting for a retracement between $41 and $40.
However, HP could experience a breakdown if oil prices lose momentum and retest the lower support at $38.7 (200MA). Conversely, if oil prices increase and cross the $90 level, H&P could break out and retest $53.5.
Watch oil prices like a hawk.
Warning: The TA chart must be updated frequently to be relevant. It is what I am doing in my stock tracker. The chart above has an eventual validity of about a week. Remember, the TA chart is a tool only to help you adopt the right strategy. It is not a way to foresee the future. No one and nothing can.
Author’s note: If you find value in this article and would like to encourage such continued efforts, please click the “Like” button below as a vote of support. Thanks!
Be the first to comment