

Editor’s note: Seeking Alpha is proud to welcome Aldrich Louw as a new contributor. It’s easy to become a Seeking Alpha contributor and earn money for your best investment ideas. Active contributors also get free access to SA Premium. Click here to find out more »

WilliamJu/iStock via Getty Images
Thesis
Helios Technologies (NYSE:HLIO) has sold off aggressively since the start of the year for good reasons. Supply chain issues are causing a rise in costs. These issues impact their ability to deliver on time to customers. Helios have an ambitious target of $1bn in revenue by 2023. They are on their way to that target with healthy profit margins. Helios’ price fell from its high of $109.95 in November to $62.97 on 21 July 2022. I present a bull case for Helios as there seems to be a unique buying opportunity for this stock before its earnings announcement on 8 August.
Helios Technologies Overview
Helios Technologies, Inc. engages in the development and manufacture of motion control and electronic controls technology for diverse end markets, including construction, material handling, agriculture, energy, recreational vehicles, marine, health, and wellness. It operates through the Hydraulics and Electronics segments. The Hydraulics segment provides screw-in hydraulic cartridge valves, manifolds, and integrated fluid power packages and subsystems used in hydraulic systems. The Electronics segment provides electronic control, display, and instrumentation solutions for recreational and off-highway vehicles and stationary and power generation equipment.
Segment Finances: Hydraulics
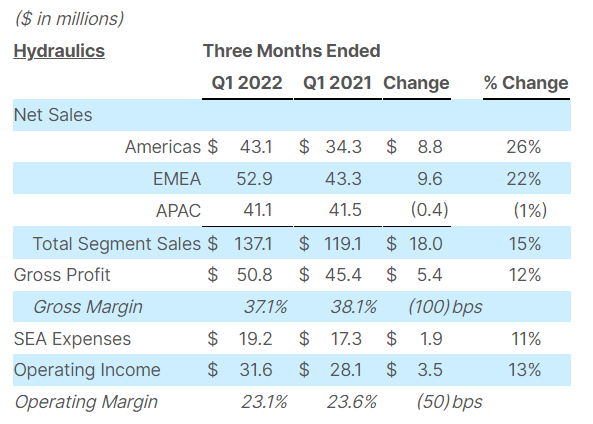
Helios Technologies – Q1 2022 Report
Helios have shown great performance showing growth and losing only 50 bps on their Operating Margin in Q1. Geographically, APAC is lagging but significant growth in Americas and EMEA could be seen as more sustainable.
Segment Finances: Electronics
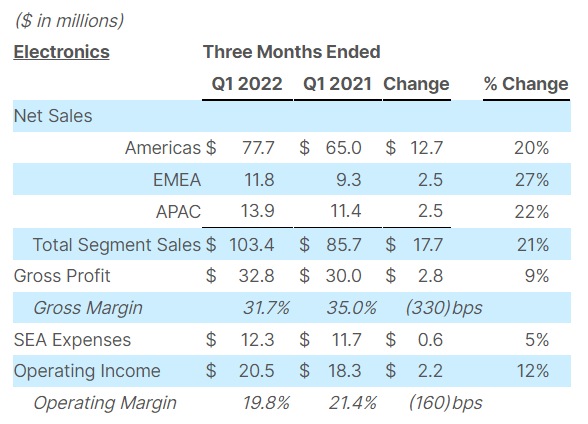
Helios Technologies – Q1 2022 Report
The growth in the Electronics division was great across all regions. Inflationary and supply chain pressures are clearly coming through as they are losing Gross and Operating Margin. Most of this growth comes from their health and wellness and recreational end-markets.
Acquisitions
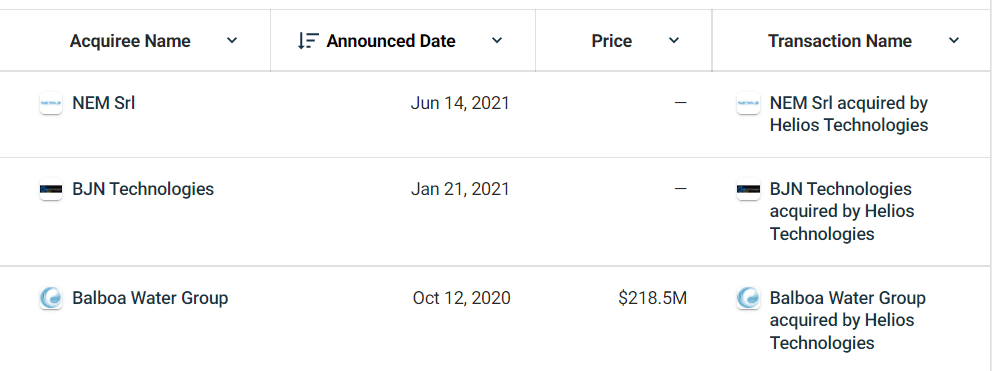
Crunchbase – Latest Helios Acquisitions
In trying to achieve their augmented strategy, Helios have done 3 acquisitions in the last 2 years. Two of these acquisitions had no disclosed price but the Balboa deal was done with $16 million in cash and the rest through a credit agreement. This brings into question their net assets positions and if their debt ratios are still healthy.
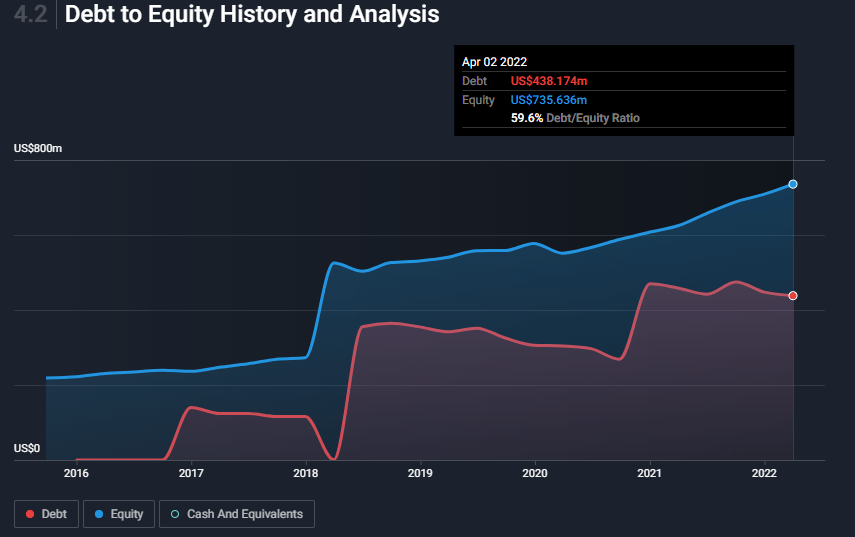
Simply Wall St – Debt to Equity Ratio
Helios’ debt to equity ratio has increased gradually over the last 3 years. Usually, debt to equity ratio below 1 is considered good. Their operating cash flows also cover 25% of their debt and their interest cover ratio is at 10.3 times. This helps me believe that the leadership team has been thoughtful around acquisitions. This will bode well for future revenue and earnings.
Growing Revenue and Healthy Profit Margins
The ride in 2022 has been volatile. Helios’ share price at $62 is still significantly higher than pre-COVID levels. The PE ratio has normalized coming from highs of 120 in 2020 to 18 today. This has materialized while revenue has steadily been increasing. But analysts do not believe that Helios will be achieving its $1 billion revenue target by 2023. Even during significant management changes, they have grown their revenue year on year. Their profit margins remain in a healthy range of 10% to 15%.
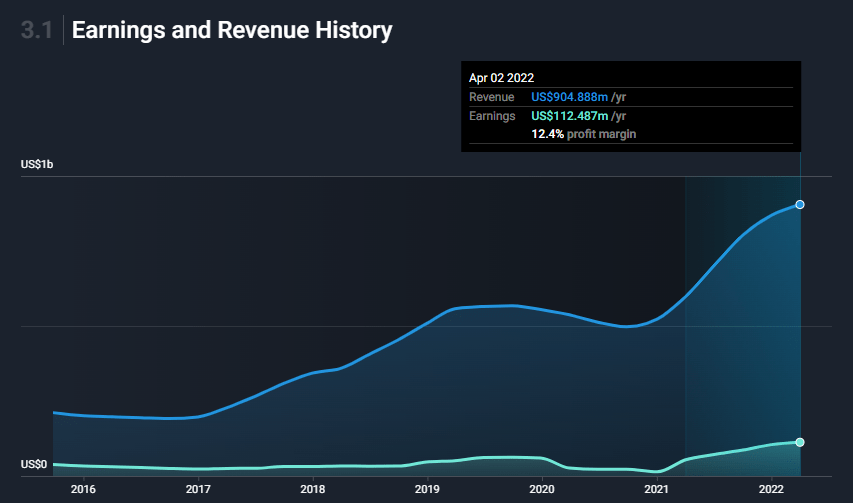
Simply Wall St – Earnings & Revenue Growth
Valuation Comps – Peer Set
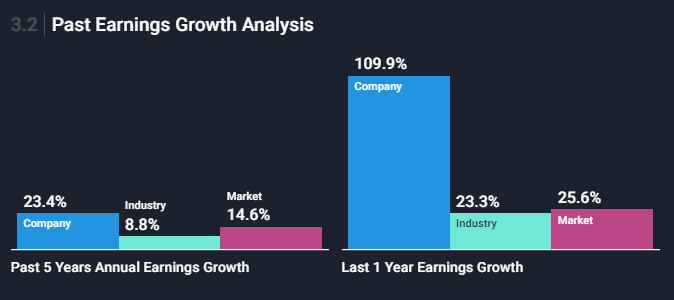
Simply Wall St – Past Earnings Growth Analysis
To maintain the high PE Ratio, we saw in 2020 that Helios had to bring significant revenue growth to the table. The fact that they have been consistent performers makes me believe that they can deliver on the necessary growth. Their performance in the last year has been phenomenal compared to the industry – which explains the rally in its share price toward the end of 2021. It would be up to this management team to execute the augmented strategy. The strategy aims to realize the $1 billion target 2 years earlier than planned in 2023.
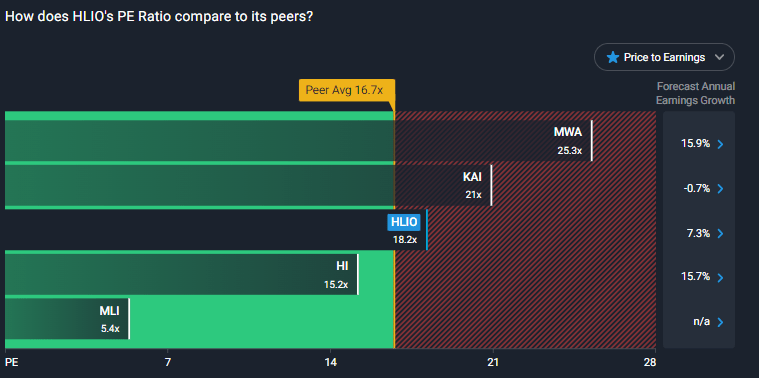
Simply Wall St – PE Ratio vs Peers
Helios is forecasting earnings growth of 7.3%. It would be difficult to maintain the high multiples seen during COVID for a forecasted growth of 7.3%. Some of the companies similar in market cap and industry are:
- Mueller Water Products, Inc. (MWA) – It is one of North America’s largest manufacturers and distributors of fire hydrants, gate valves, and other water infrastructure products.
- Kadant Inc. (KAI) – It is a global supplier of critical components and engineered systems used in process industries worldwide.
- Hillenbrand Inc. (HI) – The firm engages in the development, manufacture, and sale of engineered industrial equipment.
- Mueller Industries Inc. (MLI) – Engages in the manufacture of copper, brass, aluminum, and plastic products.
I believe Helios is overpriced compared to peers. Looking at the below analysis, we need to corroborate this valuation further by comparing it to the industry and performing a discounted free cash flow model.
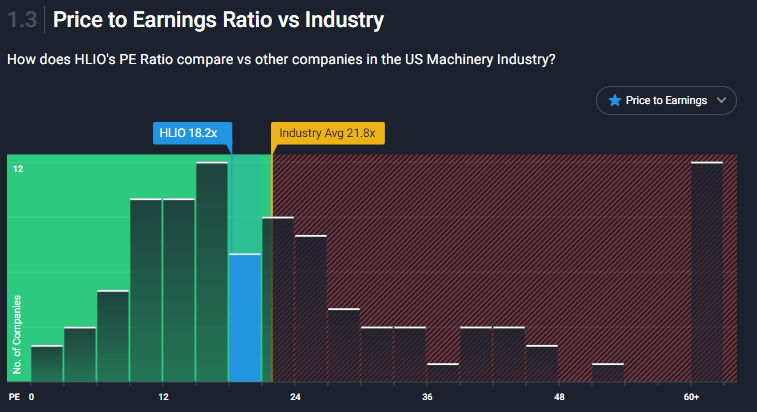
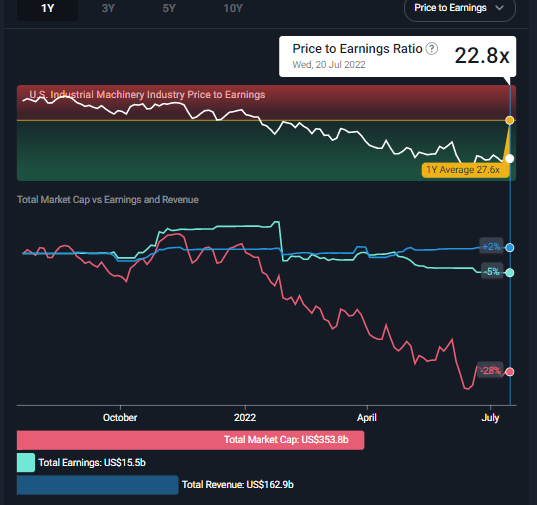
Simply Wall St – PE Ratio vs Industry
Compared to the entire US Machinery Industry, I believe Helios is undervalued. Companies like RBC Bearings (ROLL) and Chart Industries (GTLS) have 60+ PE ratios. This would indicate that the market believes high growth can be obtained from this industry. The larger market cap companies in the industry are around the 21 PE Ratio mark. This puts Helios’ PE ratio in more perspective. In my opinion, this would indicate that the company is undervalued. Because they are in a niche market, their growth opportunities might not be as broad as those for RBC Bearings, which has shown 3x revenue growth in a year. With Helios being around for a much longer time than RBC Bearings it would be better to compare the Helios PE Ratio to their peers and the industry. They are slightly overvalued compared to peers and undervalued based on industry comparison. Based on the PE ratio versus industry and competitors, I have assessed that they are fairly valued. Let’s jump into the free cash flow discounted model.
HLIO Stock Valuation (by Free Cash Flow Model)
My favorite valuation is hands down the discounted free cash flow model. The PE ratio analysis is good when assessing whether a stock is over or underpriced relative to other listed companies. This valuation method looks at growth factors and discounts with an appropriate discount rate. The calculations below outline how an intrinsic value for Helios Technologies is arrived at. By discounting future cash flows to their present value using the 2-stage method. We use analysts’ estimates of cash flows going forward 10 years for the first stage. The second stage assumes the company grows at a stable rate into perpetuity. All values are in USD where a currency amount is calculated.
| Data Point | Source | Value |
| Valuation Model | 2 Stage Free Cash Flow to Equity | |
| Levered Free Cash Flow | Average of 5 Analyst Estimates (S&P Global) | See below |
| Discount Rate (Cost of Equity) | See below | 8.29% |
| Perpetual Growth Rate | 5-Year Average of US Long-Term Govt Bond Rate | 3.74% |
| Data Point | Calculation/ Source | Result |
| Risk-Free Rate | 5-Year Average of US Long-Term Govt Bond Rate | 3.74% |
| Equity Risk Premium | S&P Global | 4.20% |
| Machinery Unlevered Beta | Simply Wall St/ S&P Global | 0.96 |
| Re-levered Beta | = 0.33 + [(0.66 * Unlevered beta) * (1 + (1 – tax rate) (Debt/Market Equity))] | 1.084 |
| = 0.33 + [(0.66 * 0.958) * (1 + (1 – 21.0%) (22.17%))] | ||
| Levered Beta | Levered Beta limited to 0.8 to 2.0 | 1.084 |
| (practical range for a stable firm) | ||
| Discount Rate/ Cost of Equity | = Cost of Equity = Risk Free Rate + (Levered Beta * Equity Risk Premium) | 8.29% |
| Years | Levered FCF (Millions) | Source | Present Value Discounted (@ 6.54%) |
| 2023 | 119.304 | Analyst x3 | 110.17 |
| 2024 | 147.68 | Analyst x1 | 125.93 |
| 2025 | 161.84 | Analyst x1 | 127.43 |
| 2026 | 172.32 | Est @ 6.48% | 125.30 |
| 2027 | 181.144 | Est @ 5.12% | 121.63 |
| 2028 | 188.68 | Est @ 4.16% | 116.98 |
| 2029 | 195.28 | Est @ 3.5% | 111.80 |
| 2030 | 201.2 | Est @ 3.03% | 106.37 |
| 2031 | 206.632 | Est @ 2.7% | 100.88 |
| 2032 | 211.744 | Est @ 2.47% | 95.46 |
| Present value of next 10 years cash flows | $1,141.95 | ||
| Description | Calculation | Result |
| Terminal Value | FCF2032 × (1 + g) ÷ (Discount Rate – g) | $4,342.31 |
| Present Value of Terminal Value | = Terminal Value ÷ (1 + r)10 | $1,957.61 |
| Description | Calculation | Result |
| Total Equity Value | = Present value of next 10 years cash flows + Terminal Value | $3,021.72 |
| Equity Value per Share | = Total Value / Shares Outstanding | $94.43 |
| Description | Calculation | Result |
| Value per share | From above. | $94.43 |
| Current discount | Discount to share price of $66.08 | 30.02% |
| = ($94.43 – $66.08) / $94.43 |
With this analysis, it is clear if they can maintain current revenue and grow slowly but consistently, there is significant upside potential over the next 3 to 5 years for this stock.
Risks
There is still a significant downside risk for Helios Technologies with the newish management, with 8 of the 11 members of the leadership team having been at the company for only less than 3 years. This team must navigate through an uncertain second half of 2022. Since this new team started however, they have been delivering on revenue and earnings targets. A new team is exactly what Helios needed.
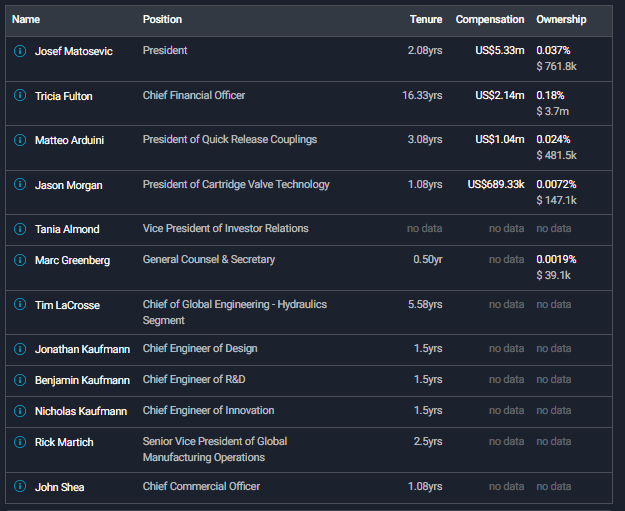
Simply Wall St – Management Team
The big risk to their financials is the rise in operating expenses and supply chain issues. Quarter on quarter, their operating expenses have been increasing since 2021. Free cash flow is falling to levels seen at the start of 2021. What we would hope for is that revenue and earnings convert into free cash flow. From a supply chain perspective, the way they can manage delivery to their customers is by balancing buy vs. make decisions as well as increasing stock levels in anticipation of certain shortages.
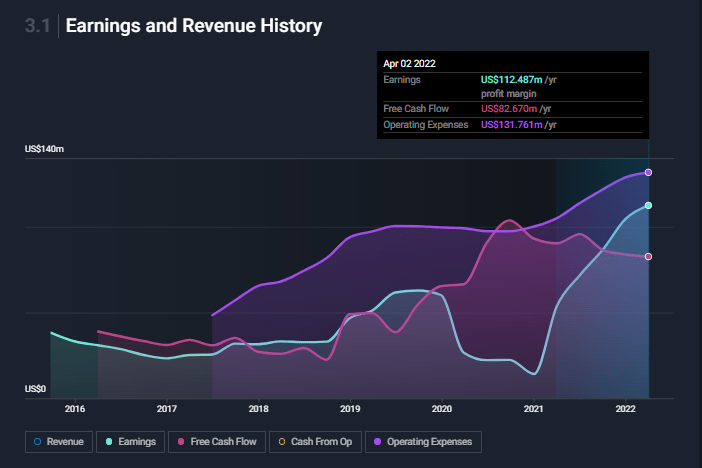
Simply Wall St – Earnings and Revenue History
Simply Wall St – Industry Performance
Another downside risk is that the market is quite pessimistic about the industry as they have dropped earnings by 5%. This could be a big opportunity if management can deliver on the targets they have provided.
The industrial machinery market is expected to grow from $461.89 billion in 2021 to $506.51 billion in 2022, at a compound annual growth rate (CAGR) of 9.7%, even though the stock market is quite pessimistic about the industry. The global industrial machinery market size is then expected to grow to $703.68 billion in 2026 at a CAGR of 8.6%. For Helios, I believe the 7% growth in revenue is reasonable and they will be on their way to $1 billion in revenue by 2023.
Due to the difficult macro landscape, Helios will also be impacted by a strong dollar. A large part of Helios’ revenue comes from regions other than the US. There are global economic recession concerns, a war in Ukraine, and slowdowns in China. This could all be considered headwinds to their valuation. They have weathered many storms and have shown stable growth in revenue since 2016 with a consistent and expanding profit margin. The quality of their earnings should be able to help them weather the difficult economy we are in.
Conclusion
Helios is a consistent performer, and their new management team has executed well. The revenue growth for a company like Helios is ambitious. I believe it is achievable on its current trajectory. I consider the HLIO stock a buy. The earnings release on August 8 will be important and I would suggest waiting till after the earnings release to plan an appropriate entry. If they can beat revenue and earnings numbers, Helios could be going for quite a rally. This would prove that this leadership team can execute its plans and strategies. In the short term, you might lose some return, but the fair value would be realized over a lengthy period – especially considering the wide gap between the free cash flow model valuation and the current stock price.
Be the first to comment