

MF3d
Second Quarter Market Discussion
At this point last year, we began questioning whether or not the post-pandemic surge in the stocks of companies that were either unprofitable, already richly valued, or economically sensitive was reflective of a growing false sense of security. We observed at the time that the economic expansion was more closely correlated to the amount of stimulus being doled out than any material growth in base wages. Fast forward 12 months, and the market in the second quarter of 2022 is experiencing the early stages of an inflationary hangover.
The pullback in equities in Q2 and year to date has left investors with few places to hide. On a relative basis, active management and an orientation towards value cushioned the blow. The Russell Mid Cap® Value Index was down for the quarter and the first half of the year, but it beat the S&P 500 and significantly outperformed the Russell Mid Cap Growth index over each timeframe. The Heartland Mid Cap Value Strategy, meanwhile, outperformed the Russell Mid Cap® Value Index in Q2 and on a year-to-date basis.
The same concerns that initially pressured equities in the first quarter were again in focus, only more acutely. The Consumer Price Index rose 8.6% year over year in May, the biggest increase in 41 years. The Federal Reserve, in its May and June meetings, raised its benchmark federal funds rate by 50 basis points and 75 bps, respectively, the latter representing the Federal Reserve’s most aggressive hike since 1994. And the ongoing war in Ukraine continued to pressure commodity prices, while accentuating the geopolitical tensions further eroding confidence.
Discouraging economic numbers, deteriorating company fundamentals, and waning investor sentiment collectively pulled the major indices into bear market territory. One of few silver linings from these concerns is that these conditions have set the stage for a stock picker’s market. As the resetting of expectations continues, we are taking an attentive, wait-and-see stance because high quality cyclicals that will likely lead the market out of a downturn are rapidly moving from fair to undervalued. We believe lower expectations could set the stage for cyclical leadership, potentially after an economic recession is officially declared.
More Room to Fail?
Source: FactSet Research Systems Inc.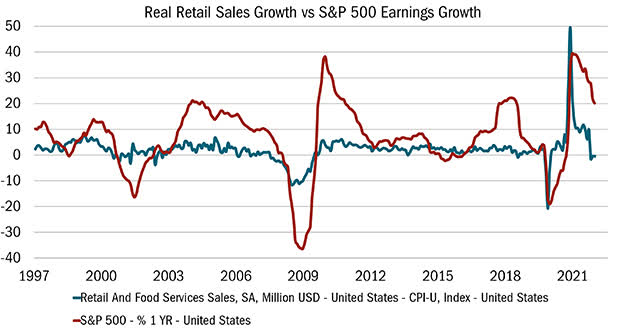
Monthly data 6/30/1997 to 5/31/2022. The data in this chart represents the Real Retail Sales Growth (seasonally adjusted) versus the S&P 500 Earnings Growth starting in May of 1997. The Real and Food Sales Growth index has a base of 1982-84=100 (the average of the monthly index values is 100 over the 36 months in 1982 through 1984). All indices are unmanaged. It is not possible to invest in an index. Past performance does not guarantee future results.
Attribution Analysis
Security selection in Q2 was again strong on a relative basis. Allocations to Consumer Staples, Energy, Real Estate, and Utilities contributed to the portfolio’s absolute returns in the quarter, while the successful application of Heartland’s Ten Principles of Value Investing™ process helped identify winners in Financials and Industrials. Stock selection in these areas also contributed to the outperformance against the benchmark, while holdings in Information Technology detracted on an absolute and relative basis.
A number of attributes helped the portfolio weather the storm in Q2, including a defensive bias driven by our bottom-up stock selection, valuation discipline, and an overweight to higher quality “value bucket” businesses. This defensive tilt aligned well with the S&P 500’s top three performing factors in Q2: Value, Profitability and Dividends.
Hot and Cold on Real Estate

Real Estate, perhaps more than any other sector, exemplified the extent to which allocation and securities selection contributed to the Strategy’s outperformance. The average weight of holdings in the sector represented about 6.7% of the entire portfolio during the quarter, compared to an average weighting of approximately 11.4% in the benchmark. Yet, within the portfolio, real estate holdings represented the best performing sector; in the benchmark, it represented a significant drag on Q2 performance. The difference, we believe, reflects the emphasis we place on downside risk relative to upside reward, which resulted in defensive positioning within Real Estate. We favored assets with materially less leverage that tend to be more resilient in the event of multiple compression and/or tightening financial conditions.
Atlanta-based, Americold Realty Trust (COLD), for instance, is the second largest owner and operator of cold-storage warehouses in the world and represents a critical piece in the food-production supply chain. Cold storage is a niche asset class within Real Estate. Unlike most real estate owners who only collect a rent check, Americold manages operations for tenants, which creates a meaningful barrier to entry. While the company’s shares came under selling pressure in the second half of last year and early in 2022 — due to sharp declines in occupancy rates and inflationary pressures – April data published by the USDA suggested that cold-storage inventories could be improving after a sustained period of contraction.
Americold, as of quarter end, was trading at a 6.2% cap rate on NTM net operating income (NOI) and over 7% on normalized NOI. We believe a 5% cap rate represents a fair multiple for REITs with meaningful barriers to entry, which implies the potential for a total return north of 25%.
Finding Financial Wellness
The portfolio also continued to be underweight Financials as the possibility for credit and asset value deterioration amid a worsening economy is likely to offset some of the tailwind a hawkish Federal Reserve would normally provide for the sector. While holdings were down on an absolute basis, the group outperformed the benchmark. The combination of the allocation effect and security selection in the sector played a significant role in the portfolio’s outperformance.
Certain names made progress against developing headwinds. First Interstate BancSystem, Inc. (FIBK) represents one example. Based in Billings, Montana, First Interstate maintains the second-largest market share based on deposits among community banks in Montana and Wyoming.
The company in recent years has pursued strategic acquisitions across the Northwest. While this has extended the bank’s reach across a “less-competitive” region — known for higher margins and more attractive returns – the bank’s purchase of Great Western Bancorp last year, weighed on shares given the target’s history of poor credit underwriting.
Several catalysts could drive shares higher and offer a level of protection. As part of the acquisition, First Interstate was able to write down Great Western’s troubled-loan portfolio by approximately 20%, an aggressive mark that should provide a buffer against the potential for a negative credit cycle in the future. The company is also expected to show substantial earnings growth in fiscal year 2023, projected to be north of 30% including accretion from the Great Western acquisition. The removal of the stock’s dual-share class structure should also open the door for passive index inclusion. Shares, as of the end of Q2, were trading at 9.7x our FY23 earnings estimate, implying there could be considerable room to appreciate toward its historic median P/E multiple of 13.6x.
Industrial-Strength Catalysts

The conventional wisdom traditionally holds that the Industrials sector tends to underperform late in economic expansions and into recessions, as manufacturers and other companies in the sector navigate rising costs and slowing demand. The portfolio was overweight Industrials in the quarter and year to date, but stock selection in the sector contributed to its outperformance against the benchmark. This was driven by strong earnings updates from some of our names, considering the challenging backdrop.
Snap-on Inc. (SNA) represents a typical holding in that its recent earnings performance, which easily topped analyst expectations, underscored the company’s ability to pass on higher costs to customers. Based in Kenosha, Wisconsin, Snap-on designs and manufactures professional-grade tools with a particular focus on the automotive-repair industry.
While the company was a top performer in the portfolio during the quarter, we believe its current valuation – trading at 12x earnings – leaves plenty of room to run. By comparison, peers trade at 15x earnings even though Snap-on has better margins and operates with less leverage than its competitors.
Meanwhile, several secular tailwinds, including an aging fleet of used cars and ever-increasing vehicle complexity, should prove beneficial to Snap-on’s business over the longer term. Snap-on’s history of distributing dividends, which has grown at a 7% CAGR over the past 35 years, underscores its financial discipline and is an added appeal.
Portfolio Activity
The growing anxiety from geopolitical and interest rate risk is creating opportunities to upgrade the composition of the portfolio. While “deep value” mispricing opportunities remain on our radar, we can categorize our activity into one of three different categories to capitalize on the availability of higher-quality names that now meet our valuation criteria.
First, we are seeking to build on existing positions in holdings marked by attractive valuations and strong execution to contend with existing headwinds. Many of the best “buy” opportunities in this category could be described as being less sensitive to the economic pressures on the demand side of their business but may have already experienced a “profit recession” driven by cost pressures that we consider more fleeting in nature. We amassed positions in several of these companies throughout recent quarters, feeling that a “scarcity value” would be ascribed to stocks that experienced stabilizing or improving estimate revisions in a market where they are broadly going the wrong way.
Second, we are pursuing opportunities to add to oversold positions. We may have little confidence in the near-term demand trends, but the market has already priced in a substantial downturn and is overlooking the company’s ability to compound value over time. We are slowly rebuilding positions in these names as the volatility persists.
Finally, the third category could be characterized as a “watch list” of quality companies best described as “early cycle compounders,” who have sold off enough to offer investors attractive long-term return potential against what remaining downside may exist. We are encouraged by the opportunity set that is building in this category.
Currently, our portfolio tilts toward the first category, particularly given our defensive orientation in recent quarters. But we are increasingly seeing attractive candidates emerge in the second and third categories. And as our “watch list” has grown, we have begun initiating positions in the most attractive names. We are not trying to “time” the market, and we know we may be early in certain circumstances. However, we are premising our “buy” decisions on the risk/reward profile of specific securities and analysis that informs how we handicap a range of possible scenarios.
Genpact, Ltd. (G), for instance, is a leading business process outsourcing firm whose client base of over 700 large global companies includes over a quarter of the Fortune 500 companies. Genpact’s double-digit organic growth is attributable to a range of cyclical and secular factors, but against its peer set, the company distinguishes itself as a provider of high-value, margin-enhancing solutions that help clients better compete in an evolving marketplace. Its solution set includes services that facilitate digital transformation, automation, predictive cloud-based analytics, and supply chain optimization. Valued at approximately 14x forward-looking earnings and 2x sales, Genpact’s stock trades at a deep discount to many of its peers, while its mix of growth and profitability suggests the current discount is unwarranted.
Similarly, Elkhart, Indiana- based THOR Industries (THO), the world’s largest manufacturer of recreational vehicles, has proven resilient in the current environment. In both the first and second quarters of 2022, the company reported earnings that more than doubled versus the respective year-ago periods. Yet, the stock is down by over 25% year-to-date and is nearly 50% off of its peak in the current market cycle, as rising gas prices, weak consumer sentiment and higher financing costs have weighed on shares. While year to date sales are showing some deceleration, the stock – trading below 7x forward earnings – appears to be pricing in a major drop in consumer demand. Fundamental analysis, however, suggests the current sell-side consensus estimates are too high (which makes the current forward multiple deceiving).
Both holdings, Genpact and THOR, represent stocks that fall into the second category of opportunities characterized by existing holdings that have become more compelling after the recent selloff regardless of elevated uncertainty.
Alternatively, some areas that have performed well recently could see their growth trajectory begin to level off. For instance, Energy has been one of the best performing sectors in the portfolio, a beneficiary of rising oil prices, but we exited our position in one name in this space given opportunities emerging elsewhere. There is some concern that if the Federal Reserve pushes the economy near or into a recession that Energy stocks could lose some steam. However, energy services companies, such as NOV Inc. (NOV), are better positioned even if demand begins to wane, given years of underinvestment in global oil and gas production.
Outlook and Positioning
The mid-cap universe of stocks is somewhat unique compared to other areas of the market. Compared to the small-cap stocks, for instance, the consistency of quality throughout the universe is evident, which should provide comfort in transitioning from a defensive to offensive posture at an earlier point in the market cycle. However, we do not believe the market has hit a trough. It is likely that further volatility will accompany future interest rates hikes, ongoing economic uncertainty, and earnings news as company fundamentals reflect these conditions.
While our defensive positioning has served the portfolio well, we will begin to contemplate a more definitive “early cycle” pivot amid a broad-based market selloff. Four potential developments could signal a market capitulation in which the opportunity to find attractive assets at compelling valuations becomes most pronounced: material cuts to the earnings estimates of sell-side analysts; management teams citing “a weakening demand environment” (versus blaming isolated events, such as supply chain shortages, labor availability, etc.); a recession is officially declared; and the stock prices of companies on our watch lists hit specified “buy” targets.
It is less about timing the market than placing our trust in a proven process to identify companies with attractive valuations, balance-sheet strength, and catalysts that can either fuel future growth or change investor perceptions. This approach allows us to be opportunistic amid this uncertainty, while finding conviction in names that we believe represent the most favorable risk-adjusted returns across the entire mid-cap universe.
Thank you for your continued trust and confidence.
Fund Returns (6/30/2022)
| Since Inception (%) | 20-Year (%) | 15-Year (%) | 10-Year (%) | 5-Year (%) | 3-Year (%) | 1-Year (%) | YTD* (%) | QTD* (%) | |
|---|---|---|---|---|---|---|---|---|---|
| Mid Cap Value
Investor Class |
8.56 | – | – | – | 8.66 | 10.24 | -3.95 | -8.98 | -9.79 |
| Mid Cap Value
Institutional Class |
8.83 | – | – | – | 8.92 | 10.51 | -3.75 | -8.87 | -9.74 |
| Russell Midcap® Value | 6.92 | – | – | – | 6.27 | 6.70 | -10.00 | -16.23 | -14.68 |
*Not annualized
Source: FactSet Research Systems Inc., Russell®, and Heartland Advisors, Inc.
The inception date for the Mid Cap Value Fund is 10/31/2014 for the investor and institutional class.
Editor’s Note: The summary bullets for this article were chosen by Seeking Alpha editors.
Be the first to comment