


William_Potter/iStock via Getty Images
Investment Thesis
The iShares Core High Dividend ETF (NYSEARCA:HDV) reconstituted effective Tuesday, and surprisingly, the Index saw very few meaningful changes after a highly volatile quarter. For investors expecting markets to continue on their downward path favoring inflation-friendly stocks, it’s undoubtedly terrific news. On the other hand, I’m growing more concerned that the cure for higher prices will, indeed, be higher prices and that an overreliance on Energy stocks could lead to underperformance in a recession. HDV is close to 20% Energy, and since oil prices are notoriously impossible to predict, HDV’s risks are likely more than what its fundamentals suggest. Therefore, current shareholders may want to take some profits by switching to other dividend and value-oriented ETFs. I’ll compare HDV with another high-dividend ETF worth consideration, and as always, I look forward to your inputs in the comments section afterward.
ETF Overview
Strategy, Sector Exposures, and Top Holdings
HDV tracks the Morningstar Dividend Yield Focus Index and is one of the few high-dividend U.S. Equity Indexes to reconstitute quarterly. Selecting from a large universe of stocks covering about 97% of total U.S. market capitalization, the Index screens stocks that score well on Morningstar’s proprietary Wide Moat and Distance To Default ratings. The top 75 securities by indicated dividend yield (excluding REITs) are selected, and this process is summarized in the graphic below.
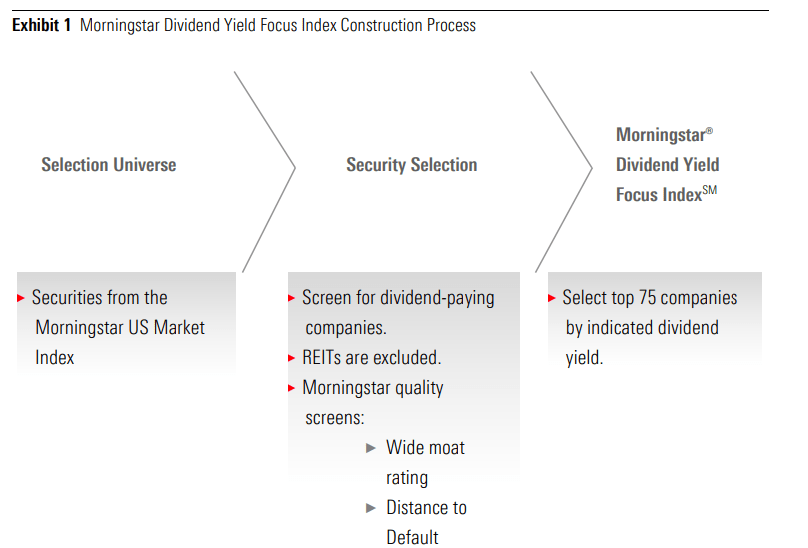
Morningstar
Since the Index reconstitutes frequently, the highest-yielding stocks are constantly rotated to the top of the list, ensuring a high yield. HDV has a trailing yield of 3.18%, but my estimates put that figure closer to 3.94% based on the current holdings. I will discuss that more later, but first, here are some additional descriptive statistics on HDV:
- Current Price: $99.87
- Net Assets: $8.15 billion
- Shares Outstanding: 126.45 million
- Expense Ratio: 0.08%
- Launch Date: March 29, 2011
- Trailing Dividend Yield: 3.18%
- Five-Year Dividend CAGR: 2.53%
- Ten-Year Dividend CAGR: 6.15%
- Five-Year Beta: 0.90
- Number of Securities: 75
- Portfolio Turnover: 75% (39% For Six-Months Ended October 31, 2021)
- Median Bid-Ask Spread: 0.02%
- Tracked Index: Morningstar Dividend Yield Focus Index
The 0.08% expense ratio is crucial for high-dividend investors since fees directly reduce distributions. Unfortunately, most high-dividend ETFs come with a high expense ratio, but some notable exceptions are worth researching. The following four ETFs are the only others with expense ratios less than 0.10% and an estimated indicated dividend yield greater than 3%.
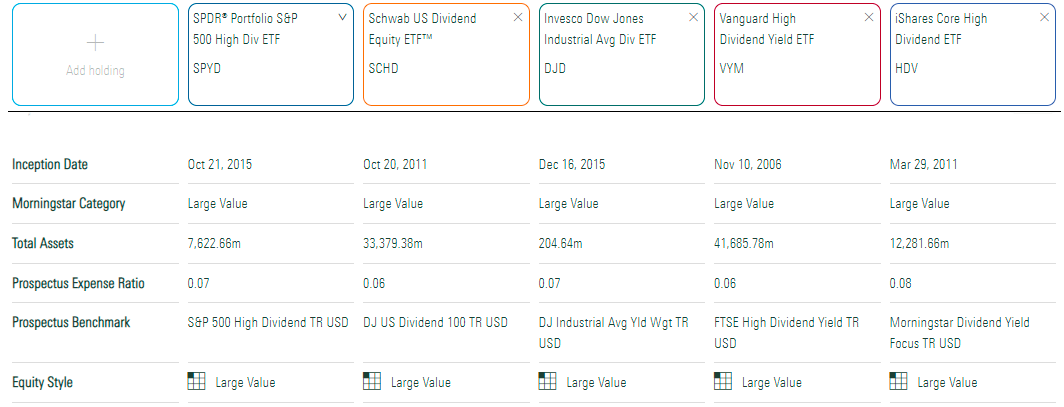
Morningstar
The following table highlights the sector allocations for HDV and these four comparators. HDV’s Energy exposure continues to hover near 20%, which is still 8% higher than VYM, its nearest competitor. In addition, HDV is also overweight Health Care (23.13%) and Consumer Staples (16.90%).
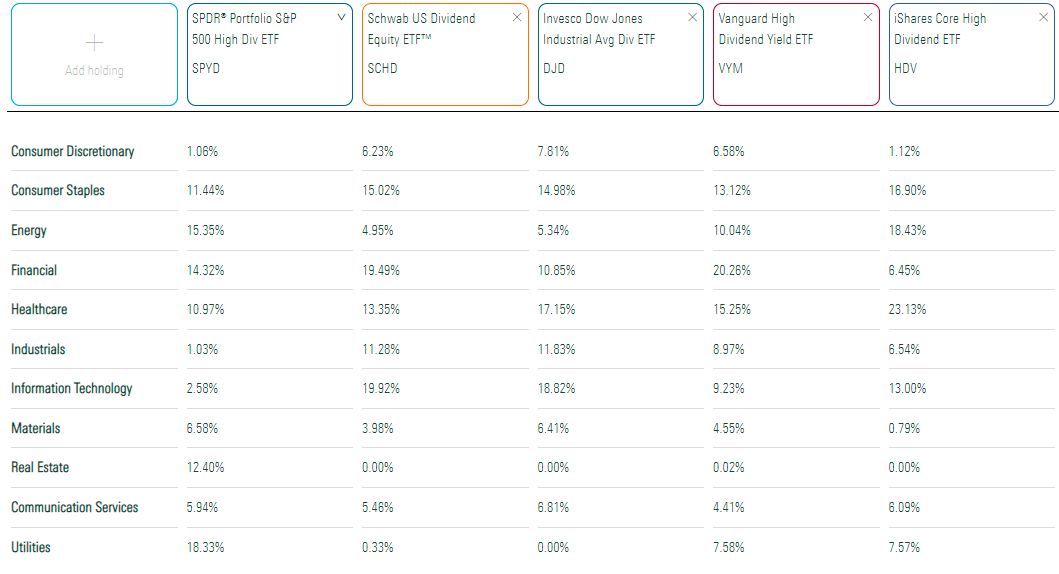
Morningstar
HDV’s top ten holdings are shown below, totaling 49.76%. It’s a very concentrated ETF, with Exxon Mobil (XOM), Johnson & Johnson (JNJ), and Verizon Communications (VZ) accounting for 20%.
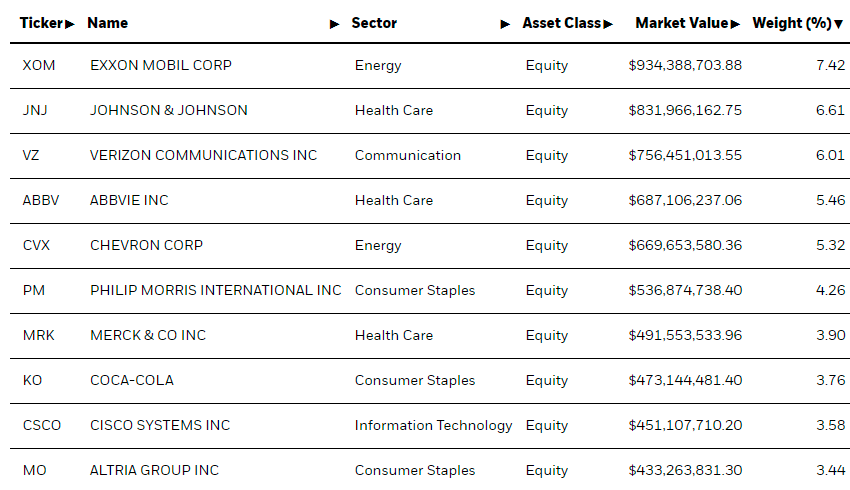
iShares
Performance
Due to its unique combination of low-risk and inflation-friendly stocks, HDV has been one of the best-performing ETFs this year. I’ve covered it closely over the last year and consistently recommended it despite the ETF’s underwhelming track record. It just shows how relying on past performance can cause you to miss out on some nice opportunities.
But just how underwhelming is HDV’s track record? Consider that by the time I wrote my first article in April 2021, HDV had been around for about ten years, turning a $10,000 initial investment into $26,549 with dividends reinvested, or approximately 10.26% per year. That’s solid, but it’s much less than the 13.84% for the SPDR S&P 500 ETF (SPY).
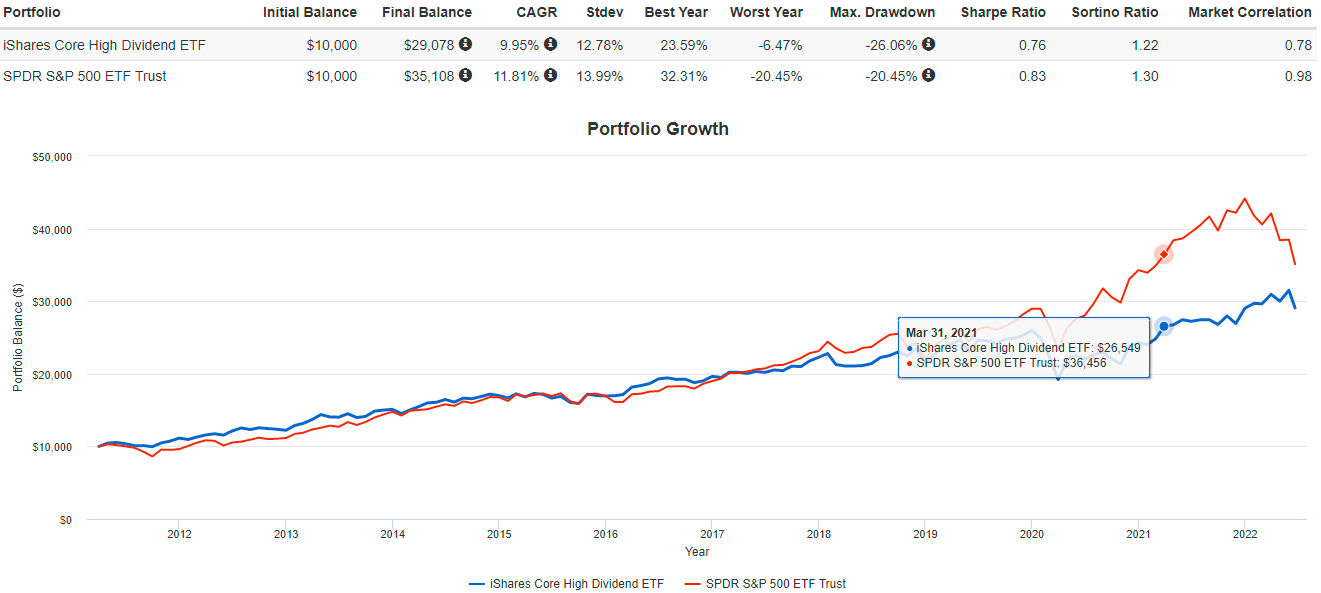
Portfolio Visualizer
Since April 2021, HDV has gained 9.53%, while SPY has lost 3.70%. Still, HDV’s annualized gain since inception is almost 2% worse than SPY (9.95% vs. 11.81%). These long-term results suggest HDV’s strategy is inferior, but I caution against relying too much on past performance since that method inherently requires the past to repeat itself. Very little of the last ten years was “normal,” so investing based on the current environment is best.
The same applies to comparisons of HDV with the Schwab U.S. Dividend Equity ETF (SCHD) and the Vanguard High Dividend ETF (VYM). Despite HDV performing the best in the last year, it’s been a long-term underperformer since 2011. In this case, I view both as better alternatives in the long run, but that doesn’t mean HDV isn’t worth buying for the short term. Previously, I’ve recommended taking it quarter by quarter because HDV’s reconstitutions are often significant.
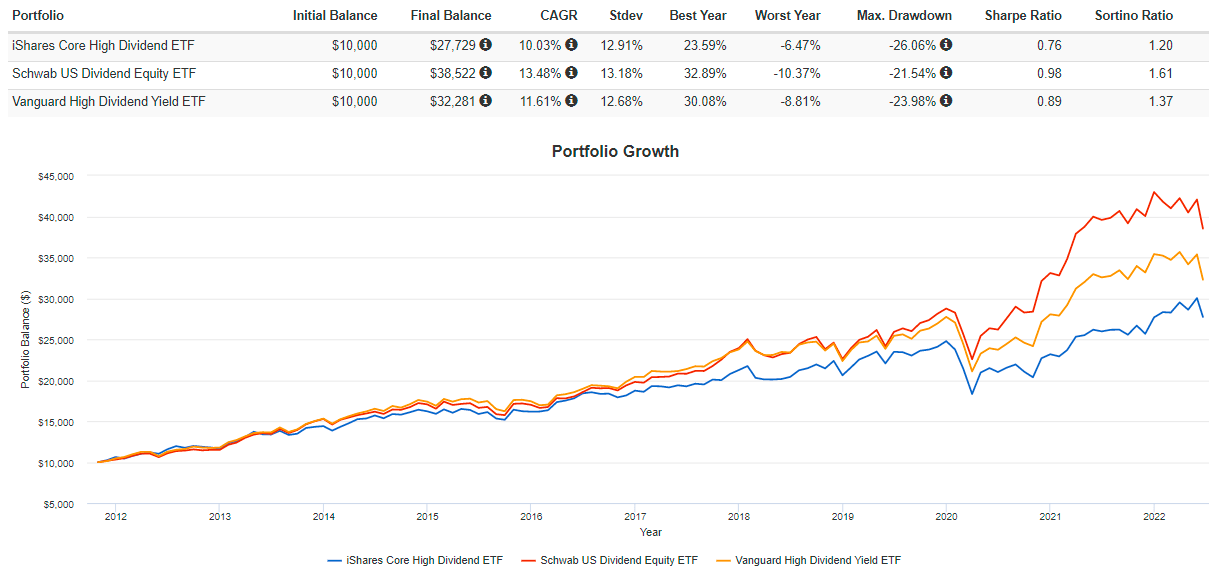
Portfolio Visualizer
HDV Analysis
Reconstitution Summary
As mentioned, the June reconstitution was uneventful, but there were nine additions primarily because of an improvement in the Distance to Default screen.
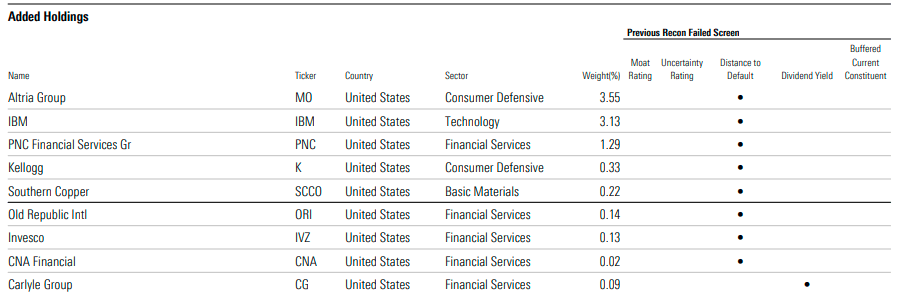
Morningstar
Altria Group (MO) and IBM (IBM) were the only significant adds with weights above 3%. On the deletions side, JPMorgan Chase (JPM) was deleted again after just being added back in the last quarter.
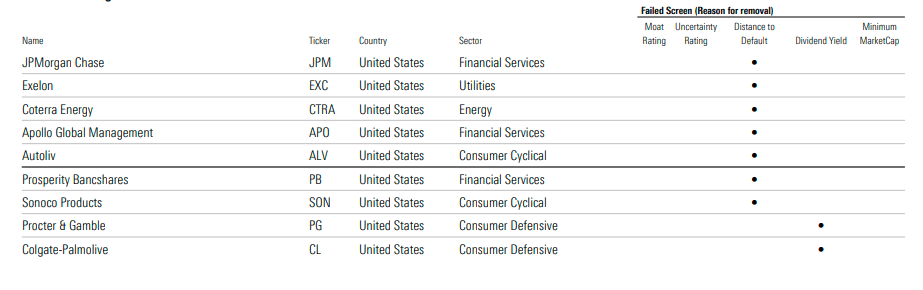
Morningstar
Morningstar also lists potential future holdings, with the top ten shown below. I believe adding Dominion Energy (D) and PPL (PPL) would help bolster the fund’s defensive qualities. In general, Utilities are great to own in case of a recession.
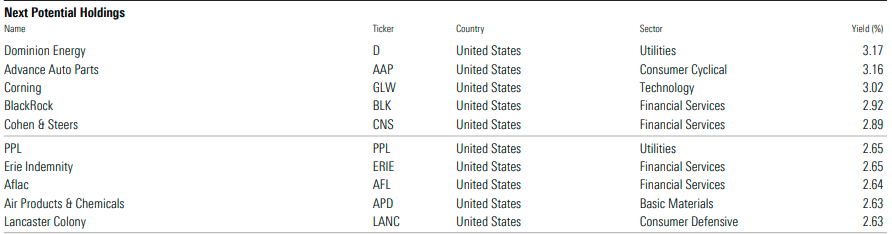
Morningstar
Dividends
Seeking Alpha gives HDV a “C+” Dividend Grade, primarily due to its poor dividend growth rate history. As shown, dividends have grown by a paltry 2.53% per year over the last five years. For context, SCHD’s five-year dividend growth rate is 13.32%, so I don’t think there’s much debate over which ETF is better for DGI investors.
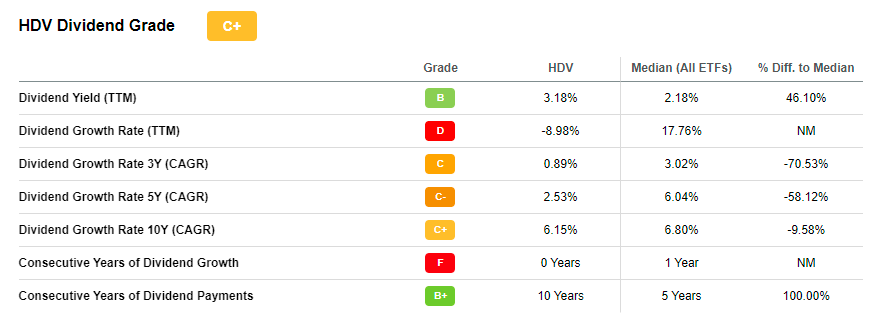
Seeking Alpha
However, utilizing a fund’s dividend growth rate history is a bit unfair because of turnover. HDV’s portfolio isn’t the same now as it was five years ago, so the above reflects the strategy rather than today’s portfolio.
As an alternative, I suggest looking at the dividend characteristics of HDV’s current holdings, which I’ve done below, and compared them with SCHD. While SCHD is still the better dividend growth fund, HDV’s constituents have raised dividends at an annualized 8.50% over the last five years. That’s quite good, so I think shareholders will soon see an improvement in that metric.
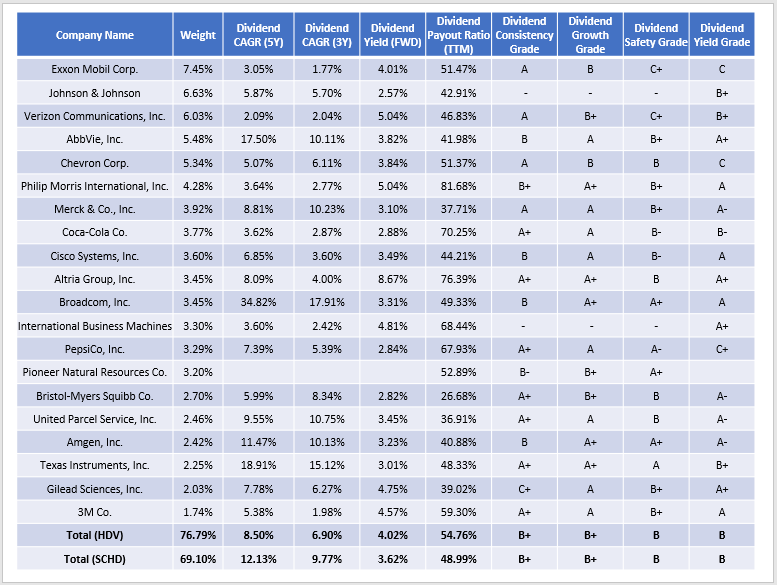
The Sunday Investor
HDV’s constituents also yield 4.02% on average, and after subtracting the 0.08% in fees, investors should be left with a yield close to 3.94% based on current prices. That’s significantly above the 3.18% trailing yield. Although numerous factors can impact an ETF’s distribution, I think shareholders will also see a solid September payment to compensate for the disappointing one this month.
Fundamentals Snapshot
From a fundamentals perspective, HDV looks excellent. All of its top 20 holdings have an “A+” Seeking Alpha Profitability Grade, the five-year beta is low at 0.80, the forward price-earnings ratio is just 13.64, and the ETF as a whole has a double-digit forward revenue growth rate. As discussed in my last article on the Vanguard Value ETF (VTV), that’s rare in the large-cap value and dividend ETF space. Here’s a snapshot of HDV, and I’ve included summary metrics for SCHD for comparison purposes.
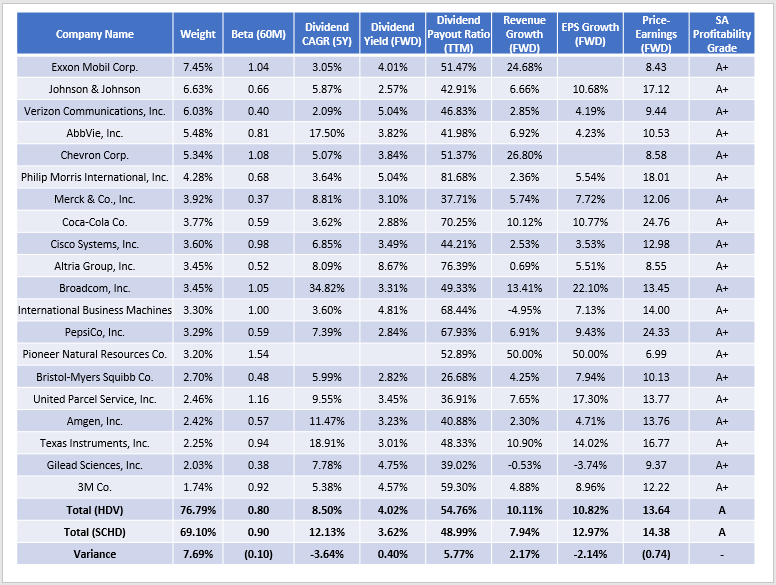
The Sunday Investor
Big picture, HDV:
- is more concentrated in the top 20 holdings (76.79% vs. 69.10%)
- is less volatile as measured by its five-year beta (0.80 vs. 0.90)
- has a lower five-year dividend growth rate (8.50% vs. 12.13%) based on current holdings
- has a higher gross dividend yield (4.02% vs. 3.62%) and payout ratio
- has a higher estimated revenue growth rate (10.11% vs. 7.94%) but a lower earnings per share growth rate (10.82% vs. 12.97%)
- has a slightly lower forward price-earnings ratio (13.64 vs. 14.38)
Mostly, these figures suggest HDV should perform well in a recession. Unfortunately, I don’t think it’s that simple, given HDV’s reliance on Energy stocks which make up close to 20% of the ETF. To illustrate, let’s look at how a portfolio of HDV’s current holdings (rebalanced quarterly) would have performed since 2013. That’s how far I could go back without significantly altering the results since I had to remove some smaller securities that didn’t begin trading until recently. The full link is here for readers with a premium subscription to Portfolio Visualizer.
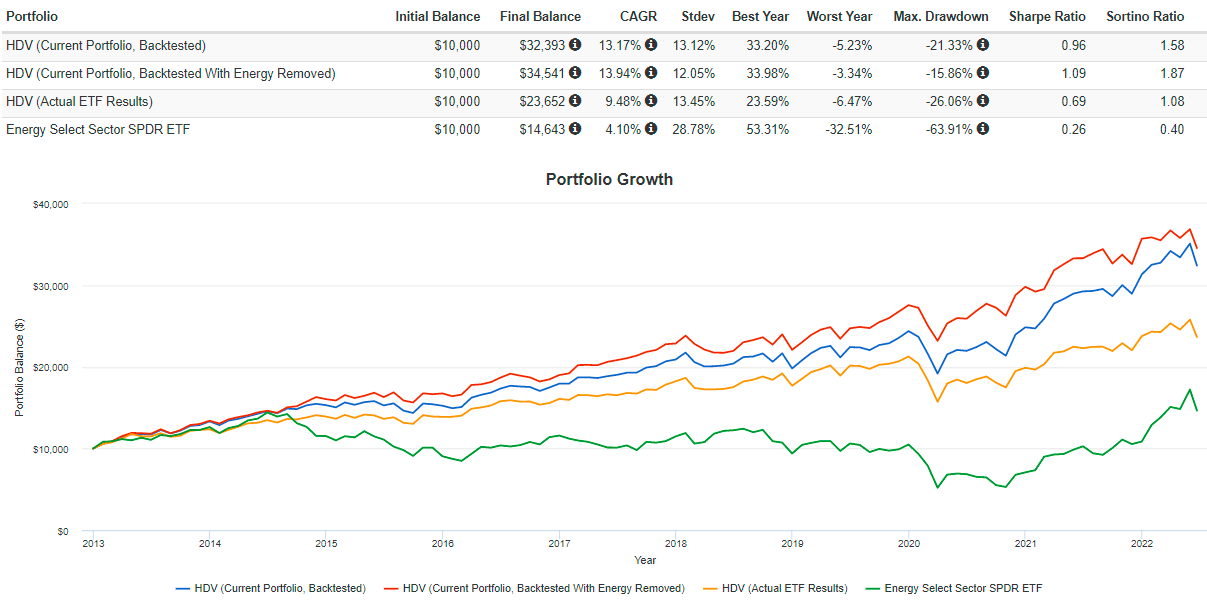
Portfolio Visualizer
As shown, HDV, as it currently stands, would have returned an annualized 13.17% compared to 13.94% if the portfolio was re-adjusted to exclude Energy stocks. These results highlight how risky the Energy sector is and dramatic the potential declines can be. During Q1 2020, the Energy Select Sector SPDR ETF (XLE) lost 63.91%, contributing to a significantly higher drawdown for HDV’s current holdings (21.33% vs. 15.86%). That’s about a 5.5% underperformance in three months, which would roughly double should XLE’s YTD gains be wiped out.
It’s well-known that Energy prices lead during inflationary periods. Therefore, it’s a great hedge, and a key reason HDV outperformed this year. However, oil prices tend to rise and fall quickly just before or during recessions, as indicated in the (log scale) graph below. From July to October 1990, WTI oil prices more than doubled from $17 to $41 per barrel before bottoming at $17 just as the recession ended around March 1991.
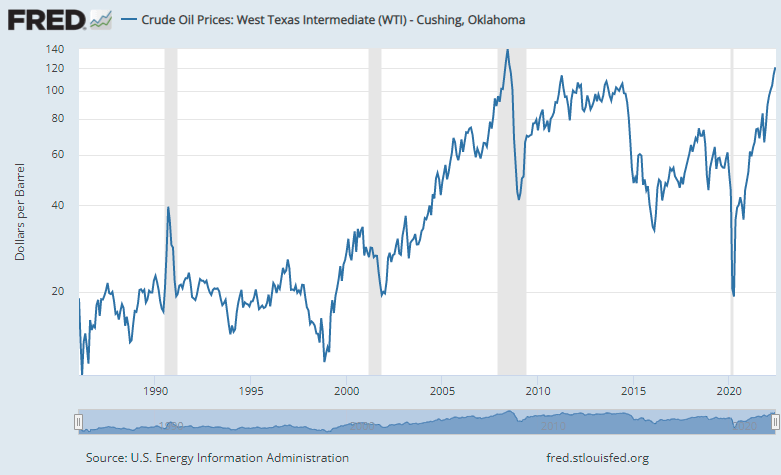
FRED
The tech crash in the early 2000s was unrelated to energy costs. Still, oil prices fell from $28 in March 2001 to $20 by November 2001 before climbing again. And finally, oil prices rose from $89 in December 2007 to $145 by July 2008 as the Great Financial Crisis raged on. Six months later, in December 2008, oil prices bottomed at $30, and another two months later, the 16-month drawdown was complete.
I write this not to instill fear but rather to encourage readers to find a way to protect their gains. We must realize the driving forces behind periods of outperformance and underperformance. For HDV, I believe it’s the combination of high energy exposure and low-beta stocks for the remainder of the portfolio. Only the latter is likely to be beneficial in a recession, and its benefits may be completely wiped out by the former.
Investment Recommendation And Conclusion
If you own HDV, I suggest taking some profits and investing the proceeds in a more diversified long-term choice like SCHD. The yield difference is minimal, the dividend growth is more robust, and SCHD is not as reliant on high energy prices to generate excess returns. As I hope I have demonstrated, oil prices are incredibly volatile during recessionary periods. If you’ve been fortunate to overweight the sector in the last year or so, it’s prudent to protect those gains. The only cautionary note I have is to not get out of Energy completely. A 10-15% allocation for an investor with average risk tolerance is appropriate, so if selling HDV will put you below that level, that’s not what I recommend.
In summary, HDV still looks attractive from a fundamentals perspective, but it’s riskier than usual now that recession risks are elevated. I’ve recommended buying HDV for over a year, but today, I have to take a step back and downgrade my rating to a hold. I hope I was able to explain why, and if you have any questions, please feel free to leave a comment below.
Be the first to comment