

EvilWata
Dear Partners and Friends,
The markets continued to sell-off in the second quarter, especially for internet-based businesses. This year continues to be the toughest stretch for us, since the Hayden’s inception. Inflation concerns and the resulting hiking of interest rates resulted in volatile markets in April and early May, but then this market angst started to subside in second half of the quarter.
This type of “choppiness” is normal for this phase of major bear markets, as it takes time for markets to find their footing. In fact, as noted in last quarter’s letter, 10 – 40% weekly moves is normal for stock prices in our sector, in the months surrounding a bear-market lows.
|
Time Period |
Hayden (NET)1 |
S&P 500 (SPXTR) |
MSCI World (ACWI) |
|
20142 |
(4.9%) |
1.3% |
(0.9%) |
|
2015 |
17.2% |
1.4% |
(2.2%) |
|
2016 |
3.9% |
12.0% |
8.4% |
|
2017 |
28.2% |
21.8% |
24.4% |
|
2018 |
(15.4%) |
(4.4%) |
(9.2%) |
|
2019 |
41.0% |
31.5% |
26.6% |
|
2020 |
222.4% |
18.4% |
16.3% |
|
2021 |
(15.8%) |
28.7% |
18.7% |
|
1st Quarter |
(39.2%) |
(4.6%) |
(5.7%) |
|
2nd Quarter |
(40.3%) |
(16.1%) |
(15.1%) |
|
2022 |
(63.7%) |
(20.0%) |
(19.9%) |
|
Annualized |
7.6% |
10.5% |
6.9% |
|
Total Return |
74.6% |
114.8% |
66.0% |
|
While the recent stability of our portfolio these last three months may provide hope that we may have already seen the worst, it’s likely that volatility will continue to be high for the rest of the year. The macro backdrop remains volatile, so it’s hard for investors to deploy capital in this environment – with recent statistics showing investor’s willingness to deploy capital remaining at record lows. Afterall, stock prices fluctuate with investor flows / demand in the short term.
However as the economic clouds eventually dissipate, I’m certain we’ll see demand once again for our companies’ stocks.
During this time period, it’s been encouraging watching our companies continuing to execute and grow. Some are gobbling up market-share as competitors go bankrupt (or at least financially constrained), while also accelerating their timeline to profitability. When this economic downturn eventually ends, we expect them to emerge in an even stronger position on the other side. This is what really matters for valuations, over the long-run.
While our companies continue to go on the offensive during this time period of weak share prices and competitors, we should be too. After reaching a high of ~30% cash as we repositioned the portfolio intra-quarter, we were able to opportunistically deploy this and ended with ~4% cash as of quarter end.
We’re seeing a lot of opportunities in the market today, within a 3 – 5 year investment horizon. In fact, I’ve been telling partners that our minimum bar today should be investments with the potential to “3x in 3 years”. Luckily, the fishing pool to find those types of opportunities is getting more fertile by the day. Over time, I anticipate discussing some of these new opportunities that have already joined our portfolio, in more depth. **
Geographic Allocation % As of June 30, 2022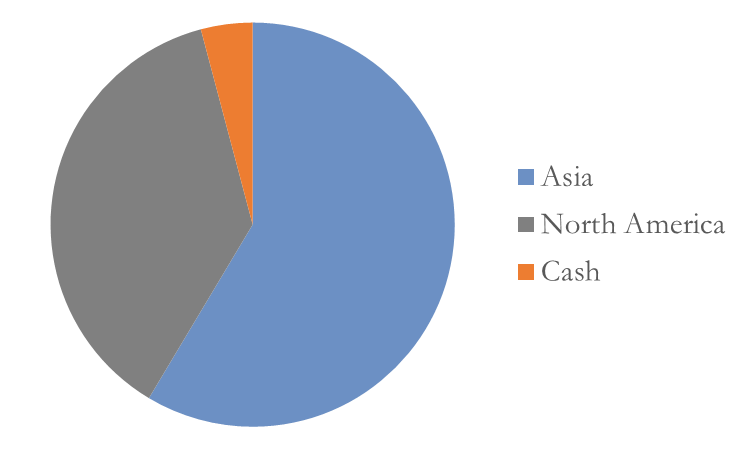
Our portfolio declined by -40.3% in the second quarter of 2022, versus -16.1% for the S&P 500 and -15.1% for the MSCI World indices. This brings our annualized return since inception, to +7.6%.
Our portfolio ended the quarter with ~59% of our assets invested in Asia, ~37% in North America, and the remainder in cash.
Ecommerce’s Covid Hangover
Back during the depths of Covid, in our Q1 2020 letter, I talked about how the next few years would accelerate the consumer habits and ecommerce adoption world-wide:
“To me, the safer (and potentially higher returning) investments in today’s market, are those companies that will benefit from the lasting change Coronavirus will have on consumer & business habits. These trends were already underway before the virus, but adoption has been accelerated by the wide-spread, suddenly “forced” need to operate in this new manner.
Many of these new habits / business models, are at an early stage of just low-single digit penetration within their industries. At such an early stage, consumer habits are just starting to get formed, so the primary hurdle is getting consumers to just try this new method.
The idea is that if the new business model is truly a superior proposition (i.e. a better mousetrap), the highest ROI is coaxing more mice into the trap and if they like it, to tell all their friends about how great it is (thereby creating a referral loop / social proof, which drives further acceleration of the trend)…
If history is any guide, there will be companies that adapt, and will emerge stronger during this recent crisis too. Once again, it’s the ecommerce industry that’s proving to be a shining example, given the tremendous growth we’re seeing globally in the past few months…
So we can see that around the world, these ecommerce businesses are all accelerating their growth rates, not decelerating. The commonality among all these companies, past and present, is that they provide tools / systems, that help other merchants to succeed…
And the biggest opportunity for investors, is in the earlier-stage businesses. This period will help accelerate their user adoption, and for certain companies, give them the “jump start” needed to achieve their marketplace “tipping point” / a sustainable business model. Logically, this should result in a higher valuation, since the odds of achieving sustainability are much higher, versus just a couple months ago…
I don’t know how long the virus will last, so betting on when Coronavirus-sensitive companies will return to “business as normal” seems foolish and mostly a timing bet (a race against time to avoid bankruptcy).
But in these former companies, we’re already seeing hard data on how consumers are behaving and how it’s impacting their financials. These online companies benefit the longer the virus lasts, by giving business / consumer habits a longer time to form.
In fact, a 2009 study found it takes ~66 days to form a new habit – coincidentally the length of the social distancing period in many countries already. And even if we go back to normal tomorrow, I think it’s
safe to bet that some of the habits formed during this period will be carried on & even accelerate into the future.”
Over the preceding two years, it looks like this insight was largely correct. In developed markets like the US, where ecommerce was an already established habit, ecommerce penetration accelerated even further, from ~18% prior to Covid to over ~25% during this period[1]. Similarly, China’s ecommerce penetration accelerated from ~28% to ~35% over this time period as well.
But in markets where ecommerce penetration was less established and required consumer education (i.e. the hurdle was getting people to try out shopping online for the first time, in hopes of creating a brand new habit), the acceleration was more dramatic. Due to Covid restrictions and lockdowns, consumers in these markets were forced to break old habits, and embrace this unfamiliar (but superior) method of shopping.
We saw ecommerce penetration increase from ~5% pre-Covid to ~8% in Southeast Asia, and ~4% to ~7% in Latin America as a result[2]. So while already established ecommerce markets like US and China increased penetration by 25 – 39%, emerging markets like Latin America and Southeast Asia grew even quicker, by 67 – 75%.
However as Covid comes under control worldwide and consumers return to their usual lifestyles, global ecommerce growth is slowing. The past two years have experienced extraordinary growth, and it’s hard for those growth rates to continue in a world that’s reopening and offering more avenues for consumers to spending their money, outside of online channels.
For example, Amazon (AMZN) just reported one of its lowest growth rates in recent history, at +10% y/y growth in its North American retail division during the second quarter of 2022. This is compared to +44% y/y and +21% y/y during the similar period in 2020 and 2021, respectively. Shopify likewise reported slower +16% y/y revenue growth for 2Q 2022, vs. +97% y/y in the same quarter in 2020 and +57% y/y in 2021.
On the other side of the world, Alibaba (BABA) just reported its first negative revenue growth quarter, declining -1% y/y for its Chinese ecommerce division[3]. This compares to +34% y/y for the same quarter in 2020, and +35% y/y in 2021.
Nascent ecommerce markets are doing better, where growth rates seem to have based higher, despite “post-Covid normalization”. In Latin America, MercadoLibre (MELI) ecommerce revenues grew +23% y/y in the second quarter, vs. +149% in Q2 2020 and +101% in Q2 2021. And in Southeast Asia, Shopee reported +51% y/y revenue growth for Q2 2022, vs. +188% in Q2 2020 and +161% in Q2 2021[4].
While there’s deceleration across the board, astute readers will also notice that there’s a divergence between ecommerce growth rates in developed markets vs. those in emerging markets, where ecommerce penetration is still low. Not only did these newer ecommerce markets accelerate quicker during the Covid years, but they’re also showing the ability to hold onto more of these gains, despite the high base after the last two years.
This difference in these growth rates make sense, since the rise in penetration was driven by two components:
- buyers who traditionally would prefer to purchase offline, but were forced online due to Covid lockdowns, and
- buyers who were brand new to ecommerce, and were discovering a new way to shop.
The former cohort is transient, while the latter is structural due to these newly formed consumer habits.
In developed markets, ecommerce was already familiar to most consumers, so unfortunately the bulk of Covid gains in these countries came from the first cohort. These gains were transient because of this, as shoppers returned to offline options soon as the lockdown measures were lifted.
A few weeks ago, Shopify described this exact scenario in a memo to employees:
“When the Covid pandemic set in, almost all retail shifted online because of shelter-in-place orders. Demand for Shopify skyrocketed. To help merchants, we threw away our roadmaps and shipped everything that could possibly be helpful…
Before the pandemic, ecommerce growth had been steady and predictable. Was this surge to be a temporary effect or a new normal?And so, given what we saw, we placed another bet: We bet that the channel mix – the share of dollars that travel through ecommerce rather than physical retail – would permanently leap ahead by 5 or even 10 years. We couldn’t know for sure at the time, but we knew that if there was a chance that this was true, we would have to expand the company to match.
It’s now clear that bet didn’t pay off. What we see now is the mix reverting to roughly where pre-Covid data would have suggested it should be at this point. Still growing steadily, but it wasn’t a meaningful 5-year leap ahead. Our market share in ecommerce is a lot higher than it is in retail, so this matters. Ultimately, placing this bet was my call to make and I got this wrong. Now, we have to adjust.”
US Ecommerce Penetration Reverting Back to Pre-Covid Trend (Source: Shopify)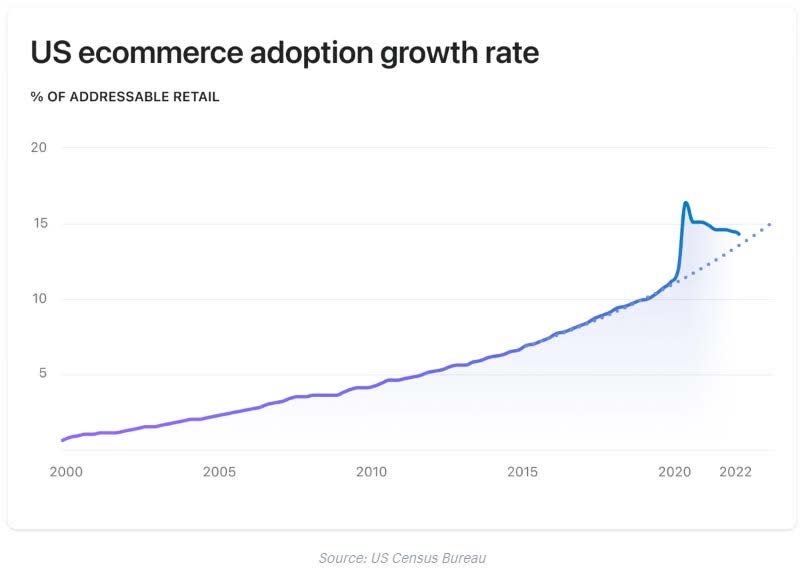
In contrast, we’re seeing these Covid gains prove to be “stickier” in emerging markets, with ecommerce penetration remaining at these higher levels. This is likely because most of these Covid gains are instead attributable to the second cohort of users – consumers who had never used ecommerce before, but were forced to give it try due to lockdowns and amid a lack of brick & mortar options. Once they tried this superior way of shopping though, they stuck around inside this “mousetrap”, and continue to spend more of their budget within this channel.
GMV=[TOTAL RETAIL SALES] X [ECOMMERCE PENETRATION RATE] X
[COMPANY’S MARKET SHARE]
Essentially, if I were to generalize (and this really is a broad generalization, since individual country / company dynamics are so different), this is how I see the components of GMV differing across the largest ecommerce companies in developed and emerging markets.
Ecommerce in Developed Markets Ecommerce in Emerging Markets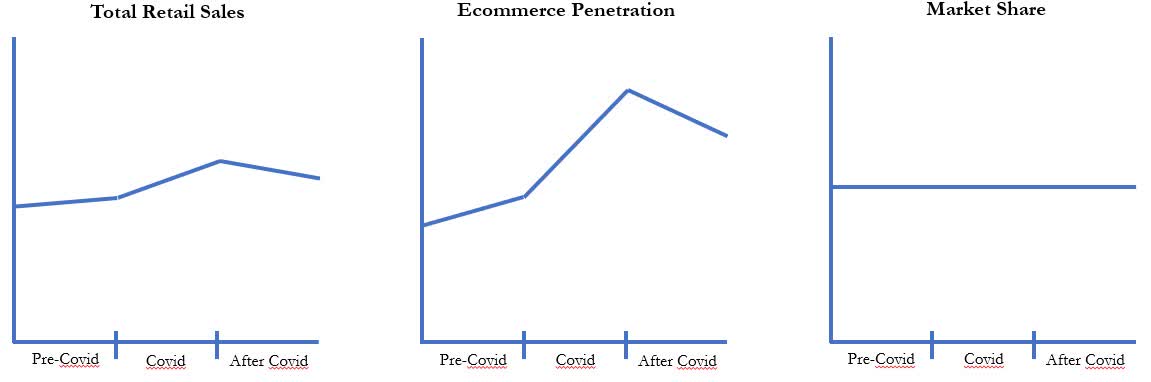
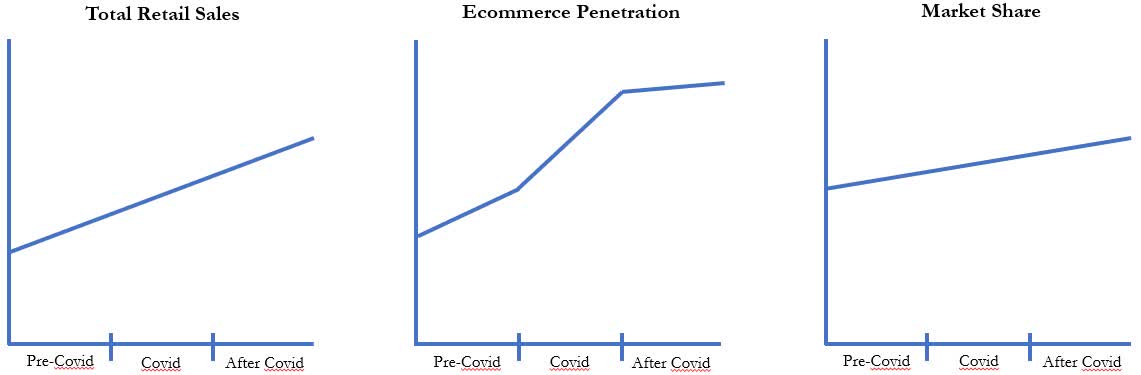
In developed markets, ecommerce is already well established, with stable market share among the leading companies, and demand reverting back to pre-Covid trends. Meanwhile in emerging markets, Covid restrictions accelerated the number of consumers discovering ecommerce for the first time, and these scale benefits further strengthened the position of the leading online platforms.
The best way to see this “stickiness”, is via how many times customers order from a platform each month. In effect, it’s a measure of “addiction” / customer loyalty to a platform, and how ingrained it is to their purchase habits.
For example, Shopee in Southeast Asia is expected to have grown their GMV by +370% in the last three years. Before Covid, Shopee sold ~$17BN worth of items in 2019, while they should sell close to ~$80BN this year.
Most importantly, this growth didn’t just come from traditional offline shoppers, unwillingly forced online during Covid (i.e. increasing the breadth of the customer base). Rather, a meaningful driver was existing Shopee customers ordering more frequently / deepening their relationship with the company even further during this period (i.e. deepening the loyalty of the customer base).
This second driver is much more lasting and impactful to the long-term value of the business model, than the first.
We can see this best in the increased order frequency rates over the last three years. For example in Q2 2020, the company stated on their earnings call:
“…in terms of purchase frequency, before we reported more than 4x [per month]. And this – we’re seeing more than 5x a month on average. In some markets, like Indonesia, [it is] getting closer to 6x a month, and this is sustaining into – even after the lockdown period.” – Q2 2020 Earnings Call
Prior to Covid, purchase frequencies were 4x a month and increased to 5x a month during the depths of the pandemic. If these new customers that were gained during Covid were transient (i.e. the first cohort), we should expect them to purchase less frequently from online platforms, after lockdowns subsided. Instead, what we saw was a further increase in purchase frequency:
“In terms of engagement, our buyers shopped on Shopee over 6x a month on average in the fourth quarter, with Indonesia’s monthly order frequency exceeding 8x.” – Q4 2021 Earnings Call
This increase in order frequency is happening, despite lockdowns significantly loosened up by the end of last year, and the platform continuing the attract new buyers[5]. At 6x purchases per month, this means that the average Shopee consumer is receiving a package every 5 days (or in Indonesia’s case, every 4 days)[6]. It signals that the free “customer acquisition” provided by Covid has lasting positive impact on the platform, these users are now “addicted”, and are likely now a permanent part of the platform’s user base.
This is a huge benefit for nascent ecommerce marketplace businesses, since there are network effects at play. Generally, the largest marketplaces have advantages versus subscale competitors, since a larger, captive customer base is able to attract a wider variety and larger number of sellers, who in turn compete against each other on price to win orders from this customer base.
This creates a flywheel effect, as new customers will naturally explore the largest online marketplaces first – given the wider variety of items (more likely to find what they’re looking for), and better brand reputation / trust (new customers likely know friends & family who have used the platform successfully).
If the influx of new customers acquired during the last two years of Covid are indeed sticky, this significantly de-risks the business model for emerging ecommerce businesses. If these new customers can bring them past their “tipping point”, then the flywheel nature of these network effect kick in, the businesses have a far higher chance of self-sustainability, and becoming the leader in a “winner-take-most” market like ecommerce[7].
We’ve seen scenario play out with Shopee already. While Shopee and its competitor Lazada (owned by Alibaba) were of similar size a few years ago, Shopee was already starting to gain the lead by 2019. And during Covid, this lead widened even further, with Lazada reporting GMV that was only ~1/3rd that of Shopee by 2021[8]).
Even in the past year as lockdowns subsided further, these gains remained. During Q4 2021, Shopee reported close to +100% y/y order growth, while Lazada did +54% y/y. By Q1 2022, this gap accelerated even further to +72% y/y for Shopee vs. just +54% y/y for Lazada. This quarter, Lazada reported a paltry +10% y/y order growth, while Shopee is reported +41% y/y order growth, despite already having ~55% market share.
So while nascent ecommerce businesses like Shopee certainly didn’t plan for Covid, they nevertheless used the opportunity presented to structurally strengthen their business models and get them past their marketplace “tipping point” (as evidenced by the growing lead vs. competitors), to win in a traditionally “winner-take-most” market.
Now that clear leadership is established, with ~55% market share in SE Asia and ecommerce penetration soon approaching double-digits, the land-grab phase for new ecommerce buyers is over. Now it’s time for Shopee to start monetizing this addicted user base, and swiftly increase its take-rates[9]. Adj. EBITDA margins have improved by +61% since 2019, and are rapidly improving / on track to show profitability within the next 12 – 18 months.
Thus as the economy normalizes in a post-Covid world, ecommerce companies will suffer a “Covid hangover” from this slowing growth. However within this, it’s also becoming more and more apparent that there’s a divergence going on within the sector.
For some companies, like those in mature markets with most consumers already familiar with their offerings but hadn’t previously signed on for one reason or another (thus indicating a broken or already saturated mousetrap), the last two years will prove to be a temporary sugar high.
Other companies that were able to use this period to accelerate adoption and expedite their timeline to sustainable scale & profitability, have permanently strengthened the value of their businesses. These are the nascent business models that had already built a sticky “mousetrap”, and the primary bottleneck was just getting enough new users to discover it (which Covid solved).
Since stock prices follow the business value creation over time, we should expect some stocks to return to their previous “pre-Covid” trajectory, while others will be permanently based higher. It seems that investors are still trying to distinguish between the two, as they work through the messy results / data of the next few quarters. But over the next few years, we expect the structural winners who took advantage of this period to create last change, to become more obvious to most investors. Over time, this will reflect in their valuations.
On a side note, also I found it interesting that sell-side analysts also seem to be modeling these lower ecommerce growth rates into perpetuity, even after the current economic slowdown / “Covid hangover” is expected to end. But if we follow the prior recession in 2008-09 as a case study, revenue growth slowed for both Amazon and Mercado Libre during the 2008-09 period, and then quickly reaccelerated from the mid-20%’s y/y growth to the high30%’s y/y growth by 2011. Retail sales is closely correlated with GDP growth after all…
If we’re correct about the underlying cause of Shopee’s growth deceleration, we should see a similar bump up in the next two years. However sell-side estimates aren’t modeling in this acceleration at all, with estimates hovering in the mid-20% y/y range and slowly declining in the medium-term. This feels to us, as yet another example of markets having trouble modeling non-linear change when valuing these companies.
PORTFOLIO REVIEW
Coinbase (COIN): The crypto ecosystem moves extremely quickly, and there’s been many new developments since we first invested in Coinbase, a year ago.
Most notably, crypto market cap has declined from a peak of ~$3 Trillion last fall, to ~$1.1 Trillion today (a -63% decline, and -72% peak-to-trough). Crypto is a volatile asset class, and has experienced many draw-downs of similar magnitude in the past. For example, Bitcoin was down -93% during 2011, -85% from 2013-15, and -84% from 2017-18. In this context, the latest draw-down is a pretty normal outcome for this emerging asset class.
A large reason for this volatility, is simply because there aren’t any major “real-world use cases” for the asset just yet. In our letter outlining the investment last year, we wrote that crypto is still “in the middle of ‘crossing the chasm’ into mainstream adoption & use cases, which will result in millions of mainstream users needing to transact crypto in some form”
This adoption is progressing, and there are a variety of applications that have shown real utility over the past year. However, since it’s still early days, the bulk of crypto trading is still conducted for speculation, instead of utility. This will undoubtedly shift over time, as the crypto ecosystem continues to develop more utility over the coming years.
But in the meantime, this means that when bear-markets hit, retail interest in trading crypto dies down, since there’s no daily use case for crypto just yet. The only source of demand for crypto (i.e. speculation) dries up, leading to prices falling as a result.
Until crypto “crosses the chasm” into mainstream adoption and daily utility, Coinbase’s business model will remain volatile – and even more so than its competitors.
Lately, there have been headlines speculating on Coinbase’s demise, most of which cite Coinbase’s declining market share relative to other exchanges. However this is an extremely inaccurate comparison, since we’d argue that Coinbase is in a very different end market, than global exchanges which cater predominantly to institutions, and also lie outside of US regulations (or any country’s regulations, for that matter).
Competitors such as FTX or Binance derive the bulk of their business from institutions / cryptonative “whales”, while Coinbase derives ~77% of its revenues from retail users that only trade a few hundred dollars at a time.[10] These institutions are in the business of trading crypto, so they will continue to trade regardless of the market environment. Meanwhile, retail users are far more finicky, and will trade / speculate when prices are rising, and lose interest when prices are declining.
“We have about four times [Coinbase’s] daily trading volume [on a global level] and about 3% of their user base.
So it’s a factor of 100 difference in volume per user. They [Coinbase] have done spectacularly at the long tail retail consumer, and we have done much better at the more sophisticated, more highly engaged users who trade larger volume each.” – Sam Bankman-Fried, Founder of FTX
These institutions and whales tend to trade on offshore exchanges, away from US regulations, since they can access a wider variety of products and leverage. Thus as a benchmark of Coinbase’s competitive position, it’s a much fairer comparison to judge it versus other US-based exchanges, such as Kraken, FTX US, Binance US, or Gemini[11]. For further information on this misperception, we discussed this dynamic in our original Coinbase memo last year[12].
On this metric, we can see that Coinbase is still by far the leading exchange. For example, according to CoinGecko, Coinbase is currently doing ~$2.4BN in daily volume, versus Kraken at just ~$600M, Binance US at ~$500M, and FTX US at ~$260M.
US Crypto Exchange Market Share (Source: CoinGecko (LINK); Screenshot as of August 15, 2022)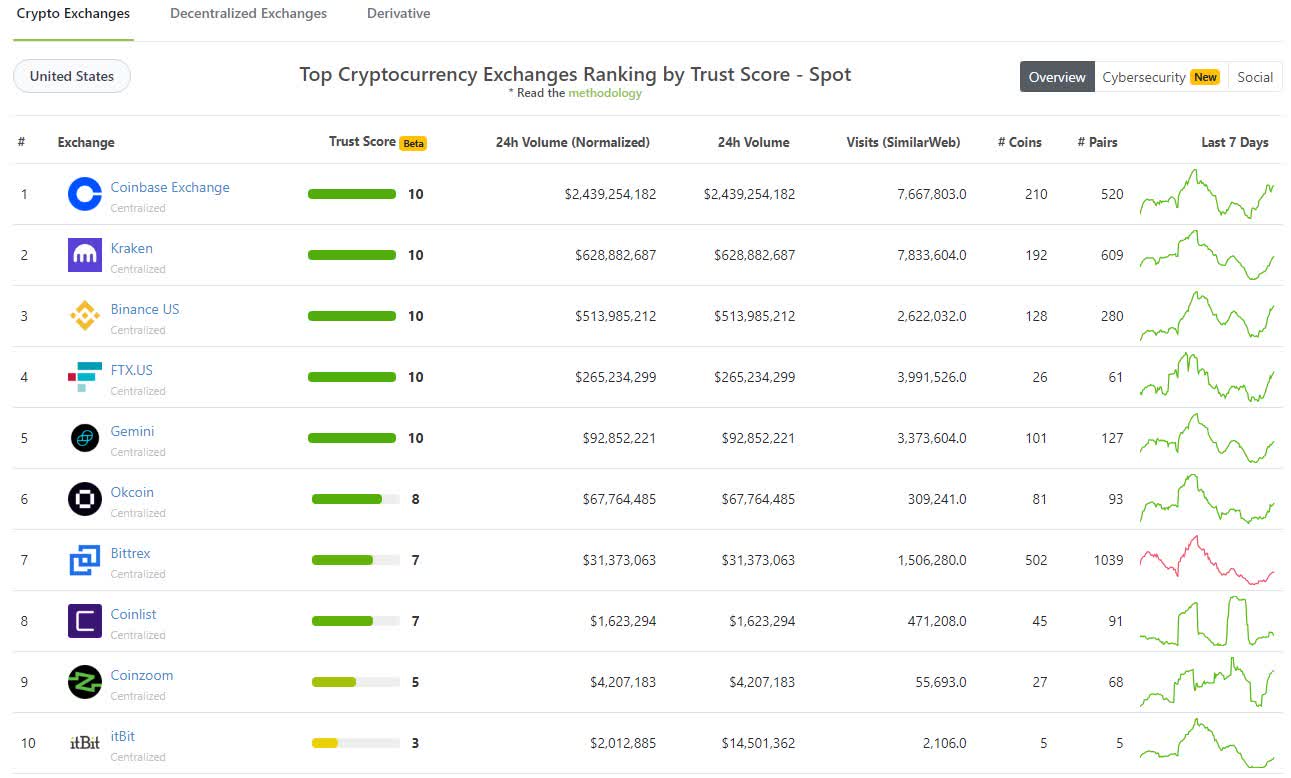
We also showed a similar snapshot last year. If you compare that September 20, 2021 snapshot to the one above (see pg. 29), you’ll see that Coinbase has actually done a great job of maintaining its market share during this bear market.
It’s still ~4x larger than the next largest competitor, and also ~1.6x larger than the next 4 competitors combined. Thus even though the total “pie” (i.e. crypto trading volumes) has shrunk, Coinbase has actually maintained its relative size of that pie. It’s certainly not losing its competitive position, as media headlines would have you believe.
In the meantime, Coinbase has been using this time to improve its products and simplify the user experience, in preparation for the next phase of mainstream adoption. For example, Coinbase Wallet was just redesigned this quarter, and now supports seven different blockchains, so more crypto assets can be held all within one account. Compare this to its primary competitor – Metamask – which still doesn’t support Solana, and users still need to have a separate wallet for those assets.
We’ve invested in Coinbase, based upon the thesis that eventually crypto will be used for daily transactions – and it’s hard for us to imagine a world, where everyday consumers will want to switch back and forth between multiple wallets, when they can use Coinbase as a one-stop-shop.
Considering historical technology adoption has shown that mainstream users care most about simplicity and ease-of-use, this development puts Coinbase on track to eventually become the de facto crypto wallet used for daily transactions.
On top of this, we were encouraged to see that Coinbase managed to avoid the entire debacle around the Three Arrows Capital blowup. Three Arrows (or “3AC”, as it’s known) was one of the largest hedge funds in the crypto space.
In June, the firm started facing liquidity issues, as crypto prices fell and it found itself over extended on leverage. With over $10BN in assets at its peak, the firm’s collapse managed to take down several notable brokers and lenders who provided 3AC with loans, including the bankruptcy of Voyager Digital and Celsius, resulting in a “mini-Lehman Brothers” type event for the space. Coinbase meanwhile avoided this debacle, which we believe is another indication of its conservative culture (whether in launching new products, lending, dealing with regulators, etc.).
We believe that over the long-run, this type of behavior will only build trust with customers and stakeholders alike, which is vitally important for a firm that seeks to safe-keep the assets of hundreds of millions of individuals and institutions.
While all this was going on, Coinbase’s share price reached an astonishing ~$8BN valuation ($11BN market cap – $3BN of net cash). The company earned $3.6BN in net income last year, so shares were priced at just ~2.2x P/E (2021), for a company that is just getting started in this emerging field[13].
Obviously, the financial results of Coinbase will be volatile, while transactions are still primarily used for speculation. We see the company as essentially a tax on the crypto ecosystem, based upon its dominant market position as a fiat-on ramp & US exchange. The size of that ecosystem will ebb & flow, and is largely out of Coinbase’s control. In good years the company will make several billion in profits, and in bear markets (like today) the company is guiding to a -$500M loss.
Early in the quarter, it became clear that the crypto market would soon follow the broader equity markets into a bear market. And given the reflexivity in Coinbase’s business model, we felt it was prudent to cut a significant portion of the position. We sold these shares ~$150. During the subsequent draw-down, we started to build this position back up as the aforementioned valuation became too cheap to pass up. While we missed the absolute lows, we did manage to re-build the position at a >50% discount to where we previously sold it.
It’s still a relatively small position in our portfolio, given the nascent stage & inherent risk of the industry. However, we’re excited to watch this business develop over the next decade. If we’re correct in the trajectory of the crypto industry and Coinbase’s position within it, they could very well end up being one of the most important companies of the next decade.
CONCLUSION
The next few quarters are undoubtedly going to be choppy, given the fundamental undercurrents in the global economy, combined with a negative backdrop for growth equities.
For example, one question investors are grappling with, is whether the lower growth rates mentioned previously simply a function of a Covid-hangover and set to re-accelerate in a better economic environment? Or are these new structural trends, and we should expect lower growth for many years to come? While our analysis indicates the former, others in the market who lack this conviction may wait to invest until the coast is clear – thus causing stock prices to lack direction in the near-term.
However, we’re confident that this too shall pass. Over time, the only things that matter for our portfolio are 1) are our companies have a strong enough value proposition and balance sheet to withstand economic hurricanes? 2) Will they generate enough cash over time, to produce an attractive return to their investors? And perhaps most importantly, 3) Do we as shareholders have the stomach and will power to stay the course, until we can reap the rewards?
I firmly believe the answer is yes to all of the above. But getting there is going to require patience, and the bravery to see a world beyond the immediate choppy waters we’re navigating through.
This semester, we also welcome Bohan Xue, who is joining us as a research intern. Bohan is currently completing his second year at Columbia Business School, and just was accepted into its prestigious value investing program. Before Columbia, Bohan was the founder of a social media marketing agency, based out of Shanghai. We welcome him to the team.
Sincerely,
Fred Liu, CFA | Managing Partner | fred.liu@haydencapital.com
Footnotes
|
[1] Note, these figures will differ depending on the data source, and how “retail sales” is defined. However, the large step-up in penetration is true, regardless of the source. [2] Again, exact percentages will differ by methodology and data source. [3] See pg. 7 of Alibaba’s June quarter earnings report (LINK). [4] Revenue growth is higher than GMV growth, due to the added benefit of increasing take-rates. [5] New buyers drag down the overall average purchase frequency, since new users take time to build trust with the platform and ingrain this new way of shopping into their habits. The company no longer discloses active buyer counts. But according to alternative data, the company was still growing new buyers ~20 – 30% y/y during this period. As such, the maintenance of 6x purchase frequency is impressive. [6] Compare this to Amazon Prime’s far lower 2.5x orders a month, despite Amazon also locking in their customers via a paid membership plan. [7] I first discussed the concept of this “tipping point” for marketplace businesses, in our Q1 2019 letter (LINK). [8] Lazada reported $21BN in GMV in fall 2021, vs. Shopee at $56BN for the same time period (LINK). [9] Take-rates should increase by ~2% this year (from ~7.3% to ~9.1%), and predominately from high-margin commission and advertising revenues. [10] “Whales” refer to wealthy individual traders, who trade in large sums. [11] FTX US and Binance US are subsidiaries of FTX and Binance, respectively. Since these entities operate under US regulations, they aren’t able to offer the same variety of crypto assets or products as their parent companies. [12] Please see page 27, under the “Exploring Coinbase’s Market Share (And Why We Differ From The Street)” section. [13] Although admittedly, last year was a very good year for the crypto markets, so investors shouldn’t expect these earnings on a normal basis.
|
Editor’s Note: The summary bullets for this article were chosen by Seeking Alpha editors.
Be the first to comment