

GOLD PRICE OUTLOOK:
- Gold prices rebounded slightly during APAC trading hours as Treasury yields retreated
- Markets remained jittery about Fed tapering risk following hawkish comments from an official
- The world’s largest gold ETF saw continuous outflow, albeit at a slower pace
Gold prices rebounded modestly early in the APAC trading session as the 10-year Treasury yield pulled back from Friday’s high. Risk appetite appears to be subdued as Chinese and Japanese markets are closed for holidays. Still, the market remained jittery about potential Fed tapering after Robert Kaplan, the president of the Dallas Federal Reserve, said it’s time to start debating a reduction in bond purchases.
This came against the backdrop of strong Q1 corporate earnings anda string of robust US economic data. More than 86% of S&P 500 companies have beaten analysts’ forecast so far in the earnings season, underscoring strength in the underlying economy. The US core PCE price index climbed 1.83% YoY in March, marking the highest reading seen since February 2020. Personal income surged 21.1% MoM, beating expectation of 20.3%. Following Kaplan’s comment, the DXY US Dollar index surged 0.73% to 91.29 late Friday, exerting downward pressure on gold prices.
As the US economic recovery gains momentum, markets may start to seriously consider tapering risk even though Fed Chair Jerome Powell reiterated his dovish stance in public appearances recently. Although the conditions for the Fed to consider interest rate hikes are still far from met, improving fundamental metrics may point to a faster pace of tightening in the asset-purchasing program.
The DXY US Dollar index may have reversed its downward trajectory after Friday’s surge, weighing on precious metal prices. The two historically demonstrate a strong negative correlation (chart below).
Gold Prices vs. DXY US Dollar Index
Source: Bloomberg, DailyFX
The world’s largest gold ETF – SPDR Gold Trust (GLD) – saw continuous outflows in April, but the pace of redemption appeared to have slowed significantly. The number of GLD shares outstanding declined 6.9 million in April, compared to a 19.1 million decrease seen in March. This suggests that buyers are becoming more active in the bullion market compared to the sellers. Gold prices and the number of outstanding GLD shares have exhibited a strong positive correlation of 0.83 over the past 12 months. Therefore, a decelerating pace of net redemption can be viewed as a bullish signal.
Gold Price vs. GLD ETF Shares Outstanding – 12 Months
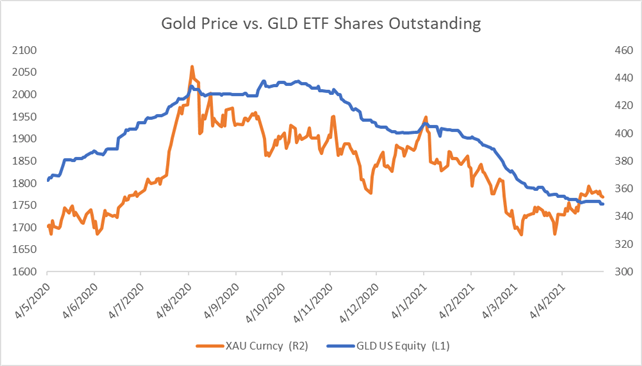
Source: Bloomberg, DailyFX
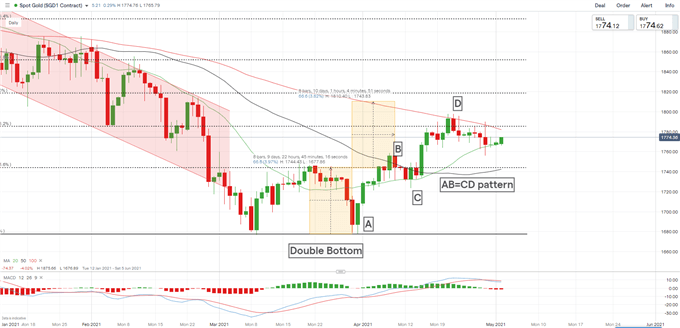
Technically, gold has likely formed a bearish “AB=CD” pattern as highlighted in the chart below. An “AB=CD” pattern is characterized by parallel “AB” and “CD” legs of similar timeframe and magnitude. A pullback from the “D” point is likely following the completion of the pattern.
On the gold chart, the “AB=CD” pattern is part of a larger “Double Bottom” pattern. This suggests that the overall trend remains bullish despite a near-term pullback. An immediate resistance level can be found at 1,785 (the 38.2% Fibonacci retracement), whereas an immediate support level can be found at the 20-day SMA line (1,767).
Gold Price – Daily Chart
— Written by Margaret Yang, Strategist for DailyFX.com
To contact Margaret, use the Comments section below or @margaretyjy on Twitter
Be the first to comment