

DNY59/E+ via Getty Images
I don’t have a definitive answer to the question posed above, but I think it is fair to say that markets traded last week as if the answer is “yes”. In Europe, bund yields plunged below 1.5%, after touching almost 2% earlier in the month, and Dec-22 Euribor futures are now pricing in 50bp less tightening than immediately after the June ECB meeting. The catalyst: a below-consensus PMI report and news that Russia is slowly but surely turning off gas supply to Europe. In the UK, bond yields have fallen too, in response to a below-consensus core CPI print. And finally, in the US, Jerome Powell’s comment, in a testimony to Congress, that a recession is “a possibility” as the Fed embarks on a series of rate hikes and QT similarly drove down bond yields across the curve.
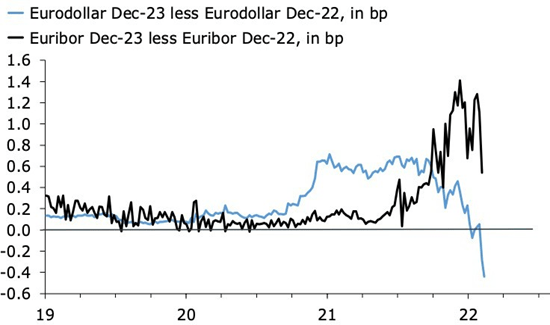
The move in cash bond yields really don’t do the shift justice. The first chart below shows that the fall in two-year yields in the US, UK and Germany is hardly visible. The trend is still firmly up. Rates futures, however, tell a more interesting story. The second chart below shows that the Dec-23-Dec-22 curve in the US is now inverted by a whopping 40bp, a classic sign that markets are worried that the Fed is about to hike the economy into recession. The equivalent spread in Europe is not quite there yet, but it flattened sharply last week.
Equities have enjoyed this shift in rates, evidence of the perennial optimism and hope in this market. It’s difficult to tell whether equities are rejoicing in the fall in yields, ignoring recession risks, or whether they’re celebrating the signal from bond markets that there might just be a central bank put out there somewhere. Or maybe, stocks are just oversold.
Fig. 01: Hardly A Scratch (Author) Fig. 02: Dec-23-Dec-22 Is Now Inverted (Author)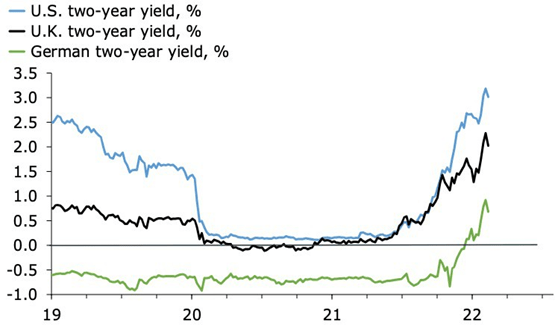
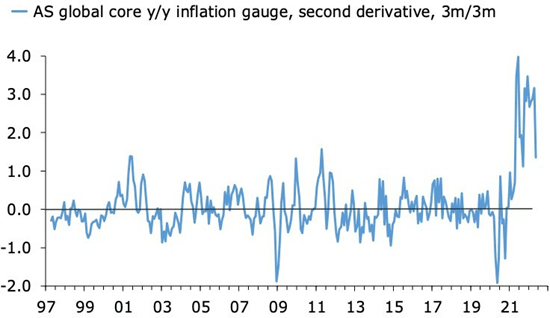
The next two charts illustrate the challenge at hand. Inflation in the developed world has soared, both headline and core, and when everyone thought it could rise no further, it soared again.Team transitory has been humbled, and central banks are now in panic mode.
In this sense, early Q2 evidence that the rate of acceleration in core inflation is easing is welcome but far from conclusive. The second chart shows that the 2nd derivative of y/y core inflation – here the US, UK, Germany, Italy, France and Spain – remains comfortably outside its historical range. We need more evidence to confirm whether it is now falling towards something resembling its trend before Covid and the war in Ukraine.
Surveys are similarly indecisive. They remain consistent with still-high inflation, but they also suggest that the rate of acceleration is now fading. I’ve had to re-do my global indices for this post, but the two charts below are in line with representations that I have used before.
Fig. 03: Panic Mode Numbers (Author) Fig. 04: A New Regime? (Author)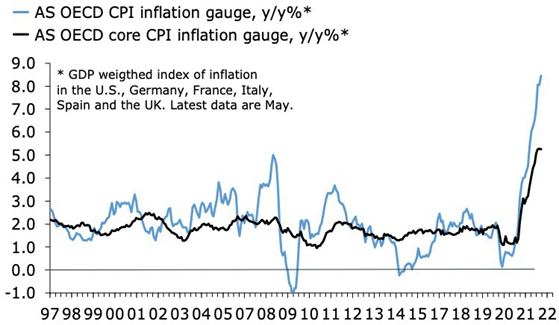
The first chart shows that inflation pressures in manufacturing or goods are now visibly rolling over, a shift mainly attributable to a sharp fall in Chinese core producer price inflation. Selling price surveys in US and European goods markets are softening too, but only marginally. They remain consistent with inflation far above comfort levels for central banks.
In services, the surveys point to clear evidence of sticky prices, a message that is increasingly clear in the hard data. See this great Twitter thread by @GeneralTheorist for a good primer.
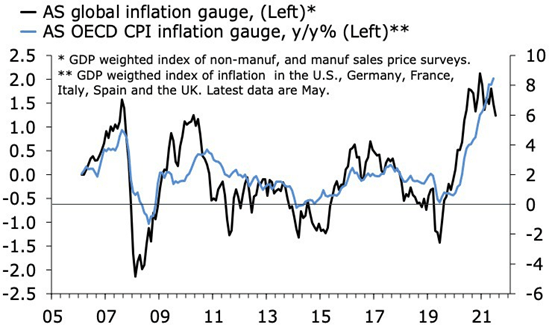
The second chart combines the data for manufacturing and services to suggest that my OECD inflation gauge, currently running at 8.5% y/y, will ease over the summer to around 6%.
Fig 05.: Goods Inflation Is Rolling Over (Author) Fig. 06: A Peak? (Author)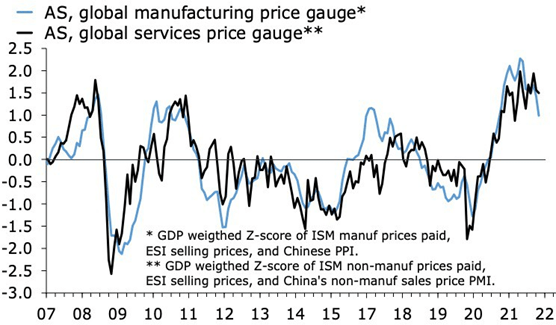
For markets and central banks panic-stricken over inflation, such a shift could be a catalyst for a change in story, not to mention the pace of monetary tightening, both actual and implied by futures. It is exactly this message that markets sent last week. I am not sure, however, that a dip inflation from 8% to 6%, or even 5%, would be enough for a lasting shift towards a bullish trend in risk assets. We might find that a peak in inflation fears is replaced by a general fear of economic slowdown and recession.
Editor’s Note: The summary bullets for this article were chosen by Seeking Alpha editors.
Be the first to comment