

jetcityimage/iStock Editorial via Getty Images
Introduction
Alphabet has many diverse product brands, including security companies, phone hardware, Nest, Fitbit, etc. Google is the main driver for all revenue, so that this article will refer to that instead of Alphabet. Google is about advertising with high-profile platforms, including its search engine, cloud solutions, and YouTube. Google also dominated in the mobile space with the Android operating system along with its line of phones.
Fundamental shows long-term solid growth with some short-term weakness for market entry potential according to this article’s technical analysis.
Fundamentals
Ratios
Current and quick ratios have been dropping since 2017. The quick ratio was weakest in the last two years during the pandemic. However, net income growth and gross profit growth were the strongest in the previous year.
Despite today’s earnings report, it is surprising to see YouTube’s growth decline, which hurts Google’s outlook. Heated competition from TikTok does not help in this video platform space. As hinted here, Google may go into short-term cost-cutting mode, including hiring freezes and potential job cuts. This should immediately affect Google’s stock price positively in the coming weeks.
|
2017 |
2018 |
2019 |
2020 |
2021 |
|
|
Period |
FY |
FY |
FY |
FY |
FY |
|
Current ratio |
5.140 |
3.919 |
3.374 |
3.067 |
2.928 |
|
Quick ratio |
4.986 |
3.765 |
3.254 |
2.957 |
2.800 |
|
Cash ratio |
0.443 |
0.482 |
0.409 |
0.466 |
0.326 |
|
Revenue growth |
0.228 |
0.234 |
0.183 |
0.128 |
0.412 |
|
Gross profit growth |
0.184 |
0.184 |
0.164 |
0.087 |
0.500 |
|
Ebit growth |
0.102 |
0.007 |
0.301 |
0.204 |
0.909 |
|
Operating income growth |
0.102 |
0.007 |
0.301 |
0.204 |
0.909 |
|
Net income growth |
-0.350 |
1.427 |
0.117 |
0.173 |
0.888 |
Enterprise
As with other big tech companies, Google also shows solid trends along with its market cap.
|
2017 |
2018 |
2019 |
2020 |
2021 |
|
|
Symbol |
GOOG |
GOOG |
GOOG |
GOOG |
GOOG |
|
Stock price |
58.185 |
54.453 |
72.792 |
91.787 |
133.290 |
|
Market capitalization |
806.494 B |
756.973 B |
1.008 T |
1.250 T |
1.775 T |
Estimate
Like any other big tech, Google’s net profit and revenue will double over the next five years. In addition, there is a growing EBITDA metric which shows a strengthening forecasted stock price.
|
YEARLY ESTIMATES |
2022 |
2023 |
2024 |
2025 |
2026 |
|
Revenue |
288,204 |
319,223 |
357,111 |
407,780 |
447,085 |
|
EPS |
5.15 |
5.96 |
6.77 |
8.03 |
9.06 |
|
EBITDA |
115,023 |
128,313 |
145,798 |
165,250 |
182,329 |
|
Net Profit |
67,629 |
75,810 |
86,584 |
99,879 |
110,500 |
Risk is Mixed with Strong Insider Selling
Price Target
It is rare to see how analysts’ mean price target is always on the mark. Even after Google’s stock split, the price targets are on par with current prices.
Target GOOG (custom platform)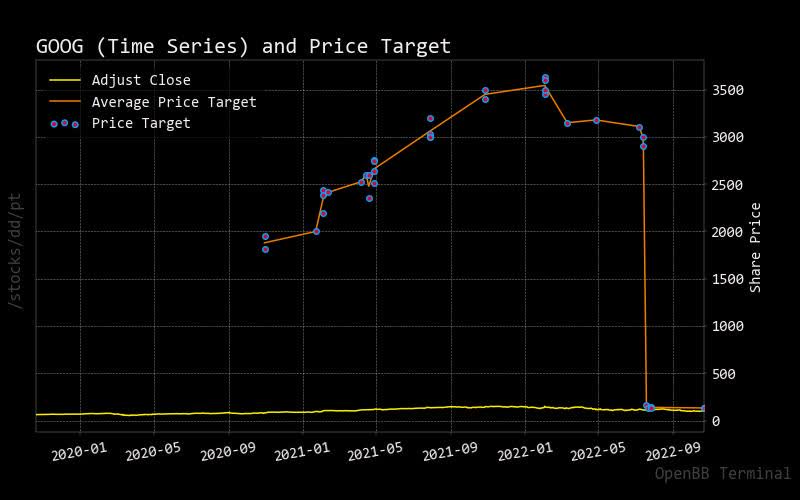
Source: Business Insider
Recommendation
There is a manageable set of recommendations with buys. As you can see, several analysts have a neutral rating which shows there is not an upward trend in the near term. Therefore, it might be wise to seek those companies for better performance than competitors. Some even pay dividends, whereas Google does not.
|
Interval |
RECOMMENDATION |
BUY |
SELL |
NEUTRAL |
|
One month |
BUY |
16 |
2 |
8 |
|
One week |
BUY |
14 |
2 |
10 |
|
One day |
BUY |
16 |
5 |
5 |
Short Volume vs. Total Volume
Google shows lower volume than other stocks analyzed but shorting remains below 50% of total volume. It peaked slightly a few months prior which hints at a weakening stock price. So, one needs to be careful with this stock price since short-term fundamentals are not as strong.
Trading Volume GOOG (custom platform)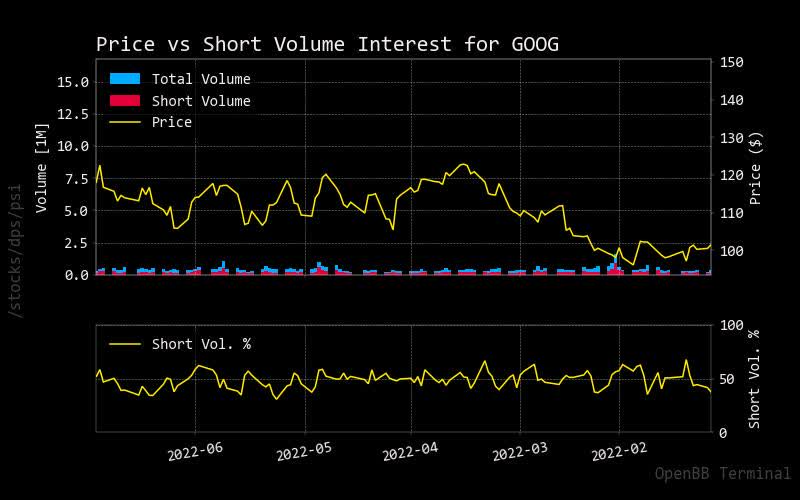
Source: Stockgrid
Insider Stats
Most insider stats show that recent selling activity indicates a weak price, with all executives selling. There has been no indication of anyone buying, so this is another trustworthy indicator for being cautious with this stock.
|
X |
Filing Date |
Trading Date |
Ticker |
Insider |
Title |
Trade Type |
Price |
Quantity |
Owned |
Delta Own |
Value |
|
|
0 |
nan |
2022-10-06 15:55:51 |
2022-10-05 |
GOOG |
Schindler Philipp |
SVP, Chief Business Officer |
S – Sale |
$100.80 |
-76,678 |
672,945 |
-10% |
-$7,729,104 |
|
1 |
nan |
2022-10-05 21:37:40 |
2022-10-04 |
GOOG |
O’Toole Amie Thuener |
VP, Chief Accounting Officer |
S – Sale |
$101.04 |
-855 |
58,840 |
-1% |
-$86,389 |
|
2 |
nan |
2022-10-04 16:49:51 |
2022-10-03 |
GOOG |
Raghavan Prabhakar |
SVP |
S – Sale |
$98.09 |
-22,208 |
590,192 |
-4% |
-$2,178,453 |
|
3 |
nan |
2022-10-03 19:21:42 |
2022-09-28 |
GOOG |
Walker John Kent |
Pres, Global Affairs, CLO |
S – Sale |
$100.01 |
-34,809 |
391,084 |
-8% |
-$3,481,064 |
|
4 |
nan |
2022-09-28 12:29:04 |
2022-09-26 |
GOOG |
Mather Ann |
Dir |
S – Sale |
$98.60 |
-300 |
36,440 |
-1% |
-$29,580 |
|
5 |
nan |
2022-09-12 17:03:54 |
2022-09-09 |
GOOG |
Hennessy John L |
Dir |
S – Sale |
$110.00 |
-1,500 |
52,720 |
-3% |
-$165,000 |
|
6 |
nan |
2022-09-02 15:34:57 |
2022-09-01 |
GOOG |
O’Toole Amie Thuener |
VP, Chief Accounting Officer |
S – Sale |
$109.15 |
-855 |
60,746 |
-1% |
-$93,323 |
Source: Open Insider
Insider Activity
As for insider activity, like insider stats, all insiders sold stocks in September and October.
|
Date |
Shares Traded |
Shares Held |
Price |
Type |
Option |
Insider |
Trade |
|
2022-09-24 |
12,038.00 |
36,522.00 |
99.17 |
Sell |
No |
Schindler Philipp |
-12038.0 |
|
2022-09-24 |
77,314.00 |
229,386.00 |
nan |
Sell |
No |
O’Toole Amie Thuener |
-77314.0 |
|
2022-09-24 |
76,026.00 |
153,360.00 |
99.17 |
Sell |
No |
RAGHAVAN PRABHAKAR |
-76026.0 |
|
2022-09-24 |
23,104.00 |
256,456.00 |
99.17 |
Sell |
No |
RAGHAVAN PRABHAKAR |
-23104.0 |
|
2022-09-24 |
23,496.00 |
232,960.00 |
nan |
Sell |
No |
RAGHAVAN PRABHAKAR |
-23496.0 |
|
2022-09-24 |
6,019.00 |
18,261.00 |
99.17 |
Sell |
No |
WALKER JOHN KENT |
-6019.0 |
|
2022-09-24 |
6,121.00 |
12,140.00 |
nan |
Sell |
No |
WALKER JOHN KENT |
-6121.0 |
|
2022-09-24 |
5,107.00 |
97,893.00 |
99.17 |
Sell |
No |
WALKER JOHN KENT |
-5107.0 |
|
2022-09-24 |
5,193.00 |
92,700.00 |
nan |
Sell |
No |
MATHER ANN |
-5193.0 |
|
2022-09-24 |
30,135.00 |
334,505.00 |
99.17 |
Sell |
No |
Schindler Philipp |
-30135.0 |
|
2022-09-24 |
30,645.00 |
303,860.00 |
nan |
Sell |
No |
Schindler Philipp |
-30645.0 |
|
2022-09-24 |
1,069.00 |
6,360.00 |
nan |
Sell |
No |
Schindler Philipp |
-1069.0 |
|
2022-09-24 |
1,051.00 |
7,429.00 |
99.17 |
Sell |
No |
Schindler Philipp |
-1051.0 |
|
2022-09-24 |
6,525.00 |
125,075.00 |
99.17 |
Sell |
No |
Schindler Philipp |
-6525.0 |
|
2022-09-24 |
6,635.00 |
118,440.00 |
nan |
Sell |
No |
Schindler Philipp |
-6635.0 |
|
2022-09-24 |
12,242.00 |
24,280.00 |
nan |
Sell |
No |
WALKER JOHN KENT |
-12242.0 |
|
2022-09-25 |
300.00 |
11,480.00 |
98.6 |
Sell |
No |
WALKER JOHN KENT |
-300.0 |
|
2022-09-27 |
34,809.00 |
18,474.00 |
100.0 |
Sell |
No |
WALKER JOHN KENT |
-34809.0 |
|
2022-09-29 |
34,809.00 |
53,283.00 |
nan |
Buy |
No |
WALKER JOHN KENT |
34809.0 |
|
2022-09-29 |
34,809.00 |
1.00 |
nan |
Sell |
No |
WALKER JOHN KENT |
-34809.0 |
|
2022-10-02 |
12,237.00 |
64,343.00 |
97.33 |
Sell |
No |
WALKER JOHN KENT |
-12237.0 |
|
2022-10-02 |
6,158.00 |
58,185.00 |
98.72 |
Sell |
No |
Pichai Sundar |
-6158.0 |
|
2022-10-02 |
3,813.00 |
54,372.00 |
99.54 |
Sell |
No |
Pichai Sundar |
-3813.0 |
|
2022-10-03 |
855.00 |
24,480.00 |
101.04 |
Sell |
No |
O’Toole Amie Thuener |
-855.0 |
|
2022-10-04 |
76,678.00 |
226,365.00 |
100.8 |
Sell |
No |
O’Toole Amie Thuener |
-76678.0 |
Source: Business Insider
Technical Analysis Not for Near Term
Fibonacci Trendline
As described in this analysis research report, Google’s stock price appears to have little short-term momentum. If Google’s stock price is showing any form of strength, it might take a while to cross the Fibonacci trendline. As a result, investors should look at other comparable stocks with better near-term performance.
Fibonacci GOOG (custom platform)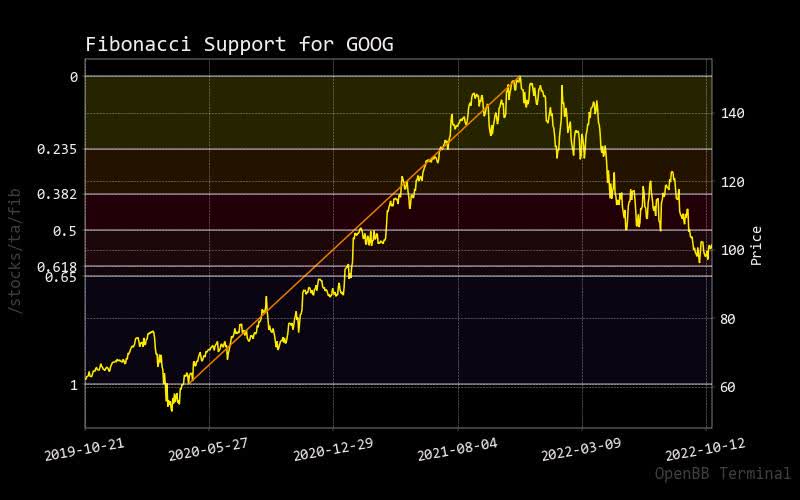
MACD
As the current price of Google stock is below the MACD zero line, there is some needed growth in the stock price before optimal entries are allowed. As stated before, it might be wise to pursue other better-performing stock opportunities while waiting for Google to take place.
MACD GOOG (custom platform)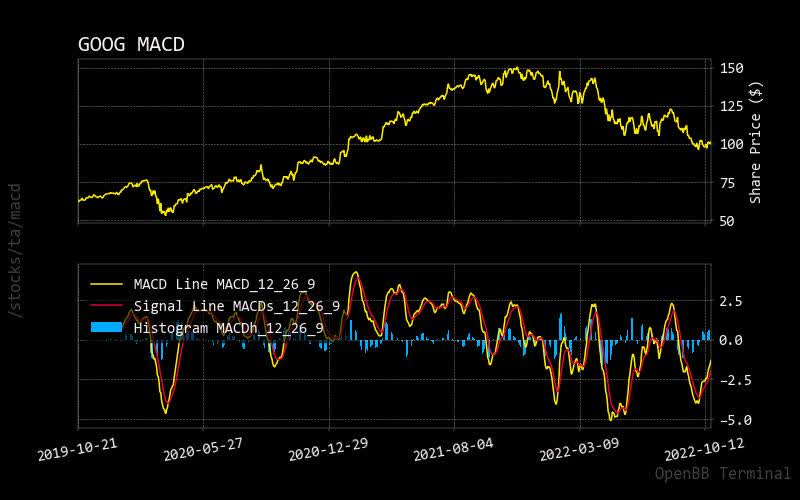
RSI
The current stock price of Google is halfway between overbought and oversold conditions. It shows that the current price of Google stock is optimal for market entry when another analysis allows.
RSI GOOG (custom platform)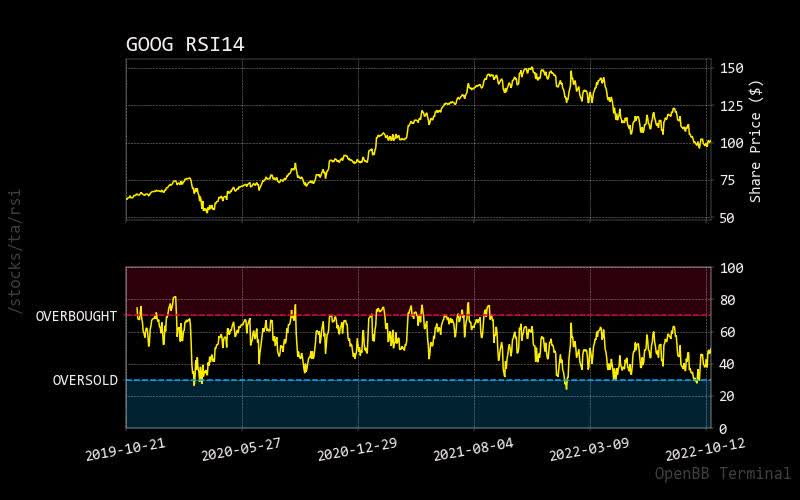
Prediction Shows Higher Probability for Uptrend
Monte Carlo
Monte Carlo predictive paths are trending relatively high with similar patterns of higher predictable moves in the normalized distribution chart. The predictability is relatively high in the normalized distribution chart, with a low probability of lower prices. Always remember to use something other than artificial intelligence as the exclusive predictor of forecasted stock price movements.
Monte Carlo GOOG (custom platform)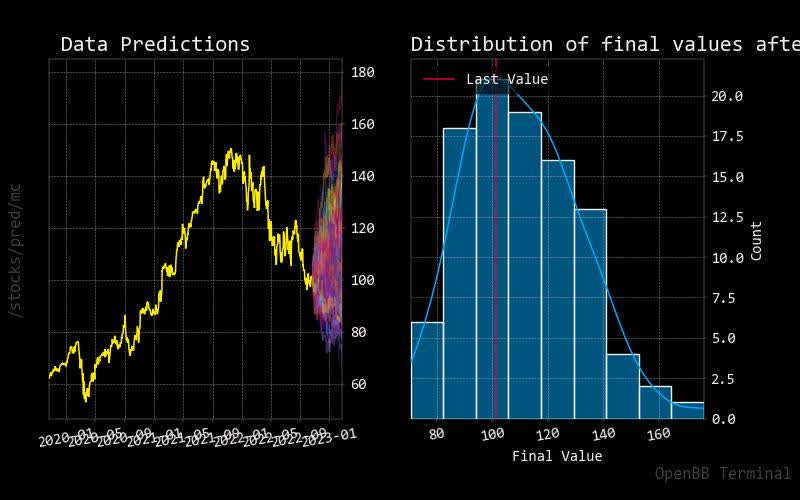
Regression
In the 30-day forecasted regression red line, Google stock price appears choppy and unpredictable. Again, it is wise to wait until predictable momentum returns to the stock price, which may happen later in 2023.
Regression GOOG (custom platform)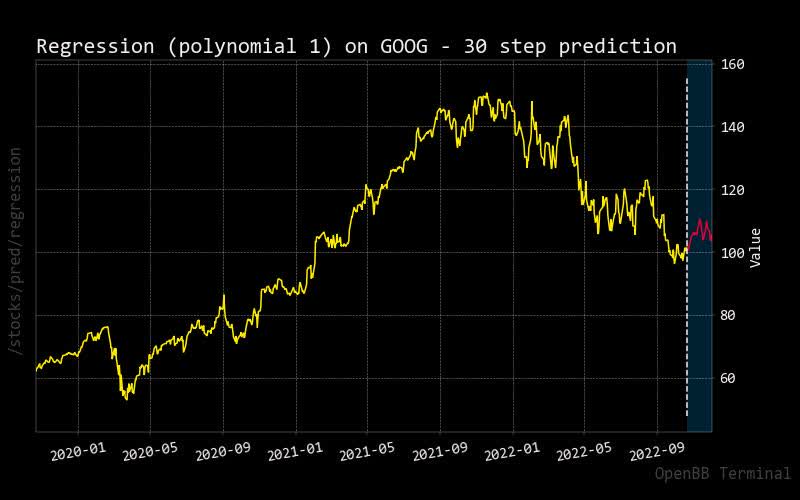
Conclusion
Long-term Google should continue to dominate top stocks over the long run, as hinted in some of the fundamental analysis estimates. This will depend upon how global markets respond to worsening economic conditions. In the short term, one should focus on investing in Google, as hinted in the technical analysis charts. Specific indicators show that orders can be placed; any investor should reap long-term benefits from these positions.
Due to contradicting stories in different types of analysis, it might be wise to put Google on hold status with the potential of buying shortly in 2023, according to the fundamental analysis.
Be the first to comment