

Aslan Alphan/E+ via Getty Images
Rule Number One Of Investing
I think we have all noticed that we’re in a bear market. If not from the media that brings up the next disaster waiting around the corner, you have probably noticed it from your wallet which has shrunk in size and feels worrisomely lighter than a year ago. In times like these the importance of successful stock picking becomes even greater than in a bull market because even if you were lagging a market index in a bull market, you were still making money. The first rule of investing is never to lose money (i.e. capital preservation). Companies that are established market leaders, well capitalized, profitable and reasonably valued may be the perfect investments to assist you in achieving rule number one in bad times. One of my own top picks that fits these criteria is Alphabet (NASDAQ:GOOG) (NASDAQ:GOOGL).
Alphabet’s Markets
Alphabet’s main market is digital advertisement which account for over 80% of their revenues. The remaining 20% is split between:
- Google Other i.e. music and video streaming services, apps and sale of digital content and consumer IT hardware (~11% of revenues)
- Google Cloud i.e. cloud computing (~7% of revenues)
- Other Bets i.e. different early stage ventures (<1% of revenues)
Let’s take a look at these markets in turn.
Advertisement
The global ad market’s size has been estimated to be anywhere from $590 billion by imarc to about $723 billion by Statista in 2021. Most market research (Group M, Zenith, Magna) I have looked at have estimated the market’s size to be above $700 billion in 2021 which is why I’m comfortable using Statista’s figures for this article. The global ad market’s development can be seen in the graph below. The market has grown annually about 7% from 2012 to 2021. You can see a small dip of about 3% in 2020 due to COVID-19 related weakness in ad spending. However, as businesses started to spend on ads again in 2021, they did so massively as the market grew by 16% which is well above historical growth rates pre-crisis. The market growth will most likely slow considerably in a weak economy although there are some advertising mediums that are expected to grow faster than other.
Statista
The market can be split into different advertising mediums or segments such as digital, TV, Out-of-home, print media and radio. It’s also possible to split, for example, the digital segment into mobile or social media which are reported by some data providers. Here everything is consolidated in the digital segment. The market split in 2021 according to Statista is seen below. The digital medium accounts for 63% of the total market which is also where Alphabet operates.
Statista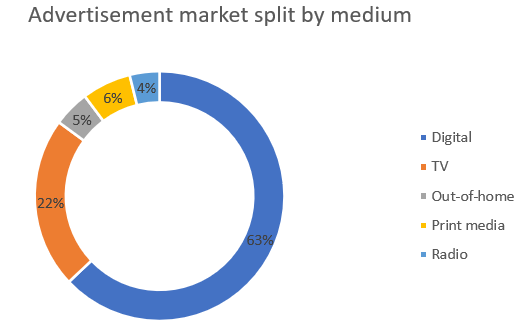
As I mentioned above, these segments grow at different paces. For example, print (think physical magazines) is shrinking while digital is growing. The whole market is expected to grow at an annual rate of about 9% until 2024 which is actually faster than the historical growth rates during 2012 to 2021. The fastest growing segment is digital which is expected to grow at 12% annually. This is good news for Alphabet.
Statista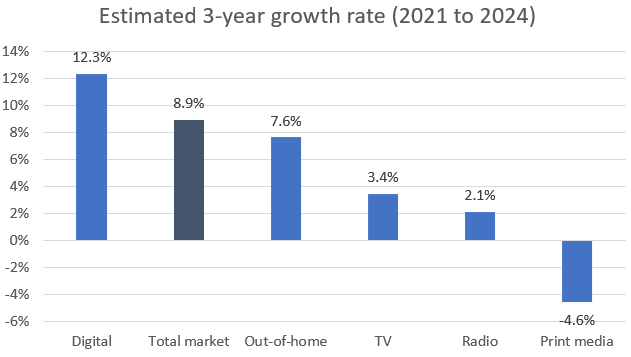
With these growth rates in mind, I think it’s reasonable to say that there is a case to be made that Alphabet can grow its ad business (Google Search & Other, YouTube Ads and Google Network) in the high teens for the next few years. I also want to point out that even though the global ad market shrank by 3% in 2020, Alphabet still managed to grow its ad business by 9% which provides some evidence that Alphabet can grow even though the overall market shrinks.
Google Other
Google Other is comprised of a hodgepodge of businesses such as:
- Music and video streaming services YouTube Premium and YouTube TV
- Apps and sale of digital content via Google Play
- Consumer IT hardware such as Fitbit gadgets, Pixel phones and more
Alphabet doesn’t open up how much revenues these sub-segments generate nor do they provide any KPIs in their quarterly reports which is why I haven’t included an industry analysis on all of these sub-segments. It should be noted that all of these markets are huge and fit a behemoth like Alphabet very well as the idea (most likely) is that these individual segments can contribute significantly to Alphabet’s total revenues in the future.
If I would have to guess, apps and sale of digital content (Google Play) seems like the largest sub-segment of these as Alphabet has one of the largest app stores out there. At the same time, Alphabet is not the top player in either music or video streaming, nor in consumer IT hardware. I did some research to back up this claim and according to Statista, Google Play’s gross revenues were $47.9 billion in 2021 and have grown annually about 26% from 2016 to 2021 which is impressive. Alphabet used to charge a 30% fee of gross revenues but that has now been reduced to 15% which will provide a significant headwind for YoY growth comparisons. This segment only grew about 5% YoY in 2022 Q1 which, I believe, is due to the fee reduction.
On the consumer IT hardware sub-segment, in the 2022 Q1 earnings call, management mentioned that they were excited about their Pixel 6 mobile phone but didn’t provide any figures on sales or units sold. Management didn’t really talk about their streaming services (music and TV) and as my mother sometimes used to tell me: if you don’t have anything good to say, don’t say anything. The same could be true for these products and services but bear in mind this is not even an educated guess, simply guessing for guessing’s sake. All in all, this segment had a weak quarter due to the change in the revenue model of Google Play.
Cloud Computing
The cloud computing market is huge and has experienced phenomenal growth rates in the past. Marketandmarkets and Gartner estimates the cloud computing market to be above $400 billion in 2021. The market has grown annually about 30% during the period 2017 to 2021 as can be seen from the graph below.
Gartner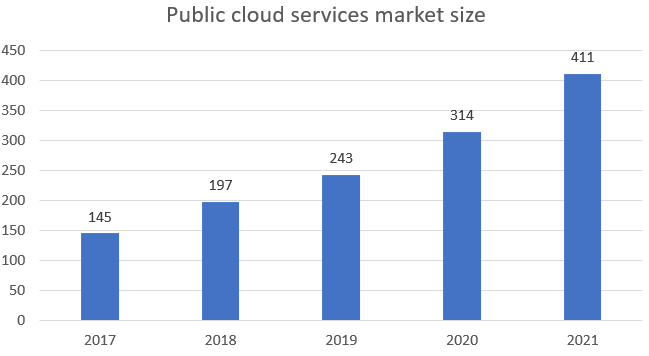
Marketsandmarkets estimates the market to grow at an annual rate of about 16% during the period 2021 to 2026, which means that the market would be a little shy of a trillion dollar in 2026. The largest players in the market are Amazon (AMZN), Microsoft (MSFT) and Alphabet although there are other large competitors such as Alibaba (BABA), Salesforce (CRM), Oracle (ORCL), SAP (SAP), Workday (WDAY), Adobe (ADBE) and IBM (IBM).
It’s safe to say that the competition is fierce among these players as all of them have the cash to invest in and market their services. The market is however still growing so rapidly that there is enough room for most players to grow in the foreseeable future. The huge market opportunity and rapid growth rate is exactly why it’s a great place to be in for huge companies such as Alphabet as the segment has the potential to become a significant earnings contributor to the Alphabet group.
Other Bets
Other bets include various small companies operating in different markets, mostly in health technology and internet services according to Alphabet’s 2021 annual report. These are companies that may generate significant revenue down the line and are referred to as “moonshots” in Alphabet’s financial reports. One of the best known companies in this segment is perhaps Waymo, which makes driverless software (i.e., self-driving cars) but which is still in trial phase. Perhaps the common denominator with the other segments is that if self-driving ever become mainstream, the market is going to be large and would most likely become a significant earnings contributor for Alphabet. However, it’s too early days to get too excited.
While we now have a helicopter view of the main markets that Alphabet operates in, we can take a look at Alphabet’s different segments.
Segments
Officially Alphabet has three segments which are Google Services, Google Cloud and Other Bets. Google Services is further split into sub-segments Google Search & other, Google Network, YouTube ads and Google Other on the revenues level. Operating income is however only reported on the aggregate level Google Services. From the graph below we see that the advertising sub-segment still make up for over 80% of total revenues (Google Search & other, Google Network and YouTube ads).
Alphabet Financial Reports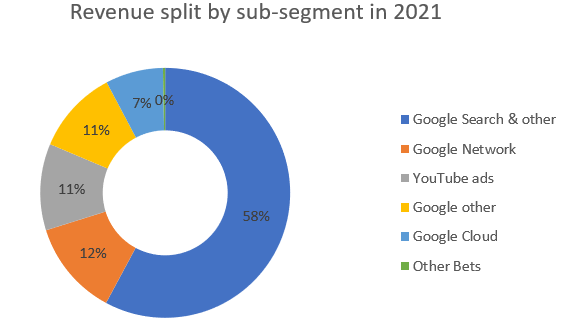
As we can see from the chart below, Google Search & Other has been the major source of revenues for Alphabet for a long time. However, we can also see that the other sub-segments are huge on their own, as all generate yearly revenues close to or above $20 billion except Other Bets. We also see that although the advertising market shrank in 2020 due to uncertainty caused by COVID-19, Alphabet still managed to grow its advertising business in the high single digits. This is evidence in favor of a resilient business even in a downturn.
Alphabet Financial Reports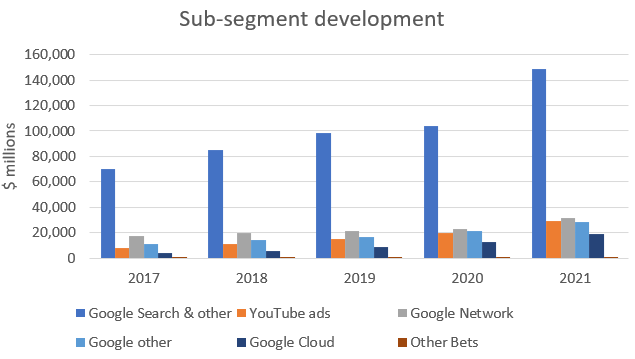
Looking at the growth rates of the different sub-segments, we see that Google Cloud stand outs with solid growth that has proved persistent over several years. Part of the pop in the growth of the advertisement business in 2021 is to an extent due to a weak 2020. It’s highly unlikely that Alphabet could sustain this level of growth due to its sheer size and large market share. This is already showing in the 2022 Q1 numbers as growth slowed to about 22% YoY which is of course still solid growth for a business of this size. On the earnings conference call, CFO Ruth Porat also indicated that 2022 Q2 numbers will be even weaker in terms of growth due to a very strong comparable quarter. Perhaps one of the less talked about numbers on this platform is the 5% YoY growth rate of Google Other. As I deducted previously, Google Other most likely generates most of its revenue from Google Play which will show subdued growth the whole year due to its commission fee reduction from 30% to 15%. It will be interesting to follow how this segment develops over the year.
Alphabet Financial Reports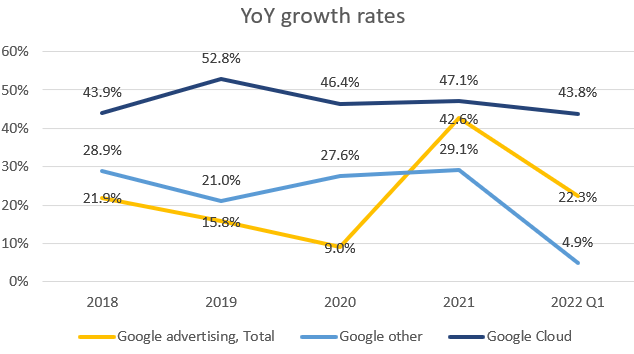
Still, looking at the growth rates of the digital advertising market up to year 2024 (12%) I think there’s a case to be made that Alphabet’s ad business can continue to grow in the high teens as it has in the past. Also, the growing cloud computing market should provide tailwinds for Google Cloud which I expect will grow by 30-40% in the coming years.
Additionally, with the scale up of Google Cloud, the revenue backlog that has been built up over the years has grown substantially. Google Cloud generates revenues from long-term subscriptions which have grown at an annual rate of 94% since 2019. YoY growth in Q1 2022 was 64%. Alphabet states that half of the revenue backlog will be realized in the next 24 months and most of it relates to Google Cloud. There has usually been a big increase in the backlog during the fourth quarter of the year so I don’t expect this to increase much before year-end.
Alphabet Financial Reports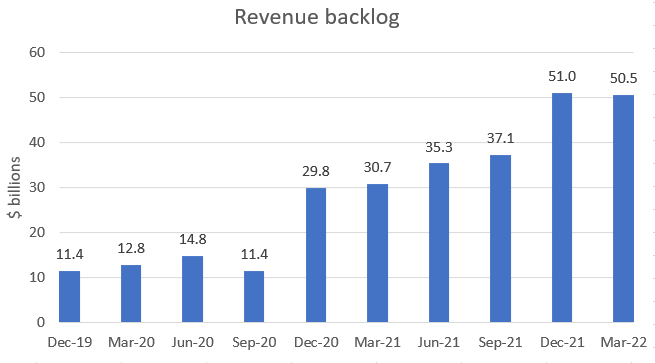
Finally, Other bets grew 122% YoY in Q1 2022. I’m not sure if this was due to a non-recurring item but we’ll see in the second quarter whether growth subsides.
Operating Drivers
Looking at the major KPIs reported by Alphabet, the “monetization metrics”, we get a clearer picture of how they underlying ad business has performed. Alphabet reports KPIs for two ad sub-segments:
- Google Search and other properties
- Google Network
Google Search And Other Properties
Google Search and other properties report two KPIs:
- Growth in paid clicks; and
- Growth in cost-per-click.
Paid clicks are simply the number of clicks by end-consumers on advertisements located on Alphabet’s products such as Search, Gmail etc. Cost-per-click is the total revenues generated from the clicks divided by paid clicks, i.e., it measures the average amount Alphabet charges per click.
With this in mind, let’s take a look at how these metrics have developed. Paid clicks (volume) look very promising. Although the growth rate has come down quite a bit from years 2017-2018, paid clicks is still growing in the high teens which is great at least in my book. What’s at least as interesting as the growth in volume is the growth in the price of the services i.e. the price of clicks. Alphabet has been able to increase their prices since the beginning of 2021. It remains to be seen if Alphabet can continue to raise prices but at least 2022 Q1 showed an 8% increase YoY. With a recession possibly on the horizon these metrics can turn ugly but no sign of it yet. I expect some weakness in these metrics for 2022 compared to 2021 and especially 2022 Q2 will have a tough comparison period.
Alphabet Financial Reports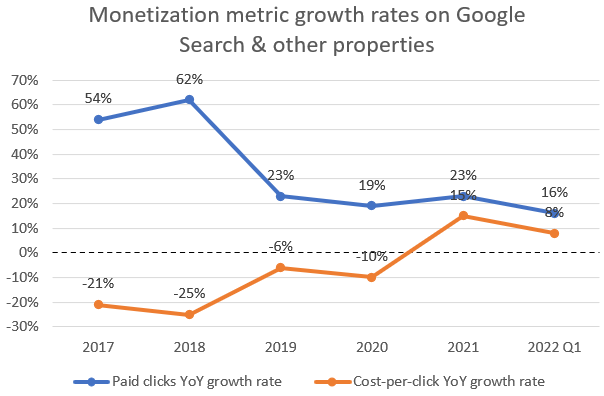
Google Network
Google Network also reports two KPIs:
- Growth in impressions
- Growth in cost-per-impression
To my understanding an impression is counted when an ad shows up on a device (for example on your desktop or mobile) so you don’t actually have to click it to generate revenues for Alphabet. Cost-per-impression is defined the same way as cost-per-click that I described above. Impressions volume haven’t shown that impressive growth rates in the recent past and I suppose that is what we can expect going forward as well. However, Alphabet has also increased prices in this sub-segment which is especially visible in 2021. This had an effect on revenues as well as they grew about 37% in 2021. With the low volume growth of Google Networks this segment’s growth has to come from price increases which may be difficult for customers to accept in a weak economy. I expect weakness in these metrics as well going forward compared to 2021.
Alphabet Financial Reports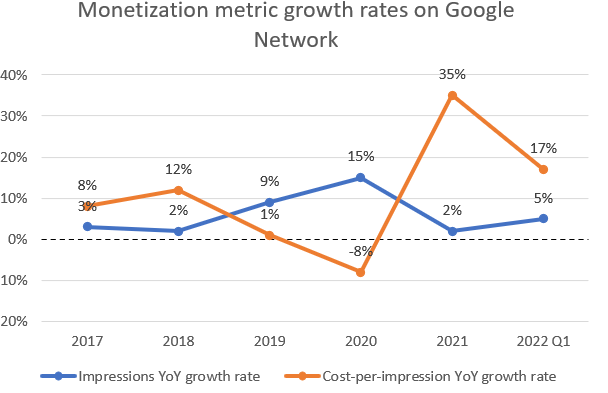
Valuation
Although industry and company specific analysis are the areas where one should spend most time when considering an investment, the analysis always culminates in valuing the company in question. The reason is simple, the industry and company can be the best thing since sliced bread, but if everything is already priced into the company’s share price, it can still be a lousy investment. As a famous investor once said, price is what you pay and value is what you get.
A high-quality business such as Alphabet deserves a relatively high multiple in my opinion. Alphabet has mega trends behind its largest segments digital advertising and cloud computing in addition to being a market leader especially in digital advertising but also one of the leaders in cloud computing. Alphabet has a strong balance sheet and margins above 30% in advertising. The cloud computing segment is still in the red but as long as it keeps growing at 30-40% I don’t think that’s a problem. The “moonshots” should also be ascribed a value although they are still a long way from being profitable. With all these factors in mind, I’m fairly confident giving Alphabet a multiple range of 20-25x or 22.5x which is the average of the two and simplifies our calculations.
In Alphabet’s case I like to look at free cash flow or adjusted earnings instead of GAAP earnings due to gains/losses in financial securities which are reflected in earnings. This can give a quite rosy picture of the earnings power of Alphabet if not adjusted for, especially in the last couple of years when equity markets have developed fairly well. For example, during year 2021 Alphabet had $12.2 billion (or $18.5 EPS) positive gains/losses from financial securities which is mostly unrealized gains.
It’s also reasonable to adjust for the excess cash Alphabet has on its balance sheet when considering what the underlying business is worth. Adjusting the current market cap of $1,450 billion (share price as of writing about $2,200) with net debt (debt minus cash) of $118.3 billion as of Q1 2022 we get $1,330 billion in enterprise value. Dividing that by the total number of shares outstanding we get a share price of about $2,000 instead of $2,200.
Using free cash flow per share for the trailing twelve months, $102, and multiplying that by 22.5x we get a share price of about $2,300. Comparing that to the adjusted share price of $2,000 and Alphabet is undervalued by about 13%. Although I’d like to have a margin of safety of >20% I still think Alphabet is a good buy at these levels due to the segments Google Cloud and Other Bets. These segments are currently loss making but especially Google Cloud could become a significant earnings contributor in the mid-term (1 to 5 years) when Alphabet’s management determines they want to focus more on profits than growth. This is why I rate Alphabet a buy based on the current price of about $2,200.
Risks
No analysis is complete without considering the risks involved in an investment. The major risks in Alphabet’s case in my opinion is the risk of a break up or imposing new regulation that will impact its business model in a detrimental way. Alphabet has already received fines in the billions of dollars from the European Commission which also adds up to a significant sum. Another major risk factor is of course a recession. Advertising is a cyclical business as customers can halt advertising very easily when times are bad and need to save cash. Although Alphabet managed to grow in 2020 when the ad market was down, it remains to be seen how Alphabet fares in a scenario where the recession is prolonged.
Be the first to comment