

Darren415
This article was first released to Systematic Income subscribers and free trials on Nov. 24.
In this article, we catch up on the quarterly results from the Business Development Company (“BDC”) Golub Capital (NASDAQ:GBDC). GBDC is currently trading at a dividend yield of 9.35% and a valuation of 95%. The company delivered a positive total NAV return for the quarter along with a 10% dividend hike.
The company’s portfolio has a higher-quality focus with a 94% first-lien allocation – well above the 78% sector average. It is similar to the broader sector in focusing on less-cyclical sectors like software and healthcare. The portfolio is well diversified with over 330 investments – more than double the sector average.
Golub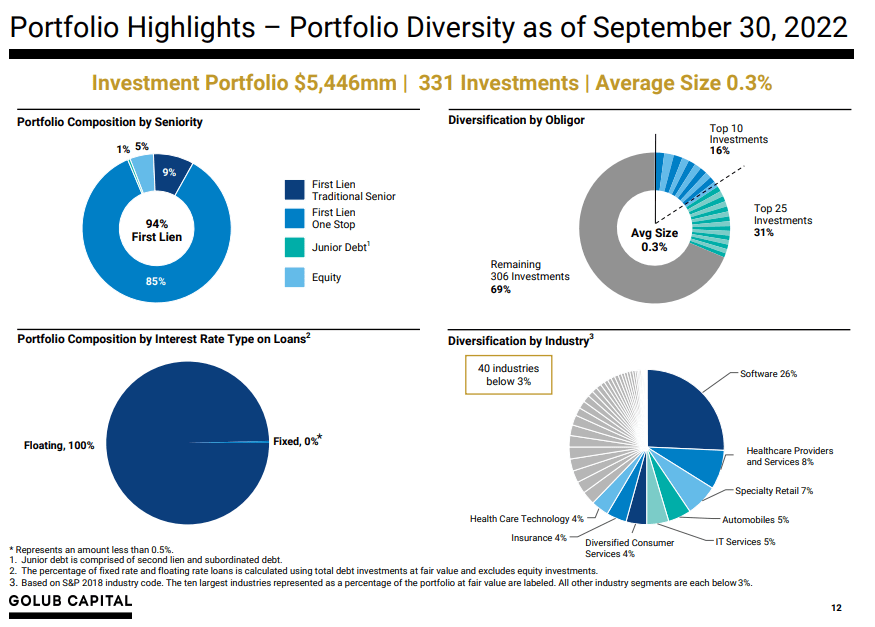
Quarter Update
Golub Capital BDC NAV fell 1.7%, which was slightly below the sector average level. Total NAV return for the quarter came in at a positive 0.3%. The company delivered a positive total NAV return each of the three quarters this year.
Systematic Income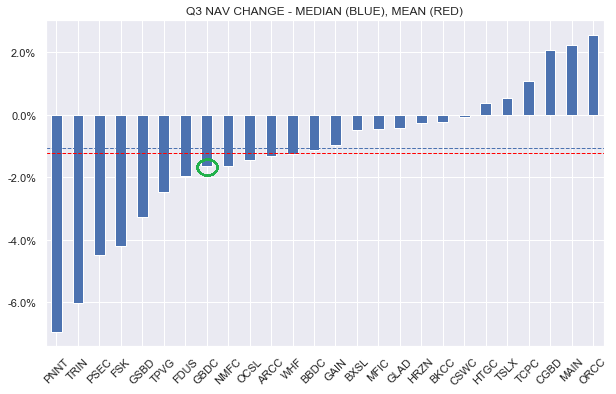
The drop in the NAV was primarily due to unrealized losses – a common theme we have seen across the sector – as the following NAV bridge shows.
Golub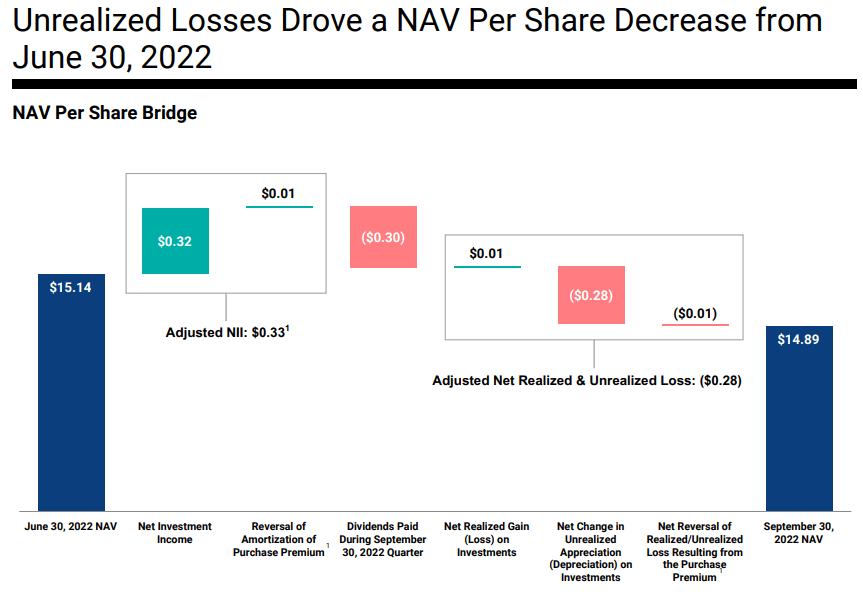
Adjusted net income (adjusted for capital gains incentive fees and the merger purchase premium amortization) came in 6.5% higher from the previous quarter. A couple of non-recurring items provided an additional tailwind to an upwardly rising trajectory.
Systematic Income BDC Tool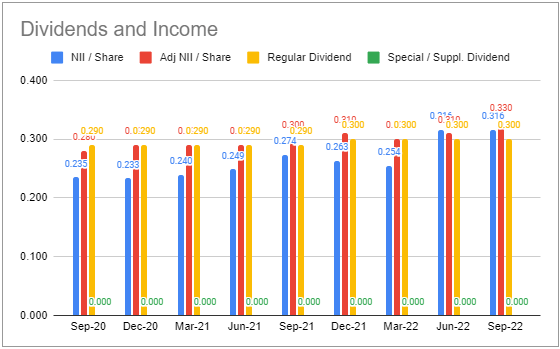
The rise in net income was primarily due to an increase in overall interest income (blue bars) as the following chart shows, itself driven by rising short-term rates.
Systematic Income BDC Tool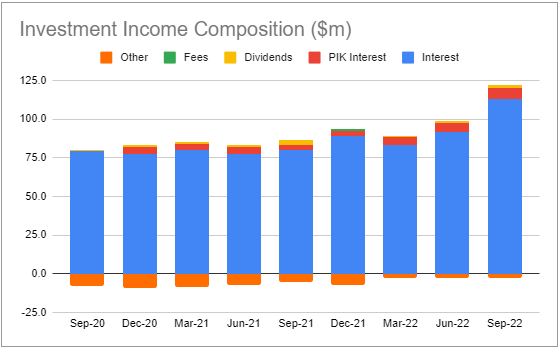
The company hiked its dividend by 10% to match its adjusted net income. We expect further hikes in the coming quarters on the back of stable portfolio quality and rising short-term rates.
Income Dynamics
Net new investments were negative as sales/repayments exceeded new fundings. This is not atypical of the sector but is somewhat unexpected since a tighter money environment normally leads companies to borrow money in order to ensure they can operate through a tough period. It’s very likely that a relatively high-quality portfolio that GBDC features along with a still decent macro environment is causing many companies to turn away additional financing particularly at currently high levels of interest.
Systematic Income BDC Tool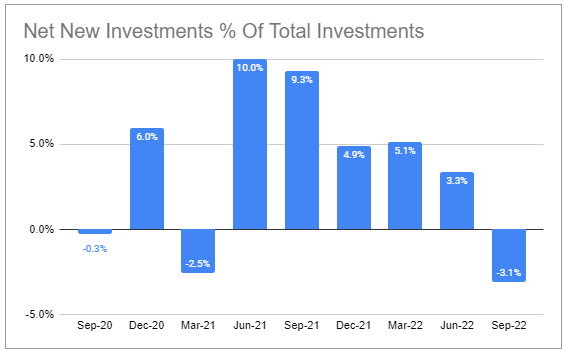
Leverage ticked down marginally in line with a drop in net new investments.
Systematic Income BDC Tool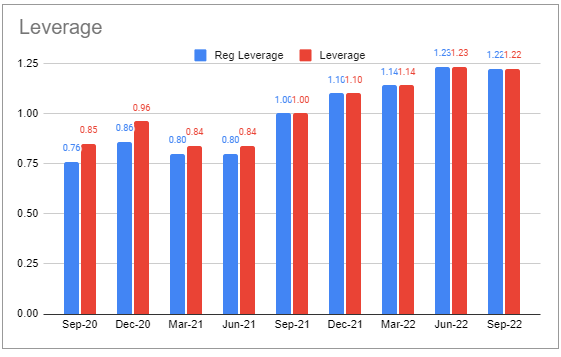
Yield on assets jumped sharply while interest expense increased at around half the rate which is in line with the roughly 100% / 50% floating-rate asset vs. floating-rate debt profile of the company. This should continue to support net income in the medium term. What is also interesting from the chart is that the Q3 calendar quarter was the first quarter that truly reflected the rise in short-term rates we have seen this year. This kind of delayed reaction is due in part to the income valley, as we call it, or the slight initial drop in net income when rates moved towards 1% due to the presence of Libor floors on the asset side of the balance sheet. It is also due to the significant delay with which higher short-term rates actually feed into income given the 3-month typical reset period that loans feature. The sharp jump in asset yields over the past quarter is what makes us optimistic about further large yield gains in the coming quarters.
Systematic Income BDC Tool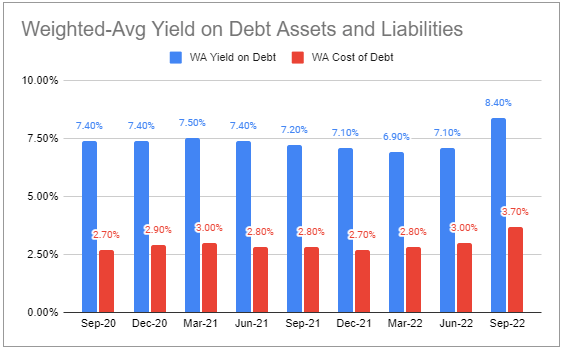
All else equal, net income is expected to rise by double-digits for another 1% rise in short-term rates. As it happens, Libor has risen around 0.9% above its calendar Q3-end level as of this writing so a lot of the income rise is already in store. And although we don’t expect a jump of this magnitude, we do expect further significant income gains in the coming quarters.
Systematic Income BDC Tool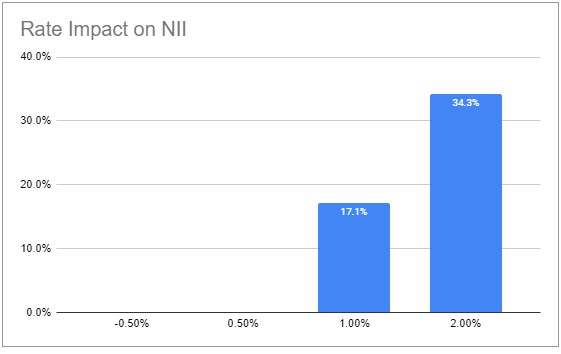
GBDC has one of the highest levels of net income betas to rising rates – a function of its relatively elevated leverage, very high proportion of floating-rate assets and an average level of floating-rate debt.
Systematic Income BDC Tool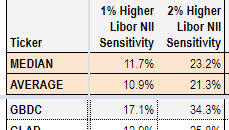
GBDC show a helpful chart that provides some intuition about the relationship between short-term rates and net income.
Golub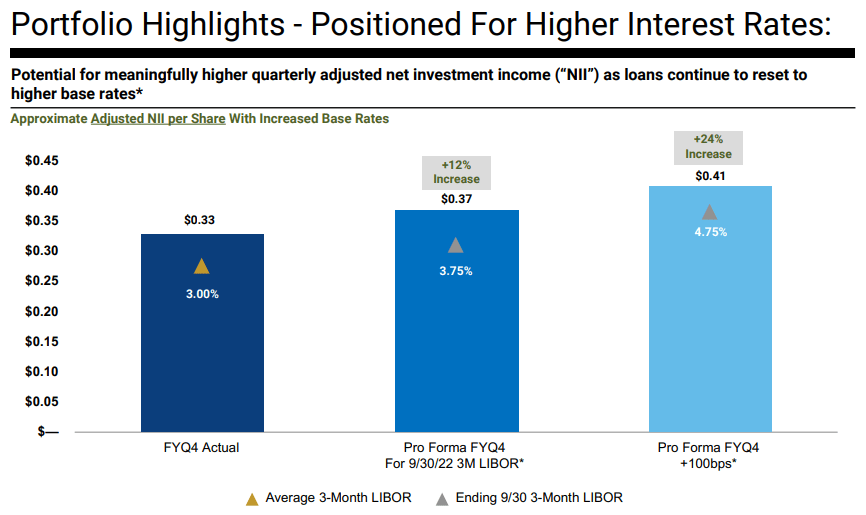
A final important driver of rising net income is the fact that new investments are going into the portfolio at wider credit spreads than assets that are leaving the portfolio. The 1.5% gap between the two is significantly above the previous run rate. This is not unusual in the sector but worth noting.
Golub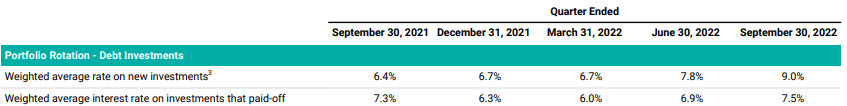
Finally, in the lower interest rate environment of the previous year, GBDC was able to secure phenomenally low coupon levels on debt. Specifically, 27% of its total debt features a weighted-average coupon of around 2.35% which matures in 2026 and 2027. Another 16% of its total debt carries a still-low coupon of 3.375% (well below today’s Treasury yields) and matures in April 2024. This low level of fixed-rate debt for an extended period is a great result for investors and will go straight to the company’s bottom line.
Portfolio Quality
Non-accruals remained modest at 1.3% at fair-value.
Systematic Income BDC Tool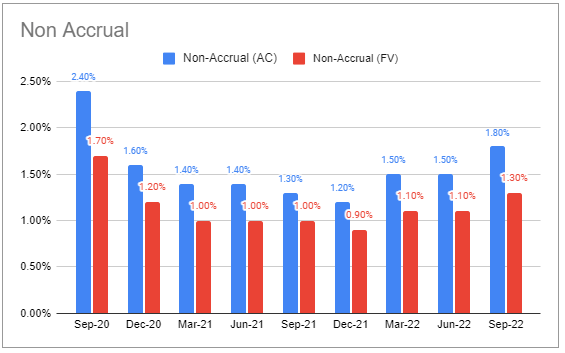
Portfolio rating has been stable with nearly all investments in the top 3 grades. The weighted-average portfolio quality grade has worsened very marginally in the last couple of quarters.
Systematic Income BDC Tool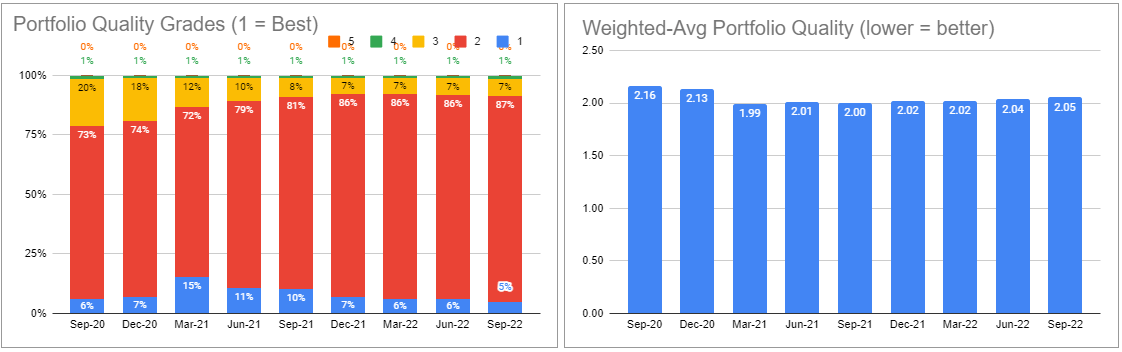
PIK fell slightly and remains at a roughly average sector level.
Systematic Income BDC Tool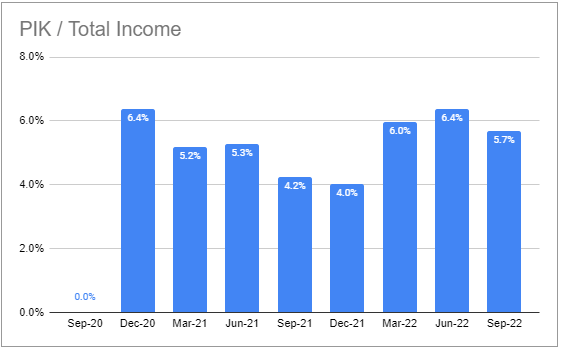
There have been no net realized losses since 2020.
Systematic Income BDC Tool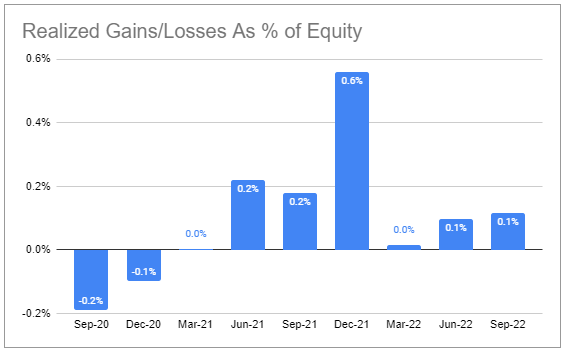
Valuation And Return Profile
As the following chart shows GBDC has tended to trade at a higher valuation than the broader sector until the COVID shock.
Systematic Income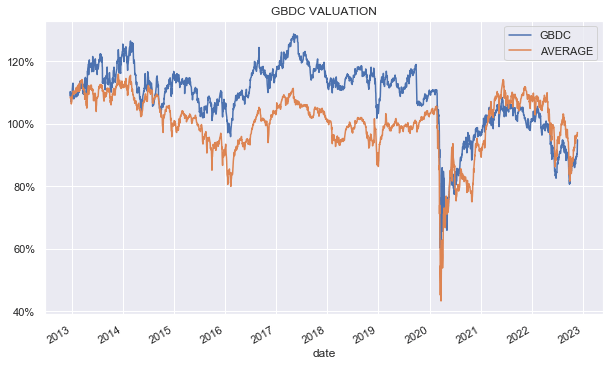
As many investors know, the company stumbled in 2020 due to the rights offering it undertook in April of 2020 and completed in May of 2020 which shaved off around 7.8% from the NAV at the time. The rights offering was done at 92.5% of the weighted-average price during the offering period and ended up being at $9.17 per share which was an amazing 37% below the Q1-2020 NAV and almost 40% below where the Q2-2020 NAV would have been without the rights offering. The key point is that the company underperformed in 2020 not due to a bad underwriting process but because it was more conservative that was warranted. In our view, this one-off driver of underperformance is not reflective of the company’s underwriting strength and ability to deliver value to investors. Over the 10Y period GBDC has generated total NAV returns exceeding the sector average.
Systematic Income BDC Tool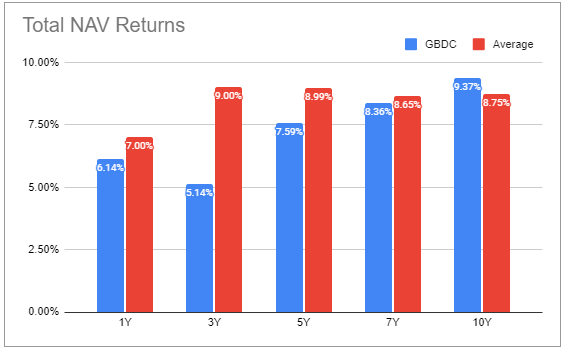
Golub Capital BDC has retraced its double-digit valuation discount, when we initiated a Buy rating on the stock, to a level that is only 2% below the sector average. At this level it looks slightly cheap to fairly-valued.
Systematic Income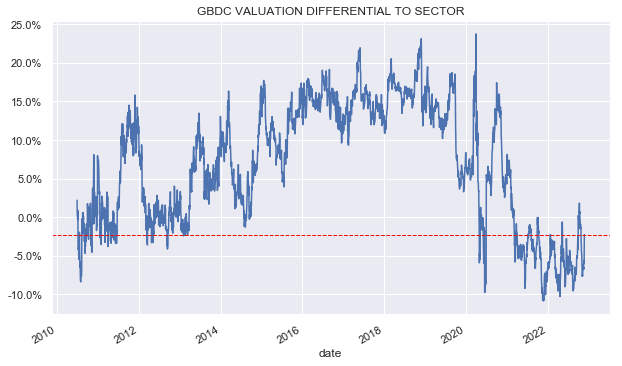
Takeaways
GBDC remains an attractive option for more defensive BDC investors due to its lower fee structure, lower equity allocation, strong portfolio quality and an attractive valuation. Its NAV should be better protected relative to the sector in the current sell-off given its relatively low equity exposure and first-lien focus. At a valuation 2% below the sector average, Golub Capital BDC looks slightly-cheap to fairly-valued.
Be the first to comment