

Gold Talking Points:
- Gold prices have continued to bounce back after breaking down two weeks ago around FOMC.
- Gold is now re-testing resistance at a familiar level of 1815, keeping the door open for short-term bearish reversal themes provided that prices close the daily bar inside of this price.
- The analysis contained in article relies on price action and chart formations. To learn more about price action or chart patterns, check out our DailyFX Education section.
Gold prices have continued to recover after a late-January spill saw a strong reversal of fortunes. Ahead of the FOMC rate decision, Gold had tipped-up for a resistance test just 24 hours ahead of the Fed, and at the time it was the 1850 level that was a line-in-the-sand.
But sellers soon showed up as a descending trendline was being tested and prices soon went into a reversal move, hastening through the FOMC rate decision a day later until prices had pushed down to a fresh monthly low.
As looked at last Monday, the door was open for short-term pullback themes and that’s precisely what happened. Also in that Monday article I highlighted the rather familiar level of 1815 which, as of this morning, is helping to set resistance.
Gold Eight-Hour Price Chart
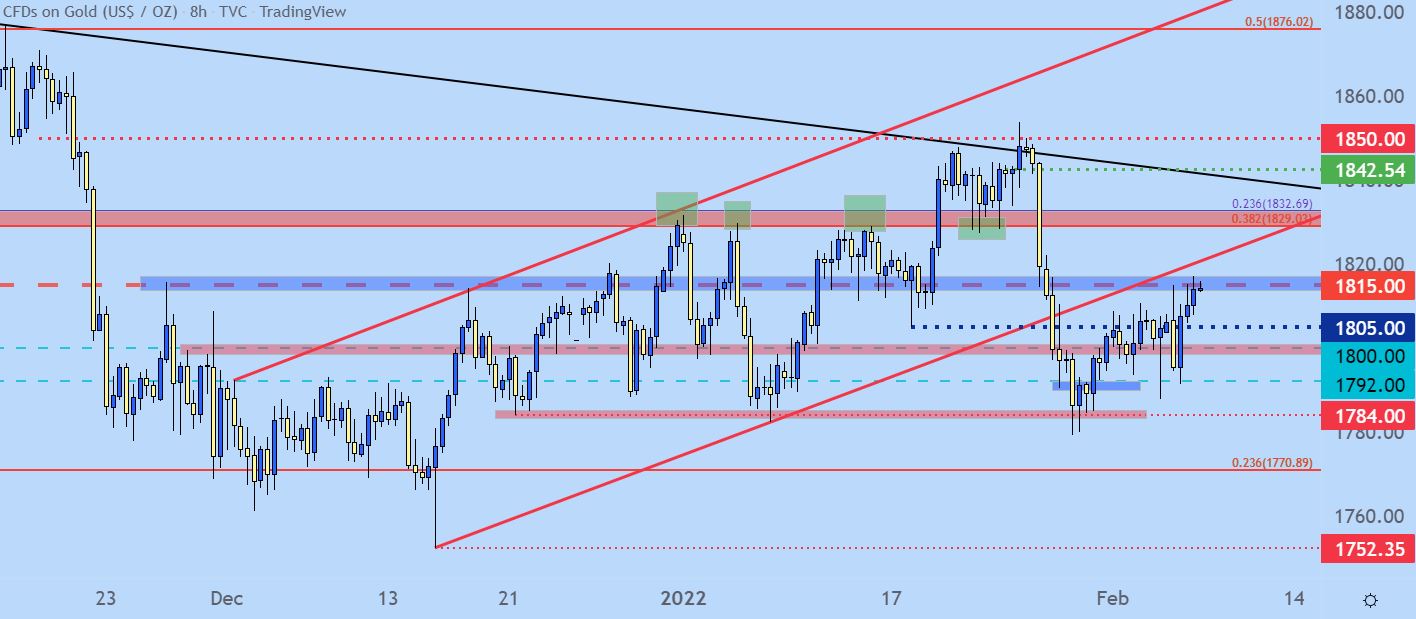
Chart prepared by James Stanley; Gold on Tradingview
Gold Near-Term Strategy
At this point Gold could be attractive on the short side should resistance hold. The long side can be challenging given the intermediate-term trend combined with the approximate $30 of bounce that’s so far shown off of the lows.
But, on the resistance side, we’ve seen a continuation of tests at 1815 already after it came back into play last Friday. The first test brought a reaction down to 1792, at which point bulls jumped in at support and re-drove prices right back up to 1815. This indicates that there could be some continued bullish potential, and with the major zone of prior resistance-turned-support lurking up at the 1830 handle, there’s an obvious level to look for prices to move towards.
But, again, the key here is how today’s bar closes and if we do end up with a close showing respect to 1815, the bearish theme could start to become attractive again. Until then, waiting for a cleaner setup seems prudent.
Gold Two-Hour Price Chart
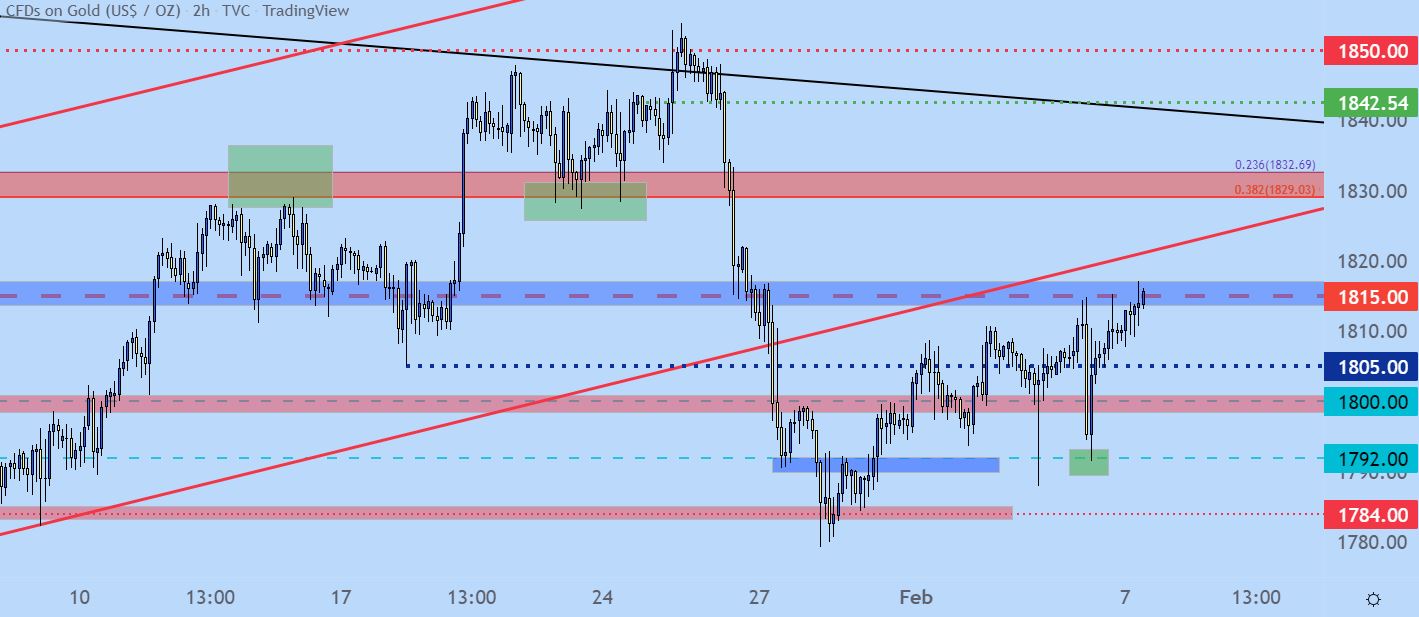
Chart prepared by James Stanley; Gold on Tradingview
— Written by James Stanley, Senior Strategist for DailyFX.com
Contact and follow James on Twitter: @JStanleyFX
Be the first to comment