

Gold and Crude Oil Talking Points:
- Gold prices slid as some Asian stock markets rose with oil prices
- However the prospect of more US stimulus has precious metal underpinned
- Crude oil markets may see more production cuts, but the current glut has seen storage fill up
Gold prices eased in Thursday’s Asia Pacific trade. Some investors clearly booked profits on the last two sessions’ gains.
However, despite a modest pickup in risk appetite and a bounce in crude oil prices, gold remained above $1700/ounce. The US House of Representatives is expected to clear a fourth coronavirus economic countermeasure on Thursday, raising the overall federal fiscal response to nearly $3 trillion.
This sort of hugely expanded deficit spending is likely to underpin gold, as has miserable Purchasing Managers Index figures out of both Australia and Japan.
There are more PMI releases coming up from Europe and the US later Thursday, and it will be fascinating to see whether the current risk appetite survival survives what’s expected to be more virus-related gloom.
| Change in | Longs | Shorts | OI |
| Daily | 13% | 2% | 9% |
| Weekly | 8% | -17% | 0% |
Crude oil prices meanwhile extended gains amid clear signs that producers are cutting back production heavily in the face of coronavirus’ awful toll on demand.
Oklahoma’s regulators have said well owners can now shutter operations without losing leases, while loadings of Russian ‘Urals grade’ oil in the Baltic are reportedly set to be sharply lower this month, suggesting that the country is complying with the large production cuts agreed earlier this month by Organization of Petroleum Exporting Countries and allies, the so-called ‘OPEC Plus’ group.
Still, concerns remain over storage capacity for a glut of crude oil with no clear end users. US crude oil stockpiles reached 518.6 million barrels in the week to April 17 according to official data. That’s not far from 2017’s record of 535 million.
| Change in | Longs | Shorts | OI |
| Daily | -2% | 5% | -1% |
| Weekly | 9% | 70% | 20% |
Gold Prices Technical Analysis
Gold prices remain below their previously dominant daily chart uptrend channel, having broken below it on April 17. However, there’s been very little appetite to sell the metal down to any great extent, and narrow range-trading has been the order of the days since.
Near-term support comes in at $1673.90/ounce, April 19’s closing low. At the top of the range resistance at $1724.40 could soon face another test although there doesn’t seem any urgency to try and take it out.
Crude Oil Technical Analysis
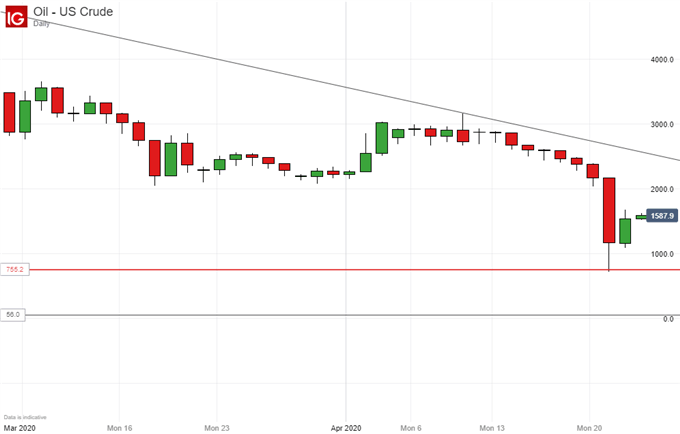
The last two days’ gains still leaves US crude prices under the influence of the downtrend in place since February 19. It will stay that way unless the bulls can force prices back above $24.89/barrel and there’s certainly no sign that they’ve that sort of resolve yet.
A rise above April 21’s opening price of $21.60 might be an indication that such resolve was growing, especially if the market holds thereabouts. If it can’t, psychological support in the $10 region may be back in focus, but if the fundamental news continues to center on output reductions then gains could be more likely.
Commodity Trading Resources
— Written by David Cottle, DailyFX Research
Follow David on Twitter@DavidCottleFX or use the Comments section below to get in touch!
Be the first to comment