

GOLD, CRUDE OIL PRICE OUTLOOK:
- Yellen’s comment on inflation boosted market sentiment, defying ‘taper tantrum’ fear
- Gold prices stayed put despite rising 10-year yields, flat US Dollar index (DXY)
- Crude oil prices well-supported by demand optimism, OPEC+ curbs and fresh stimulus
Gold and crude oil prices traded modestly higher during Monday’s APAC morning session following Treasury Secretary Janet Yellen’s comment on inflation over the weekend. Gold has subsequently erased gains as the US 10-year Treasury yields rose anew, however. “Is there a risk of inflation? I think there’s a small risk and I think it’s manageable…[and] we’ll certainly monitor for it… but we have tools to address it,” Yellen said. Her comment eased market fears about a ‘taper tantrum’ after rising inflation expectations and longer-dated yields caused heightened market volatility recently.
Yellen’s view on inflation echoed Fed Chair Jerome Powell’s latest comments arguing that the current set of monetary stimulus measures is “appropriate”, hinting that the Fed may hold its policy rate and bond-purchasing program largely unchanged at the upcoming FOMC meeting. Gold traders will closely watch this week’s announcement alongside the BoE and BOJ meetings for clues about global central banks’ take on inflation and economic recovery. If policymakers signal appetite for pushing asset purchases further down the yield curve to contain rising long-term borrowing costs, that may serve as a much-needed positive catalyst for precious metals.
A rapid surge in US real yields, represented by 10-year Treasury inflation-indexed security, has exacerbatedthe selloff in gold since early February (chart below). Rising real yields are largely attributed to the prompt rollout of Covid-19 vaccines and fiscal stimulus progress, which painted a brighter outlook for an economic recovery. Fiscal stimulus-backed reflation hopes may lead yields to trend higher alongside inflation expectations, which appears to be bad news for bullion. Gold prices have fallen 6.3% since February 10th, while crude oil prices have climbed 13.3% during the same period. The question is how far will rates go before stabilizing?
Gold Prices vs. 10-Year Treasury Inflation-Indexed Security
Source: Bloomberg, DailyFX
Crude oil prices climbed during Monday’s APAC session to a fresh 13-month high, backed by optimism about demand recovery and an OPEC+ extension of output curbs. President Joe Biden signed the US$ 1.9 trillion Covid relief bill into law on Thursday, paving the way for a faster recovery of energy demand. The US had over 100 million vaccines administered as of March 13th, with daily new infections falling to 49,728. Encouraging progress on pandemic control suggests that easing lockdown measures and travel restrictions are on the horizon.
The OPEC+ coalition pledged to keep output curbs unchanged at a meeting in early March, while many traders anticipated a production hike. Saudi Arabia decided to extend its unilateral 1 million barrel per day production cut into April. Restraint by the oil cartel and its allies has further strengthened the oil price outlook alongside demand optimism.
The EIA crude oil inventory report set to be released on March 17th will be closely watched by oil traders after two weeks of large stockpile build due to extreme weather conditions that hurt refinery activity. Refiners operated at 69% of their capacity during the week ending March 5th, compared to an average of 80% capacity seen in January.
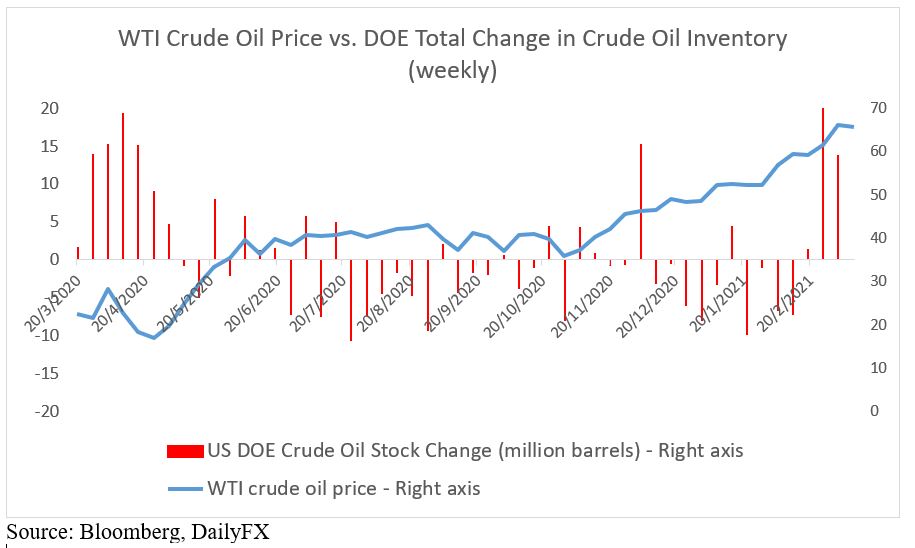
Source: Bloomberg, DailyFX
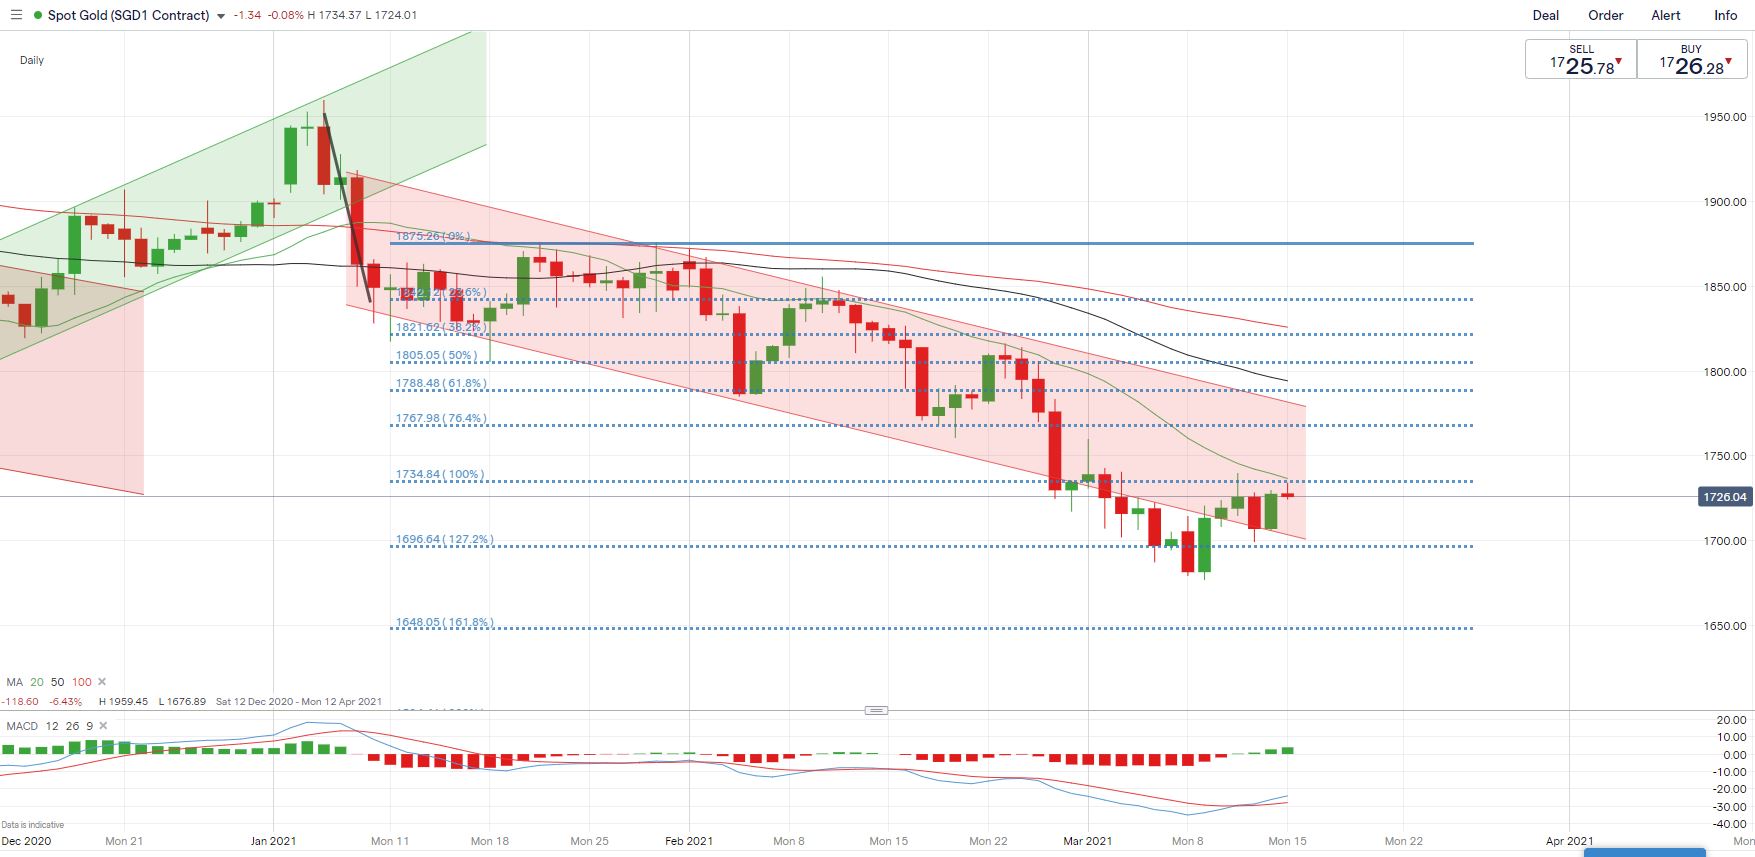
Gold Price Technical Analysis
Gold prices are riding a dominant bearish trend lower, with all three Simple Moving Average (SMA) lines sloping downwards. Prices rebounded last week and are back to the confines of a “Descending Channel” that formed from early January. An immediate resistance level can be found at US$ 1,734, where the 20-day SMA and the 100% Fibonacci extension level intersect. An immediate support level can be found at US$ 1,696 – the 127.2% Fibonacci extension, the breaking of which may expose the 161.8% Fibonacci extension level (US$ 1,648). The MACD indicator has formed a bullish crossover below the zero line, suggesting that near-term momentum has flipped upwards even as overall momentum remains weak.
Gold Price – Daily Chart
| Change in | Longs | Shorts | OI |
| Daily | 3% | 8% | 4% |
| Weekly | -3% | 19% | -1% |
Crude Oil Price Technical Analysis
Crude oil prices attempted to re-test the 200% Fibonacci extension level (US$ 66.51) with strong upward momentum. Prices are riding a clear bullish trend, which is well-supported by the 20-day SMA line. A failed attempt to breach US$ 66.51 may lead to a technical pullback towards an immediate support level at US$ 62.19 (the 161.8% Fibonacci extension), whereas a successful attempt would probably intensify buying pressure and carve a path for price to challenge the 261.8% Fibonacci level (US$ 73.48).
Crude Oil Price – Daily Chart
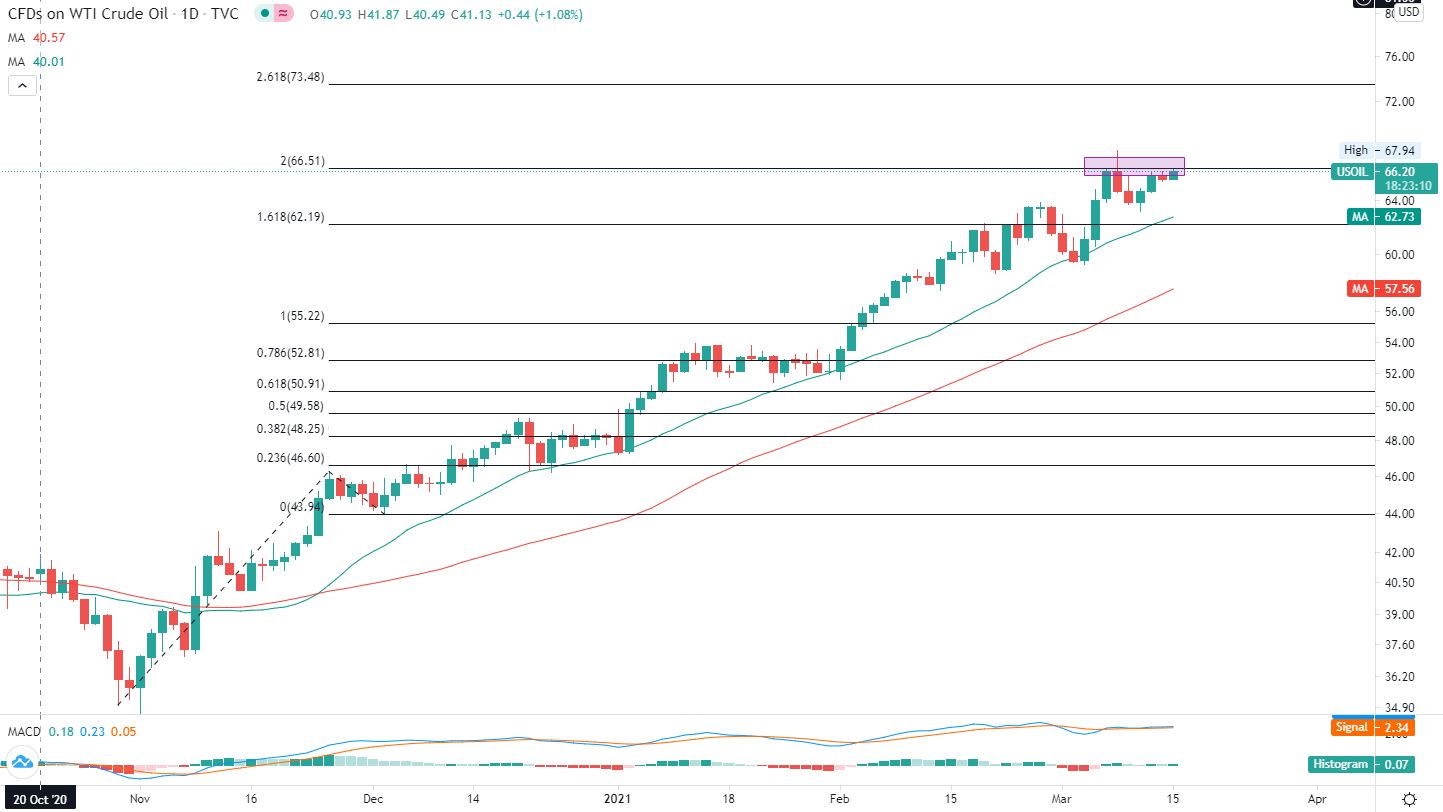
Chart by TradingView
{{GUIDE|BUILDING_CONFIDENCE_IN_TRADING }}
— Written by Margaret Yang, Strategist for DailyFX.com
To contact Margaret, use the Comments section below or @margaretyjy on Twitter
Be the first to comment