

GOLD PRICE OUTLOOK:
- Gold prices fell modestly as the 10-year inflation-indexed yield climbed after strong PPI readings
- US core inflation, retail sales and Chinese GDP data will be in focus this week
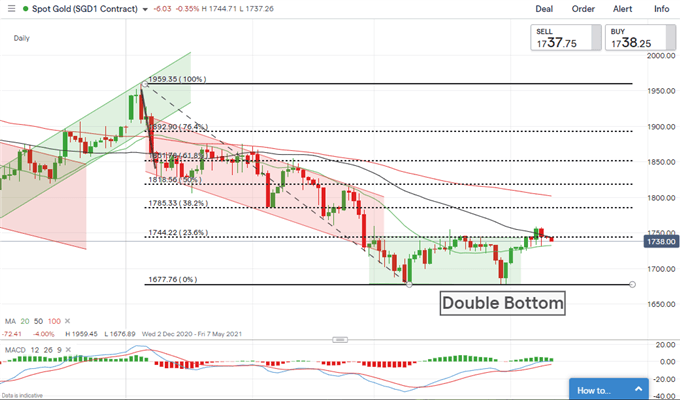
- Gold prices have likely formed a “Double Bottom” chart pattern, which may point to gains ahead

Recommended by Margaret Yang, CFA
How to Trade Gold
Gold prices retreated for a second day as real yields edged up after both Chinese and US PPI data came above market expectations on Friday. Price levels of goods at factory door surged 4.4% in China last month, marking the largest rise seen since August 2018. The reading also beat the baseline forecasts of 3.5%, suggesting that output prices are rising at a faster-than-expected pace as demand picks up. Similarly, US PPI in March came in at 1.0%, half of a percentage higher than economists’ forecasts.
Rising price levels of goods at factory doors hint at higher consumer price levels in the months to come, which led the longer-dated Treasury yields upward. The real yield (nominal yield – inflation), as represented by the 10-year inflation-indexed security, rose 2bps to -0.65% on Monday (chart below). Rising real yields rendered the yellow metal less attractive as an investment asset as the opportunity cost of holding it rises even when inflation is taken into consideration.
The DXY US Dollar index also edged up modestly , exerting downward pressure on precious metal prices. Silver lost -0.60%, platinum retreated -0.16%, palladium was down -0.27% on Monday morning.
Looking ahead, Tuesday’s release of US core CPI data will be closely monitored by gold traders. A higher-than-expected reading may benefit gold as the yellow metal is widely perceived as an inflation hedge. But in the meanwhile it may also boost the markets’ expectation for Fed tapering and result in a stronger USD. Thursday’s US retail sales figure and China’s Q1 GDP data on Friday are also in focus.
Gold Prices vs. 10-Year Treasury Inflation-Indexed Security
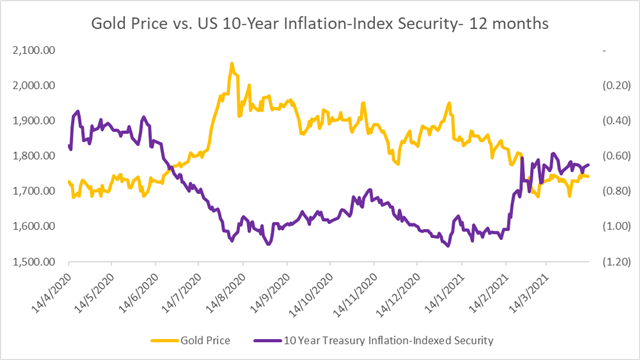
Source: Bloomberg, DailyFX
Technically, gold has likely formed a “Double Bottom” chart pattern after hitting US$ 1,677 twice. The “Double Bottom” pattern usually appears at the end of a downtrend and signals potential trend reversal. Prices are facing an immediate resistance level at US$ 1,744, where the 23.6% Fibonacci retracement and the 50-day SMA line intercept. A successful attempt to breach this level may open the door for further upside potential with an eye on US$ 1,785 – the 38.2% Fibonacci retracement. A swing lower however, may bring the next support level of US$ 1,677 (previous low) into fucus.
Gold Price – Daily Chart
| Change in | Longs | Shorts | OI |
| Daily | 1% | 3% | 1% |
| Weekly | 3% | 14% | 5% |
— Written by Margaret Yang, Strategist for DailyFX.com
To contact Margaret, use the Comments section below or @margaretyjy on Twitter
Be the first to comment