

Gold Price Talking Points
The price of gold trades to fresh monthly high ($1801) following the kneejerk reaction to the US Consumer Price Index (CPI), and the precious metal may continue to retrace the decline from the September high ($1834) as long as longer dated US Treasury yields remain under pressure.
Gold Price Trades Back Above 200-Day SMA Amid Falling US Yields
The price of gold attempts to trade back above the 200-Day SMA ($1795) as the 10-Year Treasury yield continues to pullback from the monthly high (1.64%), and looming data prints coming out of the US may keep the precious metal afloat as household spending is expected to contract for the fourth time in 2021.
The update to the US Retail Sales report is anticipated to show a 0.2% decline in September following the 0.7% expansion the month prior, and signs of a less robust recovery may fuel the recent series of higher highs and lows in the price of gold as it undermines speculation for an imminent shift in Fed policy.
However, an improvement in the U. of Michigan Confidence survey may keep the Federal Open Market Committee (FOMC) on track to scale back monetary support as the minutes from the September meeting reveals that “if a decision to begin tapering purchases occurred at the next meeting, the process of tapering could commence with the monthly purchase calendars beginning in either mid-November or mid-December.”
In turn, longer-dated US yields may continue to retrace the decline from earlier this year as the Fed plans to taper its purchases of Treasury securities and mortgage-backed securities (MBS) over the coming months, but mixed data prints coming out of the US may prop up the price of gold ahead of the next FOMC interest rate decision on November 3 as the central bank acknowledges that “the economy was still well below maximum employment.”
With that said, the price of gold may continue to retrace the decline from the September high ($1834) amid the recent weakness in longer dated US Treasury yields, but the recovery from the August low ($1682) may turn out to be a correction in the broader trend rather than a change in market behavior as the Fed prepares to switch gears.
Gold Price Daily Chart
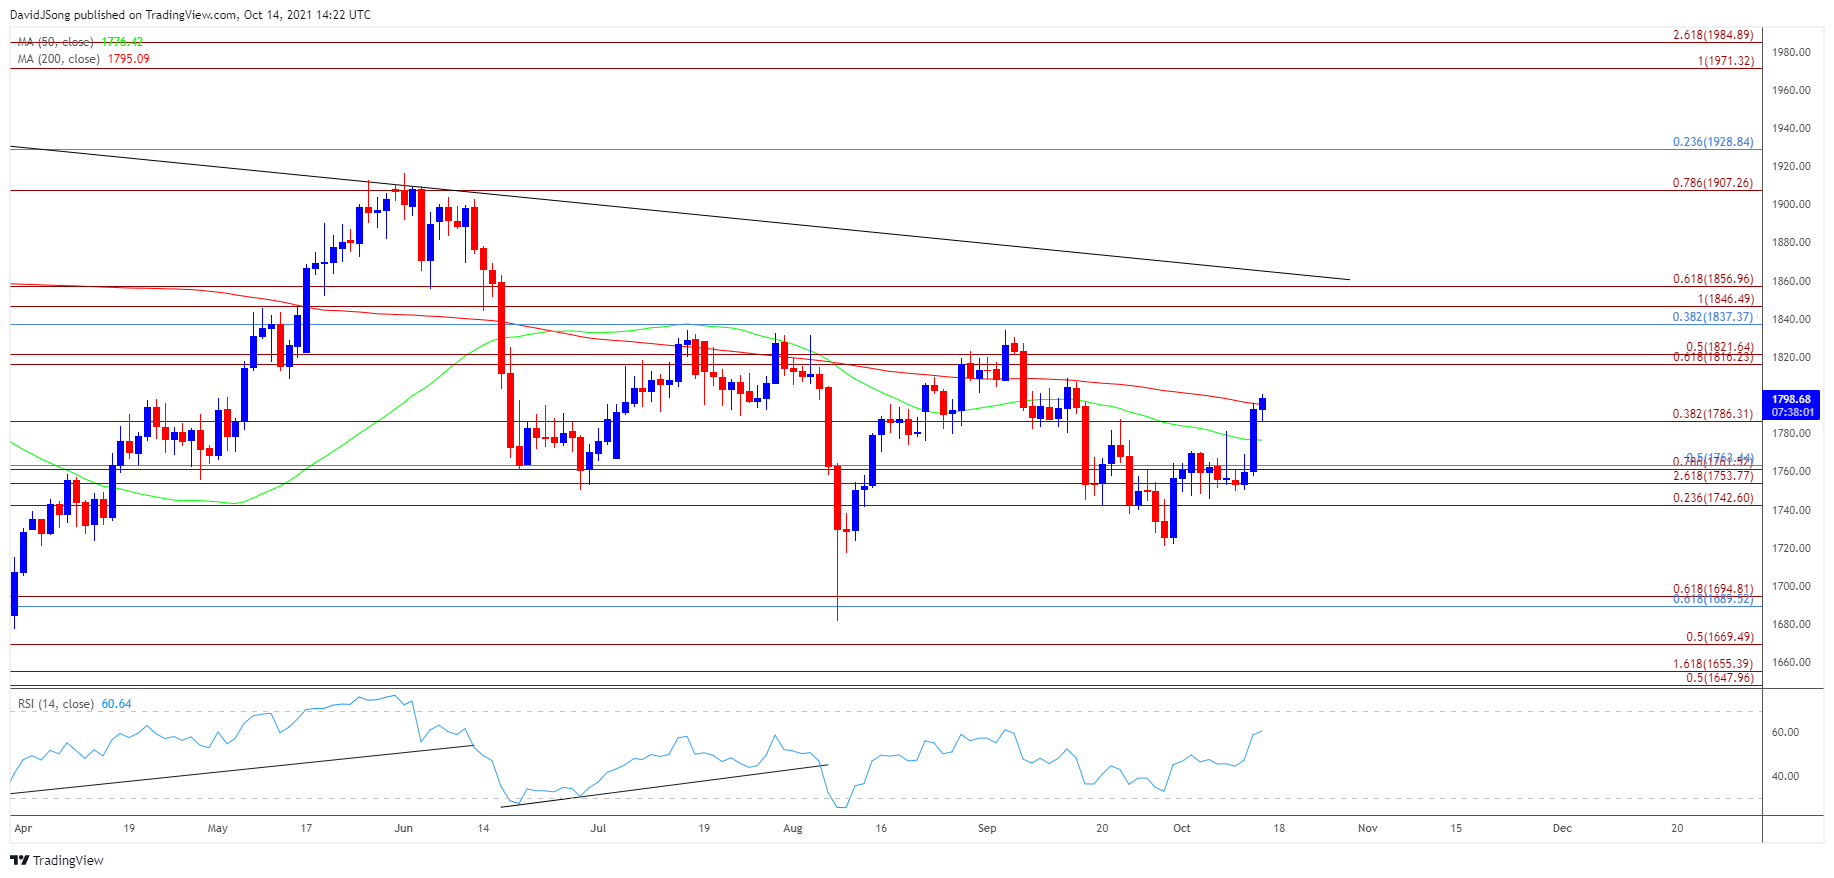
Source: Trading View
- Keep in mind, the negative slope in the 200-Day SMA ($1795) indicates that the broader trend for bullion remains tilted to the downside, with a ‘death cross’ formation taking shape in August as the Relative Strength Index (RSI) pushed into oversold territory.
- However, lack of momentum to test the March low ($1677) generated a textbook buy signal in the RSI as the oscillator climbed back above 30, with rebound from the August low ($1682) pushing the price of gold briefly above the 200-Day SMA ($1795) going into September.
- It remains to be seen if bullion will show a similar reaction to the 200-Day SMA ($1795) like the price action seen earlier this year as breaks above the moving average have been short-lived, but the close above the $1786 (38.2% expansion) area brings the $1816 (61.8% expansion) to $1822 (50% expansion) region on the radar as the price of gold extends the series of higher highs and lows from the start of the week.
- A break above the September high ($1834) may spur another run at the Fibonacci overlap around $1837 (38.2% retracement) to $1857 (61.8% expansion), with the next area of interest coming in around $1907 (78.6% expansion) to $1929 (23.6% retracement), which incorporates the June high ($1917).
- Need a move back below the $1786 (38.2% expansion) area to bring the overlap around $1743 (23.6% expansion) to $1763 (50% retracement), with a break below the September low ($1722) opening up the $1690 (61.8% retracement) to $1695 (61.8% expansion) region.
— Written by David Song, Currency Strategist
Follow me on Twitter at @DavidJSong
Be the first to comment