

Gold Price Talking Points
The price of gold appears to be on track to test the monthly low ($1829) as it extends the decline following the US Non-Farm Payrolls (NFP) report, and the precious metal may give back the rebound from the May low ($1787) if it snaps the opening range for June.
Gold Price to Eye May Low on Break of Monthly Opening Range
The price of gold snaps the recent series of higher highs and lows amid the broad based weakness across precious metals, and developments coming out of the US may sap the appeal of bullion as the Consumer Price Index (CPI) is expected to show easing price pressures.
Even though the headline reading is anticipated to hold steady at 8.3% per annum in May, the core rate of inflation is seen narrowing to 5.9% from 6.2% the month prior, and the development may keep the Federal Reserve on track to implement higher interest rates throughout 2022 as “most participants judged that 50 basis point increases in the target range would likely be appropriate at the next couple of meetings.”
It seems as though the Federal Open Market Committee (FOMC) will continue to normalize monetary policy at its next interest rate decision on July 27 as the central bank struggles to bring down inflation towards the 2% target, and it remains to be seen if Chairman Jerome Powell and Co. will prepare US households and businesses for a tightening cycle as “a restrictive stance of policy may well become appropriate depending on the evolving economic outlook.”
Until then, the price of gold may struggle to defend the rebound from the May low ($1787) as the ongoing shift in Fed policy props up US Treasury yields, and the precious metal may face headwinds over the remainder of the year as the FOMC shows a greater willingness to push the Fed Funds rate above its longer-run forecast.
With that said, the update to the US CPI may drag on the price of gold as the core rate is expected to reflect a slowdown in inflation, and the precious metal may fall back towards the May low ($1787) if it snaps the opening range for June.
Gold Price Daily Chart
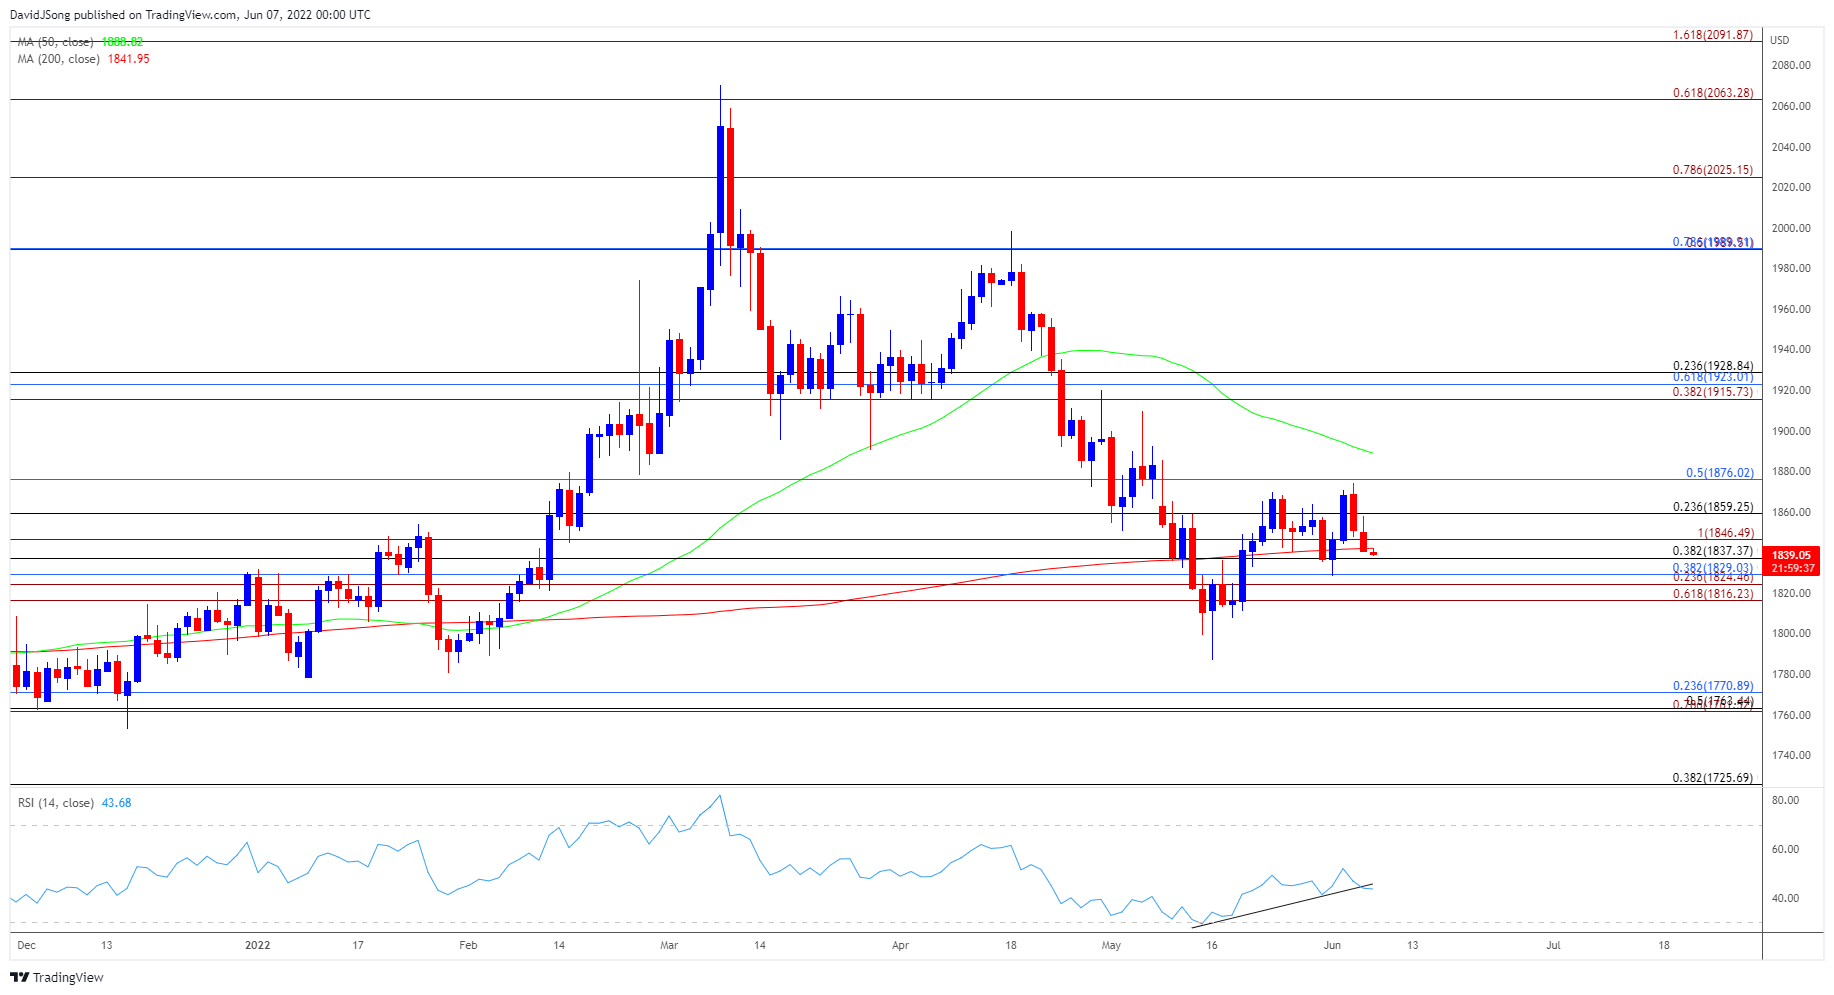
Source: Trading View
- The price of gold appeared to be on track to test the yearly low ($1779) as it traded below the 200-Day SMA ($1842) for the first time since February, but the advance from the May low ($1787) pushed the precious metal back above the moving average as the Relative Strength Index (RSI) developed an upward trend.
- However, the bullish momentum seems to be abating as the RSI pushes below trendline support, with the price of gold snapping the series of higher highs and lows from last week amid the failed attempt to break/close above the $1876 (50% retracement) region.
- Failure to defend the monthly low ($1829) along with a break/close below the $1825 (23.6% expansion) to $1829 (38.2% retracement) area may push the price of gold towards the $1816 (61.8% expansion) region, with a break below the May low ($1787) bringing the yearly low ($1779) back on the radar.
— Written by David Song, Currency Strategist
Follow me on Twitter at @DavidJSong
Be the first to comment