

XAU/USD ANALYSIS
- Gold/U.S. Treasury correlation flips.
- Dollar in focus.
- Spot gold prices tests key long-term levels.
GOLD FUNDAMENTAL BACKDROP
The historical inverse relationships between gold and both the greenback and U.S. Treasury yields respectively are weighing in on the precious metal. The Dollar Index (DXY) has held its high level of negative correlation to gold while bond yields have been displaying a change of heart since late April 2021 (note correlation does not mean causation!).
The chart below illustrates this phenomenon as seen by the green and white synchronicity towards the right hand side of the chart. It seems as if the dollar is the main driver for gold prices between the two. The current low interest rate environment also accommodates higher gold prices but unfortunately for gold bulls, the prices do not reflect the underlying fundamentals at this moment.
Spot Gold vs U.S. 10-year Treasury yield vs DXY:
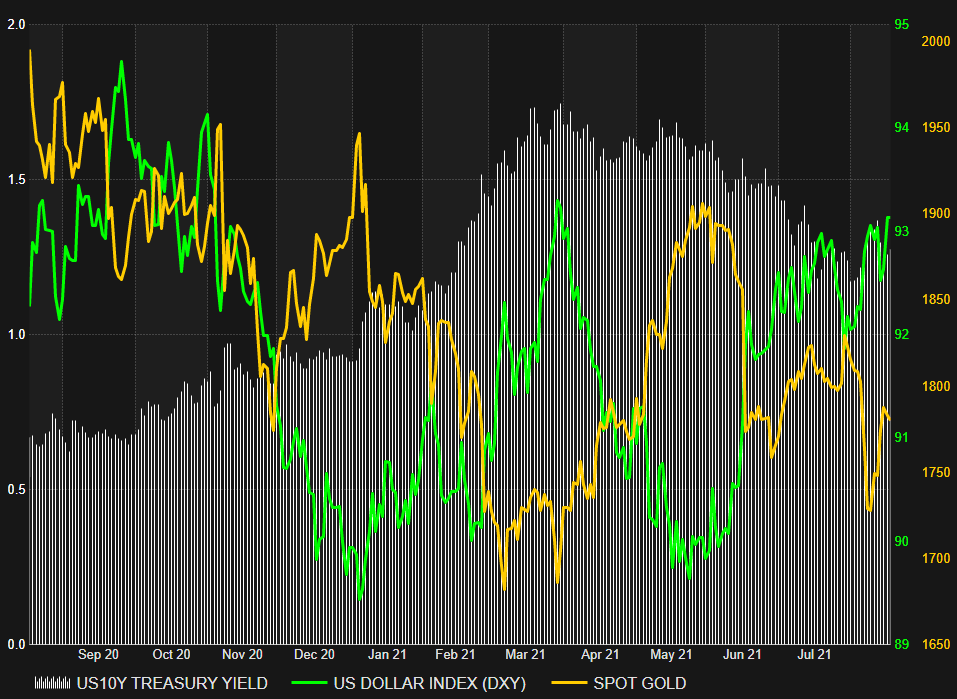
Source: Refinitiv Datastream
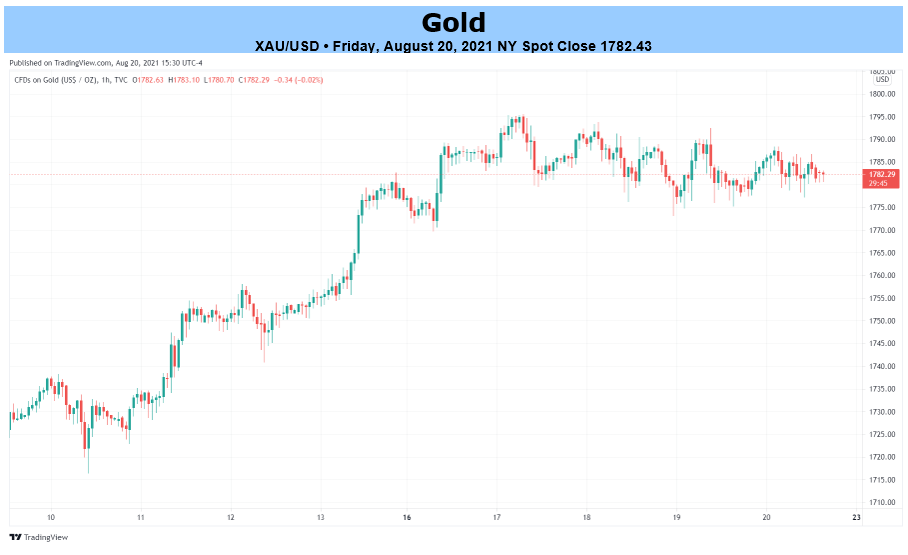
Fundamentally, we may see a rally in gold with the delta variant plaguing much of the developing world as well as many key financial and logistical hubs such as the recent China port shutdown as well as Australia and New Zealand’s ‘zero tolerance’ approach to COVID-19. The safe-haven affinity with gold has been helping prices hold its head above key levels since the selloff two weeks prior.
The FOMC minutes held last week Wednesday gave some guidance to market participants that QE tapering will resume before the end of 2021. In 2013, taper talk led to rising Treasury yields which hammered gold prices. The approach from the Fed has been more cautious this time around with markets relatively unresponsive to last week’s meeting.
Many people are linking tapering to tightening which should not be the case as tapering simply refers to a slowing of asset purchases and not an increase in interest rates in the short to medium-term. Therefore, the current low interest rate condition will remain for some time providing a medium-term backdrop for gold resilience. Unfortunately, taper talk, improving U.S. economic data and geopolitical tensions concurrently favor the U.S. dollar – which may not unfold well for spot gold.
GOLD ECONOMIC CALENDAR
The calendar for next week is dominated by the Jackson Hole Economic Symposium on Thursday along with a few high impact dollar related announcements – favorable data prints will likely reflect negatively on spot gold.
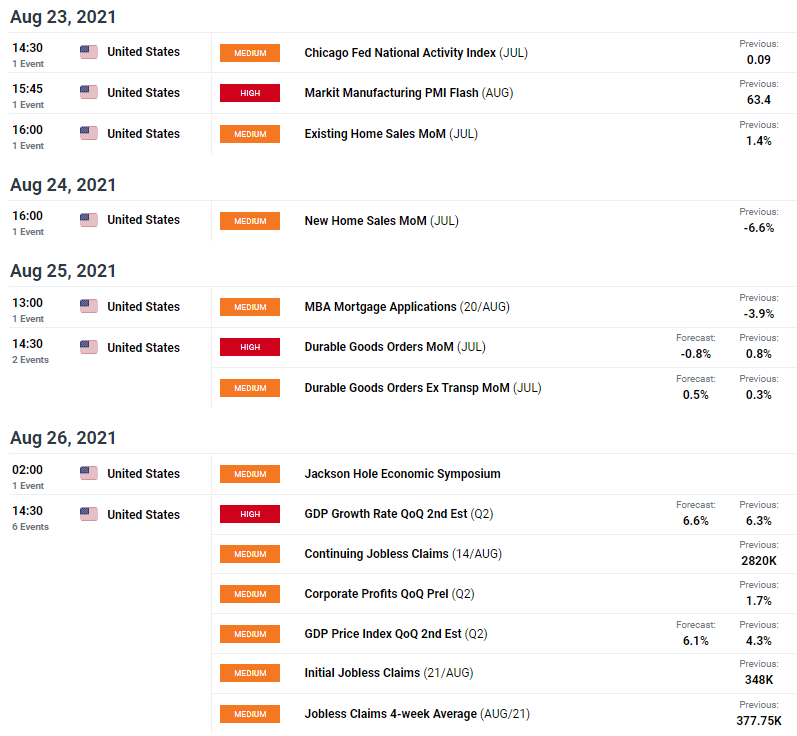
Source: DailyFX economic calendar
TECHNICAL ANALYSIS
GOLD PRICE WEEKLY CHART
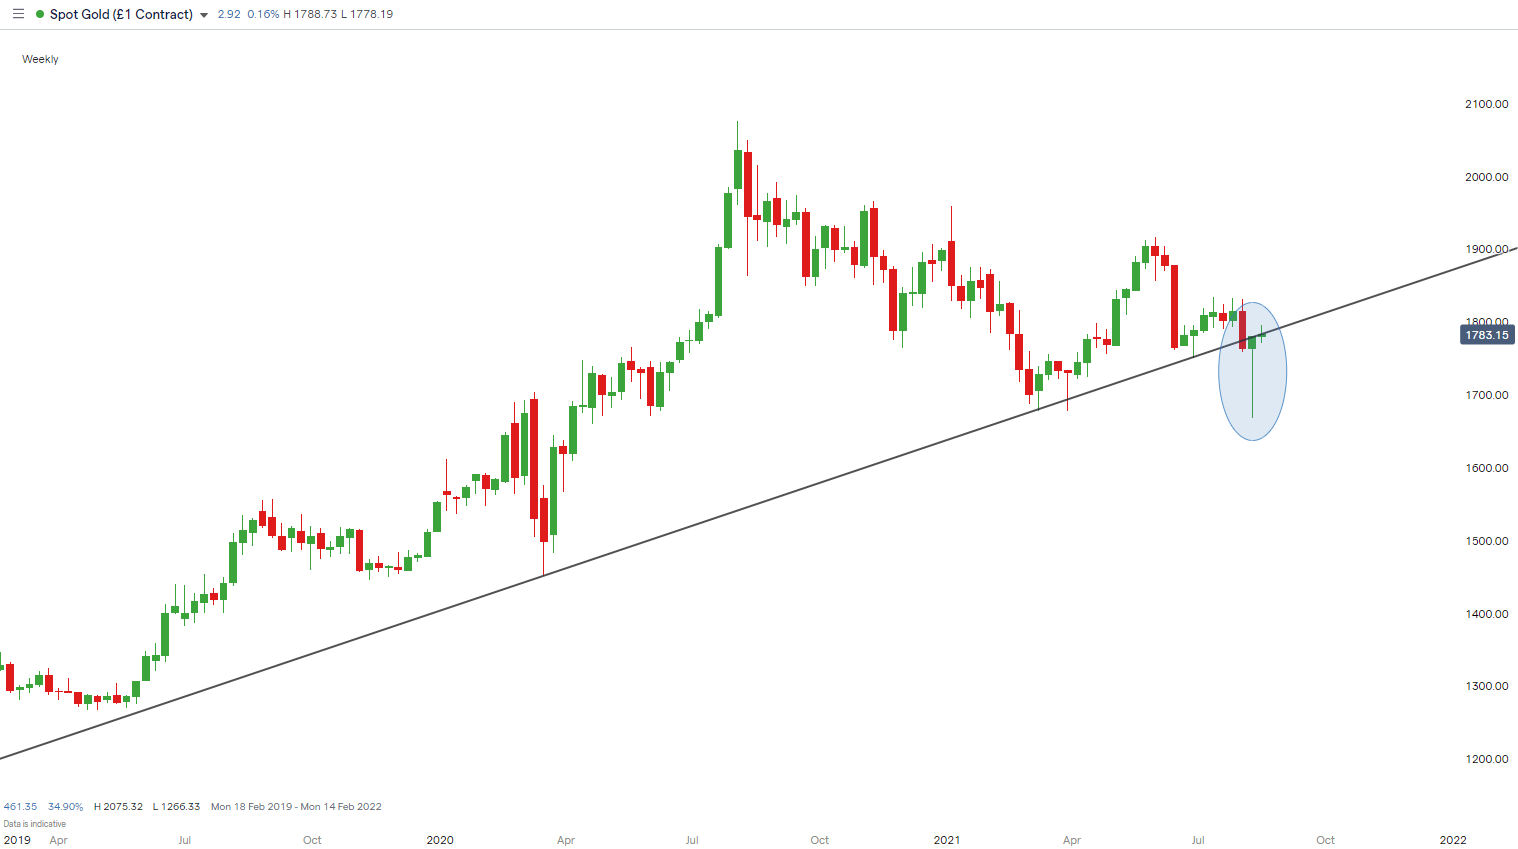
Chart prepared by Warren Venketas, IG
The weekly spot gold chart above highlights the firm trendline support (black) spanning back the last few years without a successful candle close break below. Last week prices dropped but soon recovered and ended the week above support. This extended long wick candle (blue) often appears at key levels across all markets and traditionally precedes a move higher. A confirmation close below support may open space for further downside while a close above could see prices clawing back recent losses.
GOLD PRICE DAILY CHART
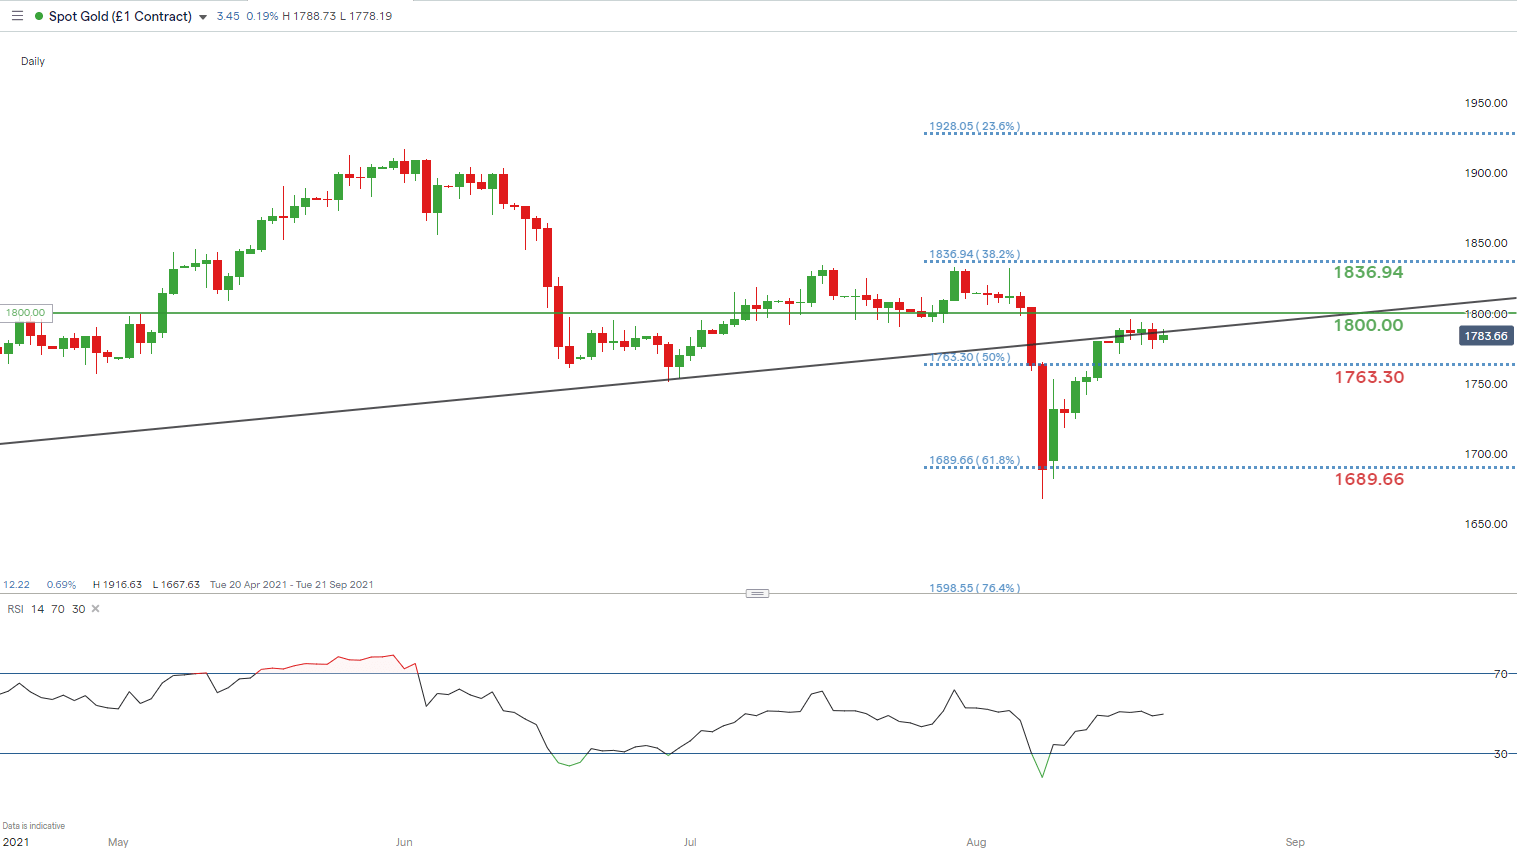
Chart prepared by Warren Venketas, IG
Focusing in on the daily chart, key Fibonacci levels have been tested with the 61.8% at 1689.66 holding as horizontal support. The current consolidation illustrated by the cluster of small daily candles this week shows indecision by bulls and bears as they await directional stimulus. This sideways move may form a potential bull flag pattern and upside could come from a close above trendline support (black) towards the 1800.00 psychological level.
Resistance levels:
Support levels:
— Written by Warren Venketas for DailyFX.com
Contact and follow Warren on Twitter: @WVenketas
Be the first to comment