

Gold Price Talking Points
The price of gold trades to a fresh weekly low ($1795) following the better-than-expected US Non-Farm Payrolls (NFP) report, and the technical outlook casts a bearish forecast for bullion as a ‘death cross’ formation looks poised to take shape over the coming days.
Gold Price Remains Susceptible to Death Cross Formation Following NFP
The price of gold extends the decline from the weekly high ($1832) as the NFP report shows the US economy adding 943K jobs in July versus forecasts for an 870K print, and signs of a more robust recovery may continue to dampen the appeal of bullion as it puts pressure on the Federal Reserve to scale back its emergency measures.
Speculation for looming Fed exit strategy may keep the price of gold under pressure as the upbeat NFP figure pushes the 10-Year US Treasury yield to a fresh weekly high ($1.29%), and Chairman Jerome Powell and Co. may change their tone over the coming months as the central bank pledges to “provide advance notice before making any changes to our purchases.”
As a result, the price of gold appears to have reversed course following the string of failed attempts to test the July high ($1834), and the rebound from the June low ($1751) may continue to unravel as the 50-Day ($1819) and 200-Day ($1818) reflect a negative slope.
With that said, the price of gold may continue to give back the rebound from the June low ($1751) as the double-bottom formation from earlier this year seems to have run its course,and the technical outlook casts a bearish forecast for bullion as a ‘death cross’ formation looks poised to take shape over the coming days.
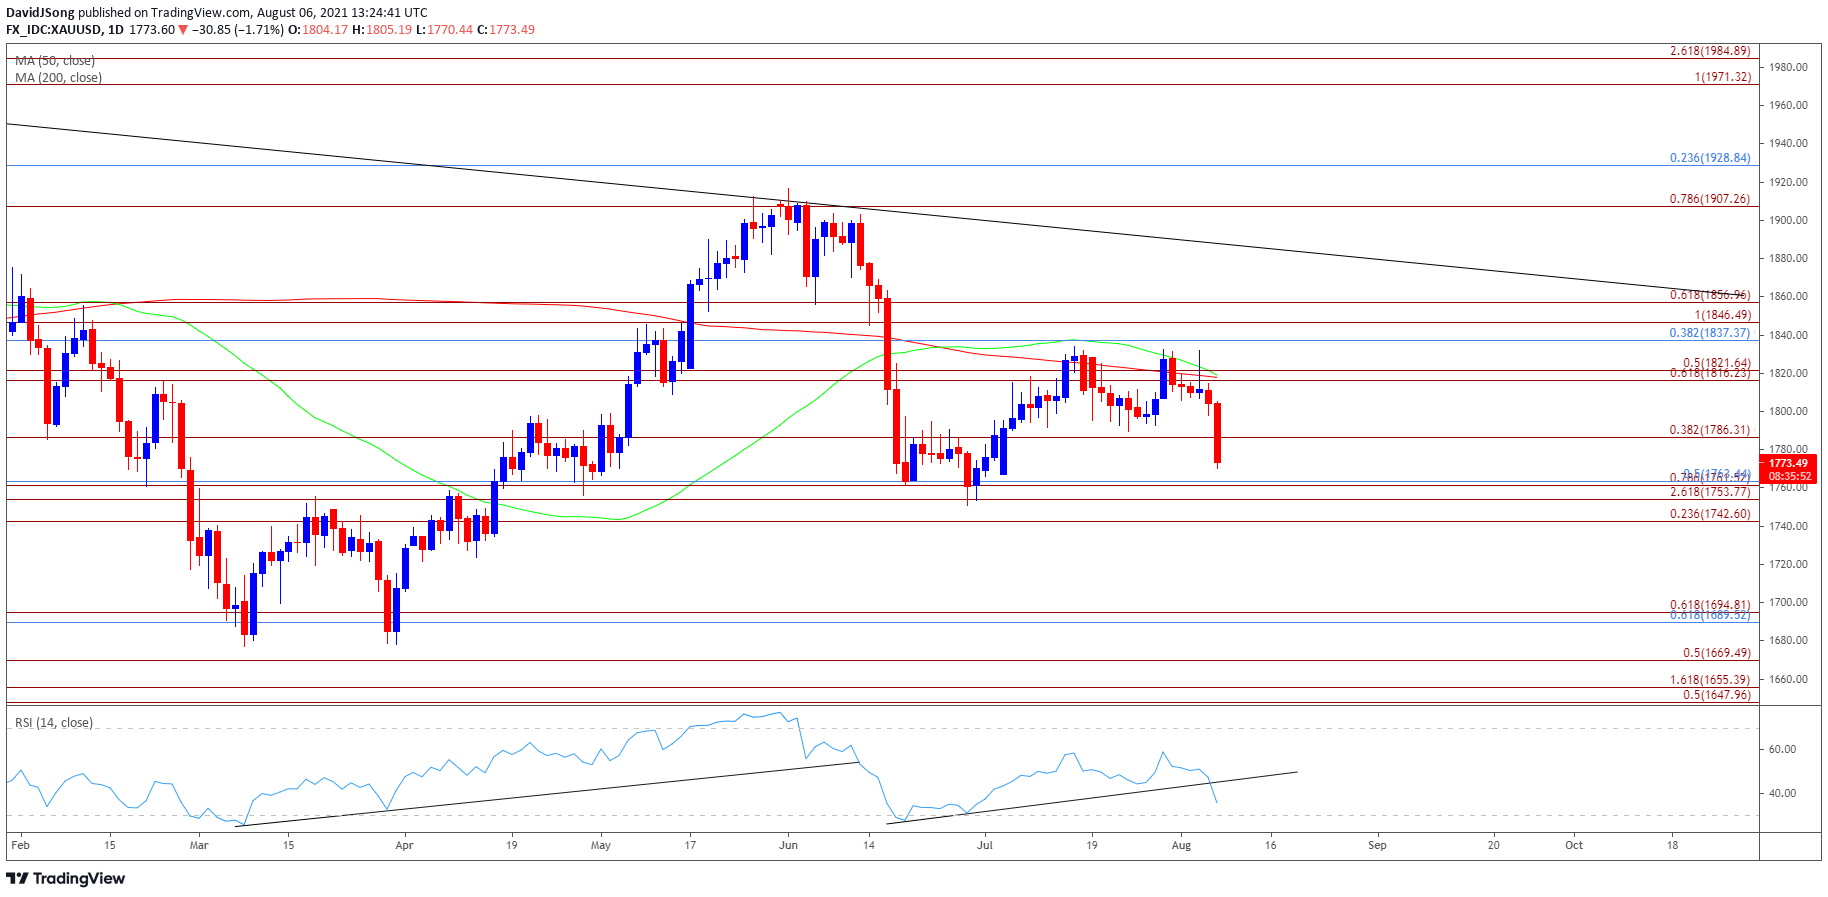
Gold Price Daily Chart
Source: Trading View
- Keep in mind, a double-bottom emerged in March as the price of gold failed to test the June 2020 low ($1671), with the key reversal pattern pushing the precious metal back above the 200-Day SMA ($1818) for the first time since February.
- At the same time, the Relative Strength Index (RSI) pushed into overbought territory for the first time since July 2020 as the price of gold appeared to be on track to test the January high ($1959), but the double-bottom formation seems to have run its course as the RSI no longer tracks the upward trend from earlier this year.
- The negative slopes in both the 50-Day ($1819) and 200-Day ($1818) SMAs indicate that the broader trend for bullion remains tilted to the downside, with the moving averages on the cusp of showing a ‘death cross’ formation.
- In turn, the price of gold appears to have reversed course following the string of failed attempt to test the July high ($1834) as it slips back below the 50-Day SMA ($1819), with the move below the $1786 (38.2% expansion) region bringing the Fibonacci overlap around $1743 (23.6% expansion) to $1763 (50% retracement) on the radar, which lines up with the June low ($1751).
- Next area of interest comes in around $1690 (61.8% retracement) $1695 (61.8% expansion), with a break of the March low ($1677) opening up the $1670 (50% expansion) region.
— Written by David Song, Currency Strategist
Follow me on Twitter at @DavidJSong
Be the first to comment