

GOLD OUTLOOK: XAU/USD PRICE EXTENDS RALLY WITH REAL YIELDS UNDER PRESSURE
- Gold price action popped another 1% on Wednesday as real yields slid further
- A somewhat softer US Dollar could also be helping propel XAU/USD higher
- The precious metal might surrender recent gains if Treasury yields rebound
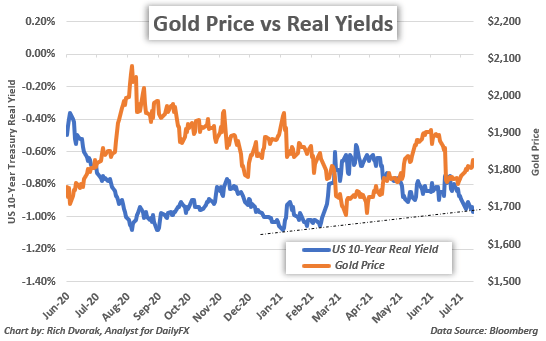
Gold price action has advanced for eight out of the last ten trading sessions. XAU/USD is now up 3.2% month-to-date following Wednesday’s 1% rally toward the $1,830-price level. Gold prices seem to be gaining ground with real yields back in free-fall mode. In fact, the real yield on ten-year US Treasuries just dropped to its lowest level since 12 February at -0.97%.
US Dollar bears fading yesterday’s influx of strength following red-hot inflation data could be putting upward pressure on gold prices as well. Not to mention, during his congressional testimony earlier today, Fed Chair Powell warned against acting prematurely to curb recent inflation. Keeping interest rates low while looking through rising inflation is a bullish environment for gold as this stands to keep real yields suppressed.
GOLD PRICE CHART WITH TEN-YEAR TREASURY REAL YIELD OVERLAID
I discuss this and the potential for gold and silver price action to recover from June’s nasty -7% selloff in my Q3 top trade idea. Specifically, I think the odds are considerable that Fed officials continue looking inflation and delaying the taper timeline. This might correspond with an unwind of Fed rate hike bets, which would likely fuel gold prices higher as real yields are dragged lower in response.
That said, the pullback in Treasury yields does seem slightly overdone. A rebound higher in yields thus poses a potential headwind for gold. From a technical perspective, gold price action also faces confluent resistance around the $1,835-level. This technical obstacle is highlighted by the 50-day simple moving average, upper Bollinger Band, and 38.2% Fibonacci retracement of the August 2020 to March 2021 trading range. These technical barriers might keep a lid on upward momentum, but another leg lower in real yields could catalyze a topside breakout toward the $1,900-handle.
Keep Reading – The Basics of Technical Analysis
— Written by Rich Dvorak, Analyst for DailyFX.com
Connect with @RichDvorakFX on Twitter for real-time market insight
Be the first to comment