

Gold Price Talking Points
The price of gold gives back the advance following the Federal Reserve interest rate decision as the 10-Year US Treasury yield climbs to a fresh weekly high (1.68%), and fresh data prints coming out of the US economy may keep the precious mental under pressure as the update to the Personal Consumption Expenditure (PCE) Price Index is anticipated to show a rise in inflation.
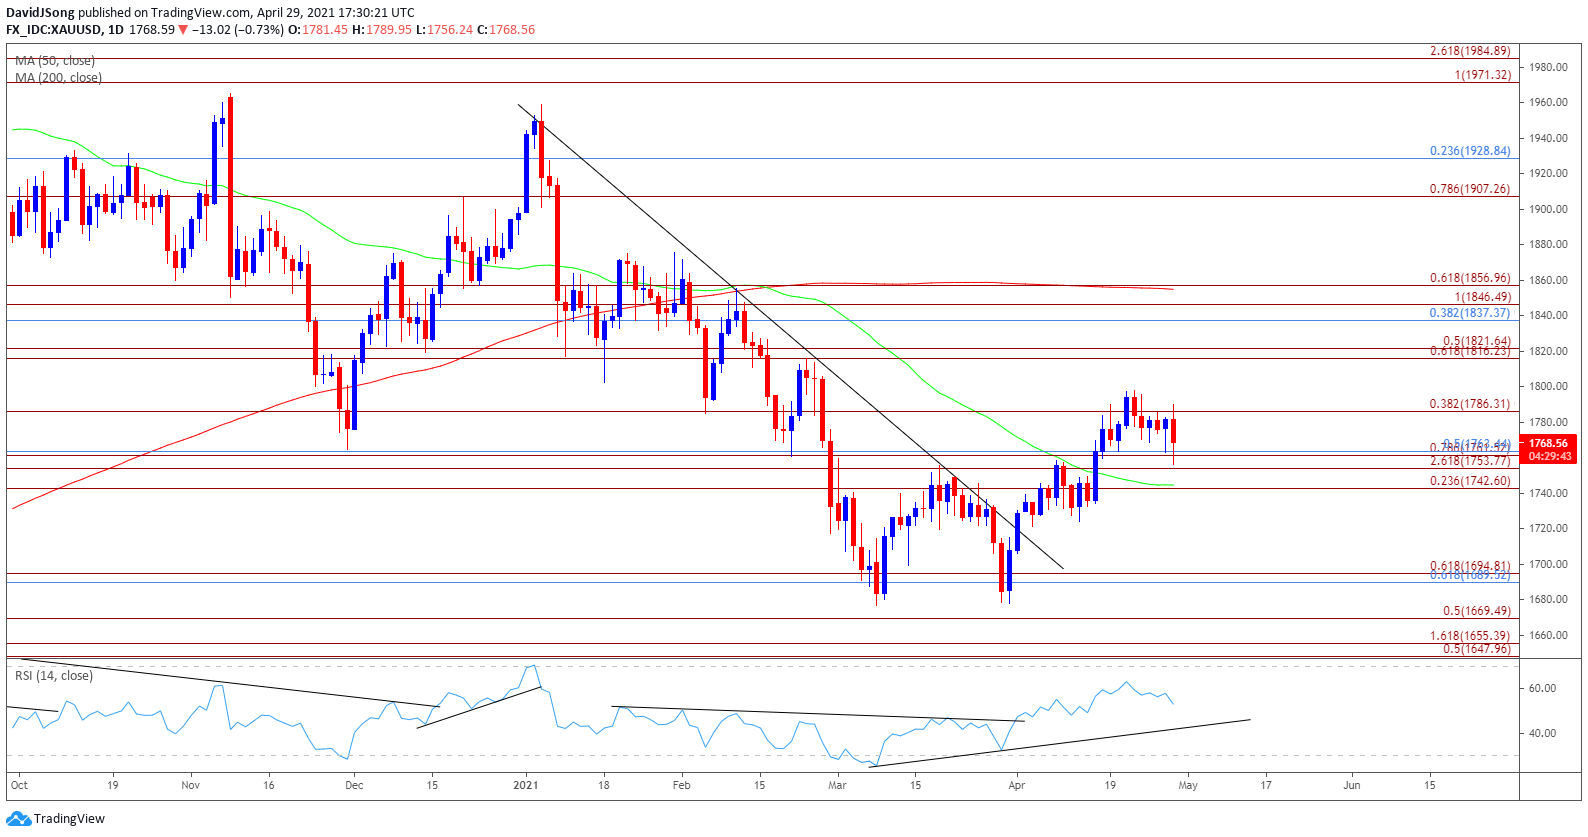
Gold Price Pares Post-Fed Gain Amid Rise in US Treasury Yields
The double-bottom formation from March appears to have run its course as the price of gold reveres ahead of the $1800 handle, and the key reversal pattern may continue to unravel as the precious metal extends the decline from the monthly high ($1798).
It remains to be seen if the update to the PCE Price Index will influence the price of gold as the Fed’s preferred gauge for inflation is anticipated to hit a two-year high of 1.8% from 1.4% in February, but signs of a stronger economic recovery may keep longer-dated US Treasury yields afloat even though the Federal Open Market Committee (FOMC) stays on track to “increase our holdings of Treasury securities by at least $80 billion per month and of agency mortgage-backed securities by at least $40 billion per month.”
In turn, the 10-Year US Treasury yield may climb towards the yearly high (1.77%) as it appears to be breaking out of a bull-flag formation, and a further recovery in longer-dated Treasury yields may push the price of gold back below the 50-Day SMA ($1745) as it reverses course ahead of a key psychological figure.
With that said, the decline from record high ($2075) may continue to underscore a change in trend as a ‘death cross’ formation takes shape in 2021, and the precious metal may reestablish the downward trend from earlier this year as the double-bottom formation from March unravels.
Gold Price Daily Chart
Source: Trading View
- Keep in mind, the price of gold pushed to fresh yearly highs throughout the first half 2020, with the bullish price action also taking shape in August as the precious metal tagged a new record high ($2075).
- However, the bullish behavior failed to materialize in September as the price of gold traded below the 50-Day SMA ($1745) for the first time since June, with developments in the Relative Strength Index (RSI) negating the wedge/triangle formation established in August as the oscillator slipped to its lowest level since March.
- Since then, the decline from the record high ($2075) indicates a potential shift in market behavior as the RSI dipped into oversold territory for the first time since 2018, with a ‘death cross’ formation taking shape earlier this year as the 50-Day SMA ($1745) developed a negative slope.
- A double-bottom emerged as the price of gold failed to test the June 2020 low ($1671), but the key reversal pattern appears to have run its course as the precious metal reverses course ahead of the $1800 handle.
- Need a break/close below the Fibonacci overlap around $1743 (23.6% expansion) to $1763 (50% retracement) to bring the $1690 (61.8% retracement) to $1695 (61.8% expansion) region back on the radar, with a move below the March low ($1677) opening up the $1670 (50% expansion) area, which largely lines up with the June 2020 low ($1671).
— Written by David Song, Currency Strategist
Follow me on Twitter at @DavidJSong
Be the first to comment