Gold Price Talking Points
The price of gold snaps the series of higher highs and lows from the March low ($1677) as the US 10-Year Treasury yield climbs to a fresh yearly high (1.64%), and it remains to be seen if the Federal Reserve’s March meeting will influence the near-term outlook for bullion as the central bank is slated update the Summary of Economic Projections (SEP).
Gold Price Outlook Mired by Failure to Test March High
The recent rebound in the price of gold appears to be losing steam as the precious metal struggles to test the March high ($1760), and bullion may consolidate ahead of the Federal Open Market Committee (FOMC) interest rate decision on March 17 as the central bank is expected to retain the current course for monetary policy.
It seems as though the FOMC will stick to the same script asChairman Jerome Powell warns that “it’s not at all likely that we’d reach maximum employment this year,” and more of the same from Fed officials may keep the price of gold above the June 2020 low ($1671) as the central bank appears to be in no rush to scale back its emergency measures.
However, the 379K rise in US Non-Farm Payrolls (NFP) may encourage the FOMC to adopt an improve outlook especially as Congress passes the $1.9 trillion coronavirus recovery package, and fresh forecasts from Chairman Powell and Co. may sway financial markets if the central bank shows a greater willingness to scale back its emergency measures. In turn, a less dovish forward guidance may sap the appeal of gold amid the ongoing rise in longer-dated US Treasury yields, and the decline from the record high ($2075) may continue to indicate a change in trend as a ‘death cross’ formation takes shape in 2021.
With that said, the recent rebound in the price of gold may end up being short lived as ballooning central bank balance sheets no longer provide a backstop for bullion, and the Fed’s outcome based approach for monetary policy may continue to drag on gold prices amid the persistent rise in longer-dated US Treasury yields.
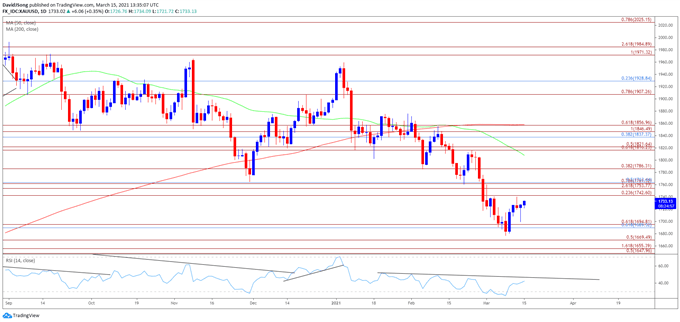
Gold Price Daily Chart
Source: Trading View
- Keep in mind, the price of gold pushed to fresh yearly highs throughout the first half 2020, with the bullish price action also taking shape in August as the precious metal tagged a new record high ($2075).
- However, the bullish behavior failed to materialize in September as the price of gold traded below the 50-Day SMA ($1808) for the first time since June, with developments in the Relative Strength Index (RSI) negating the wedge/triangle formation established in August as the oscillator slipped to its lowest level since March.
- The RSI dipped into oversold territory in November for the first time since 2018, with thedecline from the record high ($2075) indicating a potential shift in market behavior as the price of gold took out the November low ($1765).
- It seems as though oversold readings in the RSI will be a reoccurring theme in 2021 as the oscillator still tracks the downward trend established earlier this year, but the failed attempt to test the June 2020 low ($1671) has pushed the price of gold back above the $1690 (61.8% retracement) to $1695 (61.8% expansion) region, with the precious metal coming up against the Fibonacci overlap around $1743 (23.6% expansion) to $1763 (50% retracement).
- Need a break/close above the Fibonacci overlap around $1743 (23.6% expansion) to $1763 (50% retracement) to bring the $1786 (38.2% expansion) region back on the radar, with the next area of interest coming in around $1816 (61.8% expansion) to $1822 (50% expansion).


Recommended by David Song
Traits of Successful Traders
— Written by David Song, Currency Strategist
Follow me on Twitter at @DavidJSong


Be the first to comment