

Gold Price Talking Points
The price of gold consolidates as US lawmakers pass a $2T fiscal stimulus package, but the flight to safety may push the precious metal towards the yearly high ($1704) as market participants look for an alternative to fiat currencies.
Gold Price Levels to Watch Following US Fiscal Stimulus Program
The price of gold appears to be stuck in a narrow range amid the wave of monetary and fiscal support, and it seems as though major central banks will continue to push monetary policy into uncharted territory as the Reserve Bank of New Zealand (RBNZ) unveils a new credit facility that “will provide liquidity in exchange for eligible Corporate and Asset-Backed securities.”
At the same time, the Federal Reserve appears to be on track to implement more non-standard measures as the central bank prepares a“Main Street Business Lending Program to support lending to eligible small-and-medium sized businesses,” and the Federal Open Market Committee (FOMC) along with its major counterparts may continue to push the limits of monetary policy as their benchmark interest rate sit near zero.
It seems as though the non-standard measures have helped to shore up trader sentiment as US equities temporarily moved into ‘bull market’ status, but the unconventional tools may ultimately lead to unintended consequences as major central banks utilize their balance sheets to combat the weakening outlook for global growth.
It remains to be seen if the unprecedented response by monetary and fiscal authorities will restore investor confidence amid the growing number of COVID-19 cases, but the low interest rate environment may act as a backstop for goldas marketparticipants look for an alternative to fiat-currencies,
In turn, the broader outlook for bullion remains constructive as the reaction to the former-resistance zone around $1450 (38.2% retracement) to $1452 (100% expansion) helped to rule out the threat of a Head-and-Shoulders formation, with the precious metal highlighting a similar behavior in March as the price of gold bounces back from the monthly low ($1451).

Recommended by David Song
Download the 1Q 2020 Forecast for Gold
Sign up and join DailyFX Currency Strategist David Song LIVE for an opportunity to discuss potential trade setups.
Gold Price Daily Chart
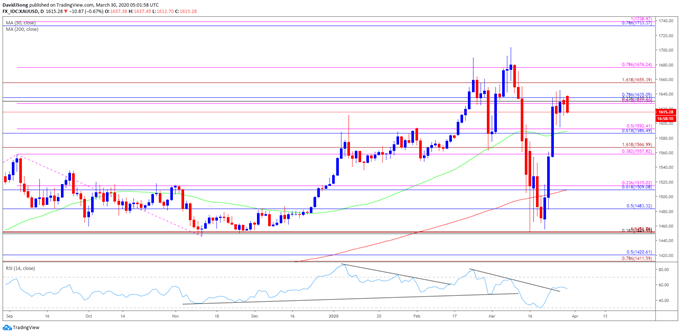
Source: Trading View
- The opening range for 2020 instilled a constructive outlook for the price of gold as the precious metal cleared the 2019 high ($1557), with the Relative Strength Index (RSI) pushing into overbought territory during the same period.
- A similar scenario materialized in February, with the price of gold marking the monthly low ($1548) during the first full week, while the RSI broke out of the bearish formation from earlier this year to push back into overbought territory.
- However, the price of gold has failed to maintain the monthly opening range for March after trading to a fresh yearly high ($1704), with the recent decline producing a break of the January low ($1517).
- Nevertheless, the reaction to the former-resistance zone around $1450 (38.2% retracement) to $1452 (100% expansion) casts a constructive outlook for bullion especially as the RSI reverses course ahead of oversold territory and breaks out of the bearish formation carried over from the previous month.
- Need a close above the Fibonacci overlap around $1627 (61.8% expansion) to $1635 (78.6% retracement) to bring the $1655 (161.8% expansion) region on the radar, with the next area of interest coming in around $1676 (78.6% expansion) followed by the yearly high ($1704).

Recommended by David Song
Traits of Successful Traders
— Written by David Song, Currency Strategist
Follow me on Twitter at @DavidJSong
Be the first to comment