

Gold price started a fresh decline and traded below $1,650. Crude oil price is holding the $84.25 support and might start a fresh increase.
Important Takeaways for Gold and Oil
· Gold price failed to surpass $1,680 and started a fresh decline against the US Dollar.
· There is a key bearish trend line forming with resistance near $1,638 on the hourly chart of gold.
· Crude oil price is showing positive signs above the $84.25 support zone.
· There is a major bullish trend line forming with support near $83.80 on the hourly chart of XTI/USD.
Gold Price Technical Analysis
Gold price failed to gain strength for a move above the $1,680 resistance against the US Dollar. The price started a fresh decline and traded below the $1,650 support level.
There was a clear move below the $1,640 support zone and the 50 hourly simple moving average. The price traded as low as $1,622 on FXOpen and recently there was a recovery wave. The price was able to clear the $1,630 resistance zone.
However, the price failed to clear $1,645 and started another decline. It traded below the 50% Fib retracement level of the upward move from the $1,622 swing low to $1,645 high.
It is now trading below the $1,630 level. There was also a move below the 76.4% Fib retracement level of the upward move from the $1,622 swing low to $1,645 high. An immediate support on the downside is near the $1,622 level.
The next major support is near the $1,620 level, below which there is a risk of a larger decline. In the stated case, the price could decline sharply towards the $1,600 support zone.
On the upside, the price is facing resistance near the $1,635 level. The first major resistance is near the $1,638 level. There is also a key bearish trend line forming with resistance near $1,638 on the hourly chart of gold.
The main resistance is now forming near the $1,645 level, above which it could even test $1,650. A clear upside break above the $1,650 resistance could send the price towards $1,680.
Oil Price Technical Analysis
Crude oil price started a fresh decline from the $86.92 resistance zone against the US Dollar. The price traded below the $85.00 support zone to move into a short-term bearish zone.
The price even traded below the 38.2% Fib retracement level of the upward move from the $81.27 swing low to $86.92 high. However, the bulls were seen active near the $84.25 support zone and the 50 hourly simple moving average.
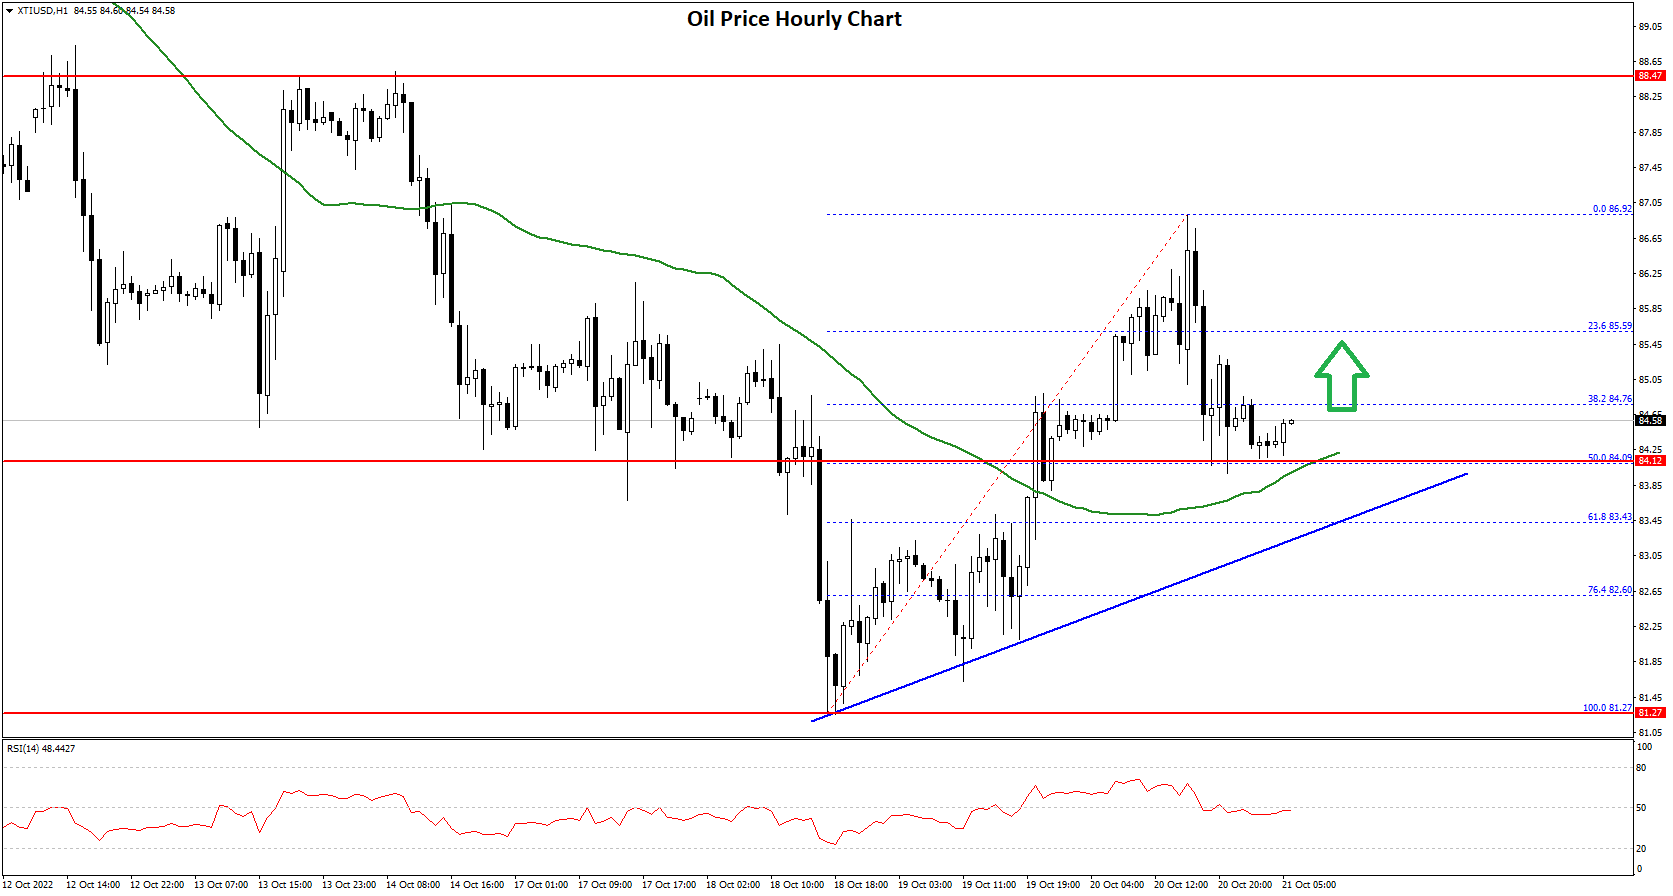
The price stayed above the 50% Fib retracement level of the upward move from the $81.27 swing low to $86.92 high. There is also a major bullish trend line forming with support near $83.80 on the hourly chart of XTI/USD.
It is now facing resistance near the $84.75 level. The main resistance sits near the $85.50 level, above which the price might accelerate higher towards $86.50 or even $87.00.
On the downside, an immediate support is near the $84.25 level. The next major support is near the $83.80 level. If there is a downside break, the price might decline towards $82.00. Any more losses may perhaps open the doors for a move towards the $80.00 support zone.
This forecast represents FXOpen Companies opinion only, it should not be construed as an offer, invitation or recommendation in respect to FXOpen Companies products and services or as financial advice.
Trade global forex with the best ECN broker of 2021*.
Choose from 50+ forex markets 24/5.
Open your FXOpen account now or learn more about making your money go further with FXOpen.
* FXOpen International, best ECN broker of 2021, according to the IAFT
Start trading commodities with tight spreads. Enjoy all the benefits of the best ECN broker of 2021* when you trade commodity CFDs with FXOpen.
Open your trading account now or learn more about making your money go further with FXOpen.
* FXOpen International, best ECN broker of 2021, according to the IAFT

Be the first to comment