

Gold price is struggling below the $1,850 resistance zone. Crude oil price is declining and might even trade below the $100 support zone.
Important Takeaways for Gold and Oil
· Gold price struggled above $1,850 and corrected lower against the US Dollar.
· There was a break below a key bullish trend line with support near $1,825 on the hourly chart of gold.
· Crude oil price started a downside correction from the $116 and $118 resistance levels.
· There is a major bearish trend line forming with resistance near $104.00 on the hourly chart of XTI/USD.
Gold Price Technical Analysis
Gold price struggled to gain pace above the $1,850 resistance zone against the US Dollar. The price started a fresh decline and traded below the $1,840 pivot level.
There was a clear move below the $1,825 support zone and the 50 hourly simple moving average. Besides, there was a break below a key bullish trend line with support near $1,825 on the hourly chart of gold.
The price traded as low as $1,821 on FXOpen and the price is now consolidating losses. On the upside, the price is facing resistance near the $1,828 level.
The 23.6% Fib retracement level of the downward move from the $1,846 swing high to $1,821 low is also near the $1,828 zone to act as a resistance. The main resistance is now forming near the $1,830 level.
The 50% Fib retracement level of the downward move from the $1,846 swing high to $1,821 low is also near the $1,832 zone. A close above the $1,832 level could open the doors for a steady increase towards $1,850. The next major resistance sits near the $1,860 level.
On the downside, an initial support is near the $1,820 level. The next major support is near the $1,805 level, below which there is a risk of a larger decline. In the stated case, the price could decline sharply towards the $1,780 support zone.
Oil Price Technical Analysis
Crude oil price also struggled to stay above the $120 level and started a fresh decline against the US Dollar. The price declined below the $110 support zone to move into a bearish zone.
There was a clear move below the $108 support zone and the 50 hourly simple moving average. The price traded as low as $101.13 and the price is now consolidating losses. There was a move above the 23.6% Fib retracement level of the downward move from the $110.78 swing high to $101.13 low.
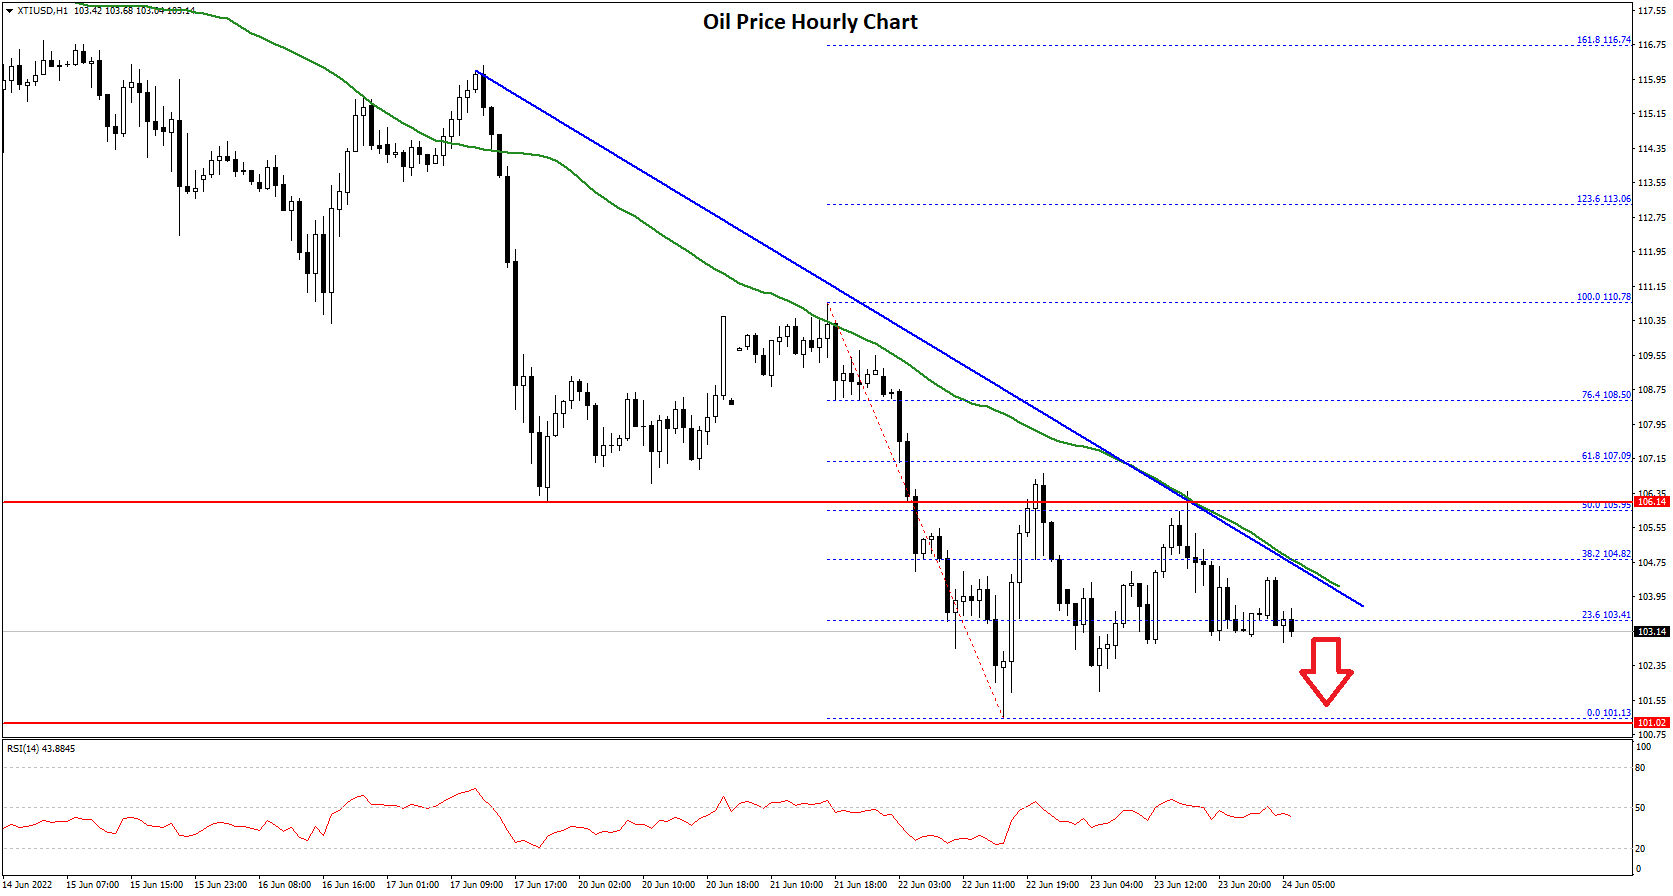
On the upside, the price is facing resistance near the $104.00 level. There is also a major bearish trend line forming with resistance near $104.00 on the hourly chart of XTI/USD.
The next key resistance is near the $106.20 level or the 50% Fib retracement level of the downward move from the $110.78 swing high to $101.13 low, above which the price might accelerate higher towards $108 or even $110.
On the downside, an immediate support is near the $102.20 level. The next major support is near the $101.20 level. If there is a downside break, the price might decline towards $100. Any more losses may perhaps open the doors for a move towards the $95.50 support zone in the coming sessions.
This forecast represents FXOpen Markets Limited opinion only, it should not be construed as an offer, invitation or recommendation in respect to FXOpen Markets Limited products and services or as financial advice.

Be the first to comment