

Gold talking points:
Gold prices just touched the $2,000/oz psychological level this morning and this comes just a couple of weeks after the yellow metal was peering into the abyss. As looked at in the month of March, there were a series of factors stacking up against the long side of Gold such as surging interest rates and a strong reversal earlier in the month, which left an evening star formation on the weekly chart and, eventually, a bear flag formation on the four-hour chart.
The latter formation even began to fill-in ahead of the Q1 close with price action breaching the 1900 level; but sellers couldn’t get very far as support built from 1888 and buyers have been pushing ever since. The long-term support zone spanning from 1900 up to the 1923.70 prior all-time-high has so far proven too rigid for bears to leave behind.
I had looked into the matter last Monday, remarking that price action wasn’t fitting that bearish narrative and, instead, had started to take on a bullish lean with breakout potential to 1976 and, if that was traded at, the $2,000 level.
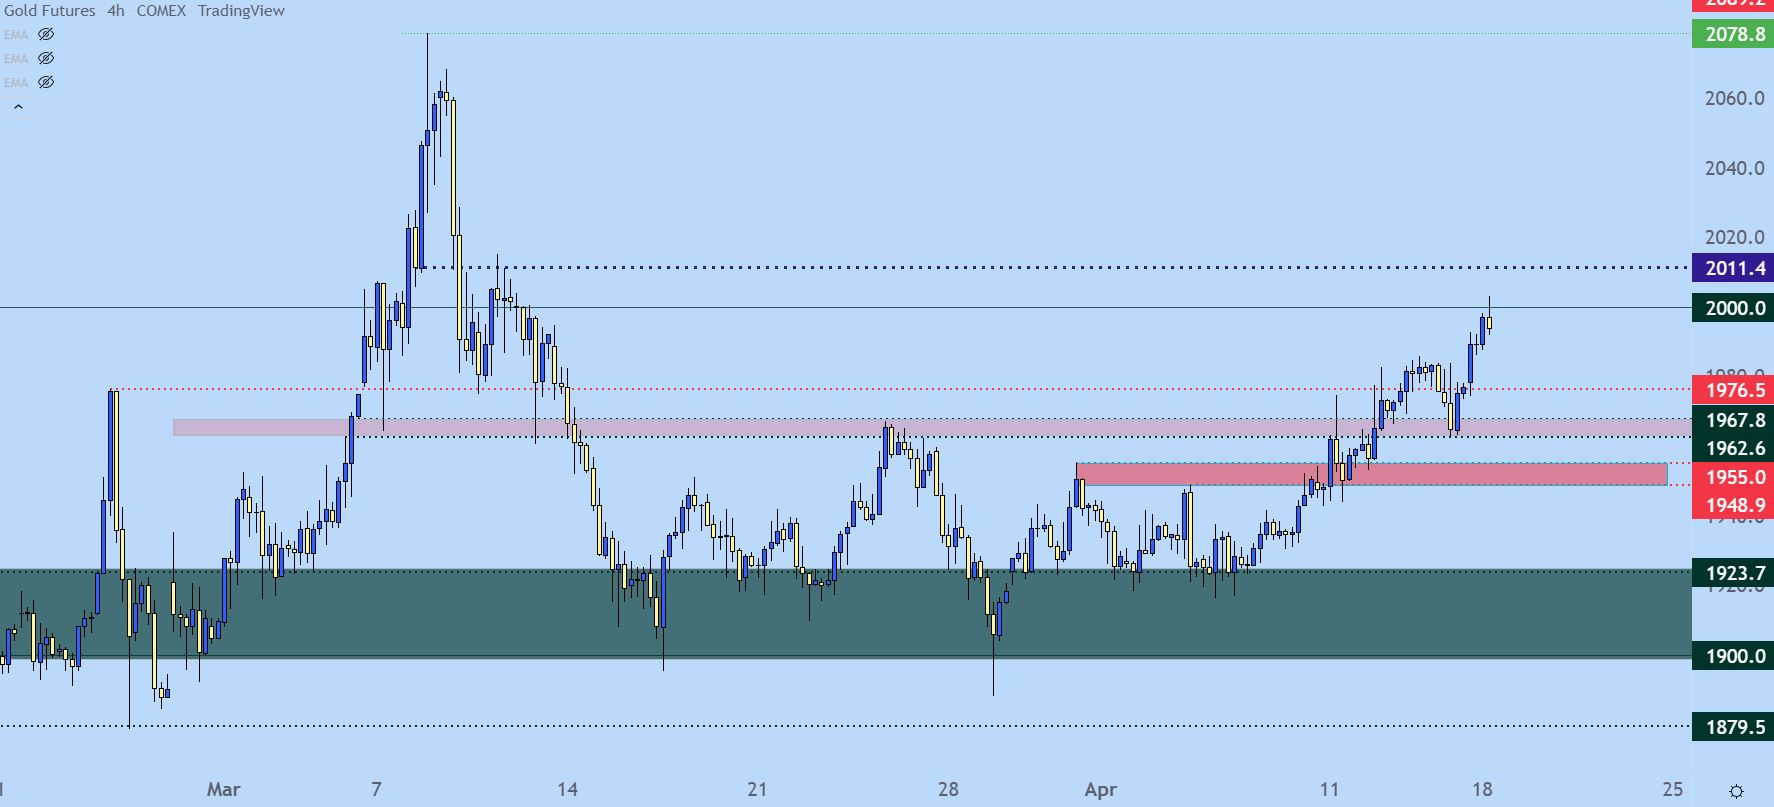
Gold Four-Hour Price Chart
Chart prepared by James Stanley; Gold on Tradingview
Gold Bullish Trend – Next Supports, Next Resistance
At this point we have the makings of a bullish trend on the Gold chart and this morning’s test at 2k has marked the most recent higher-high. The next big question is where might that next higher-low print, and given recent trend construction there’s some context to work with.
Last week saw prices pullback for a support test in a key zone of prior resistance, taken from the 1962-1967 levels. That resistance had held as Gold built in an ascending triangle formation and this was the level that was tested on Monday, broken on Tuesday and then re-tested for support on Thursday. That zone can remain of interest for bullish trend approaches, although there’s another area that’s more nearby that may function better as an ‘s1’ zone.
Last week’s breakout ran into resistance on Tuesday afternoon and that held through Wednesday. This formed from around 1982-1985 and this wasn’t broken through until this week, which means the move is still rather fresh.
If neither of the above two areas hold support in the event that prices pullback, there’s one more zone of interest and this was similarly horizontal resistance as a shorter-term ascending triangle had built, and this spans from around 1949-1955.
Gold Two Hour Price Chart
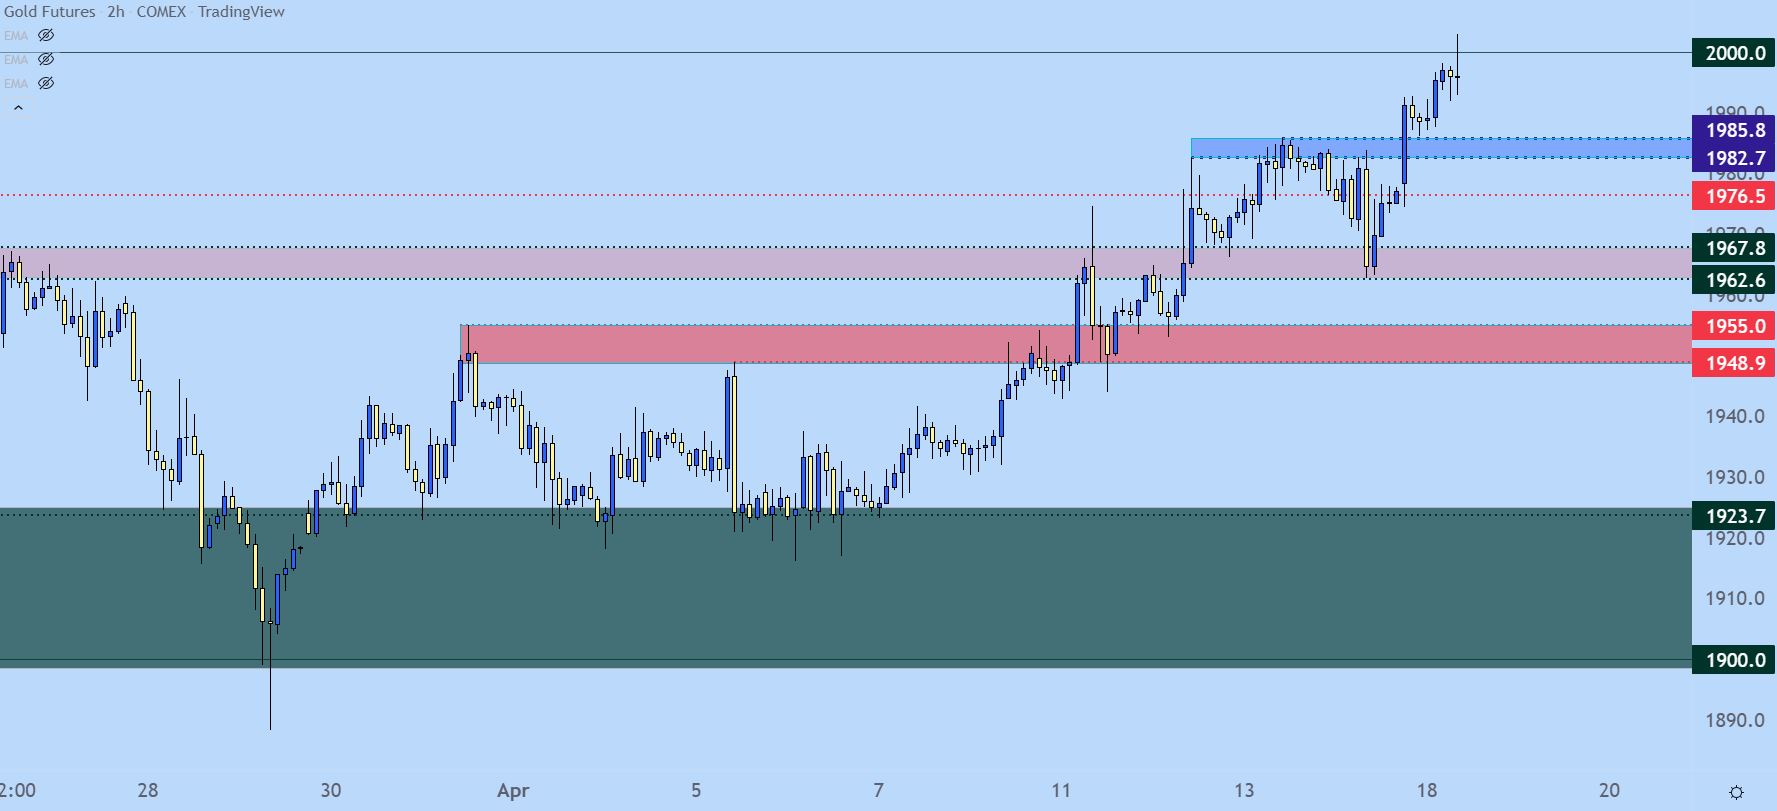
Chart prepared by James Stanley; Gold on Tradingview
— Written by James Stanley, Senior Strategist for DailyFX.com
Contact and follow James on Twitter: @JStanleyFX
Be the first to comment