

GOLD, CRUDE OIL PRICE OUTLOOK:
- A significant decline in the Turkish Lira spurred demand for safety, pulling the DXY US Dollar index to its one-and-half week high
- A stronger US Dollar exerted downward pressure on gold and crude oil prices
- Crude oil prices are vulnerable to further pullback as the demand outlook sours amid a third viral wave in Europe

Recommended by Margaret Yang, CFA
Get Your Free Gold Forecast
Gold prices traded modestly lower during Monday’s APAC morning session as the US Dollar strengthened. The sudden plunge in the Turkish Lira encouraged demand for safety, which pushed the haven-linked US Dollar, Japanese Yen and Swiss Franc higher against the other G10 peers. A rising US Dollar weighed on precious metal prices, with gold, silver and platinum falling -0.35%, -2.07% and -1.27% respectively.
On the other hand, the closely-eyed US 10-year Treasury yield retraced 3bps to 1.686% from last Friday’s close of 1.716%. As a result, the US real yield, represented by 10-year Treasury inflation-indexed security, has fallen to -0.62% from a 9-month high of -0.59%. Although a temporary pullback in real yields may serve to alleviate pressure on gold and other precious metals, the road ahead may be bumpy as yields look set to continue their upward trajectory following last week’s FOMC meeting.
Fed Chair Jerome Powell reiterated his dovish stance and patience towards a transitory rise in inflation, but he showed reluctance to address rising longer-term borrowing costs. The central bank also decided to let the exemption on capital rules to expire at the end of March, potentially leading banks to unwind some of their Treasury holdings. This may point to a further rise in yields and thus may undermine bullion prices. Looking ahead, Powell will give two testimony speeches this week, which will be closely eyed for his rhetoric on inflation and yields.
The DXY US Dollar index, which tends to exhibit a negative relationship with gold prices, appears to be underpinned by weakness in the Euro as a third viral wave hits Europe amid slowdown in vaccine rollout in the region. Commodity-linked Australian, Canadian Dollar and the Norwegian Krone were weighed by falling crude oil prices recently, pointing to further strength in the Greenback. Against this backdrop, gold may struggle to find its way higher.
Gold Prices vs. DXY US Dollar Index

Source: Bloomberg, DailyFX
Crude oil prices kicked off the week in a sour mood, as price struggled to hold up last Friday’s gains. A stronger US Dollar and energy demand concerns surrounding a new wave of lockdowns in Europe may continue to weigh on crude prices. WTI suffered a large 6% decline last week and dove below its 20-day SMA line for the first time since November, signaling a near-term trend reversal. The OPEC meeting on 1st April may provide a clearer direction as the oil cartel sets a forward guidance for its output plan into summer.
The EIA crude oil inventory report set to be released on March 24th will also be closely watched by oil traders after four consecutive weeks of stockpile build (chart below). Although extreme weather conditions in February have resulted in a temporary disruption in refinery activity, operations have been restored rapidly. According to EIA’s summary of weekly petroleum data, US refiners operated at 76.1% of their capacity during the week ending March 12th, compared to 69% a week ago.
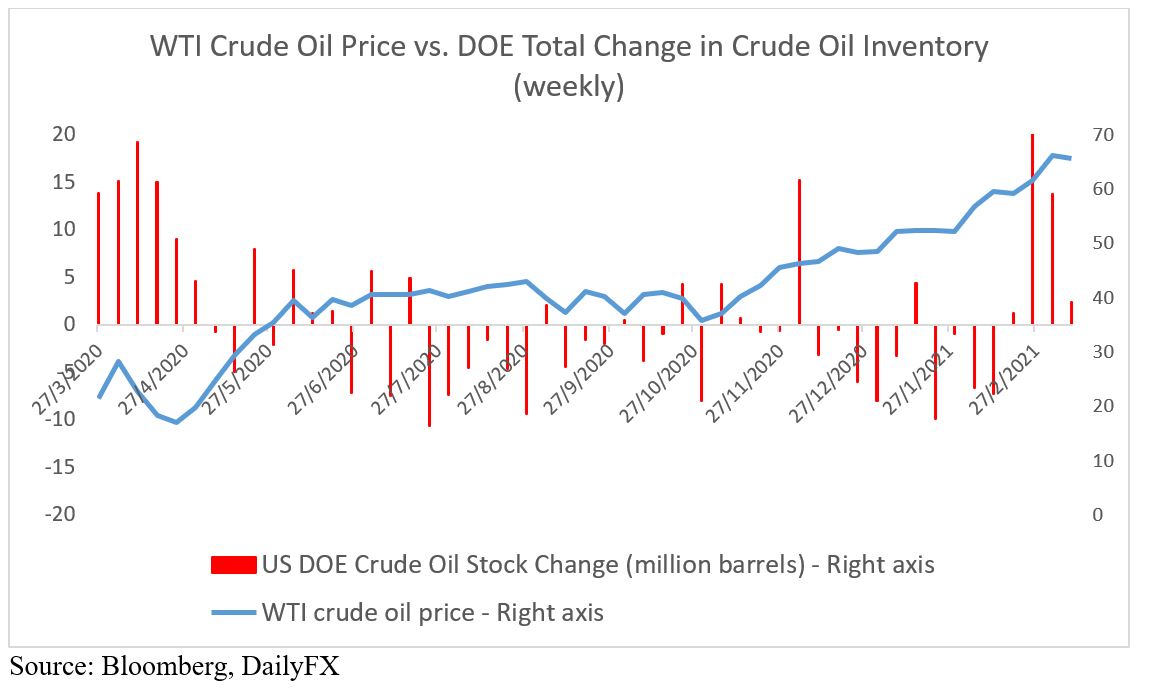
Source: Bloomberg, DailyFX
Gold Price Technical Analysis
Gold prices have likely reversed higher into a minor “Ascending Channel” as highlighted in the chart below, signaling that near-term trend may have turned bullish. An immediate resistance level can be found at US$ 1,743 – the 23.6% Fibonacci retracement. Breaking above this level would likely intensify near-term buying pressure and open the door for further upside potential with an eye on the 50-day SMA line. A failed attempt, however, may lead to a pullback towards the 20-day SMA line.
The MACD indicator is trending up higher after the formation of a bullish crossover, underpinning upward momentum.
Gold Price – Daily Chart

| Change in | Longs | Shorts | OI |
| Daily | 1% | 5% | 1% |
| Weekly | -3% | 9% | -1% |
Crude Oil Price Technical Analysis
Crude oil prices failed to breach the 200% Fibonacci extension level (66.50) and has since entered a technical correction. Prices dove below its 20-day SMA line for the first time in four months, signaling a potential trend reversal. An immediate support level can be found at the 50-day SMA line (58.65) whereas an immediate resistance can be seen at the 161.8% Fibonacci extension (62.19). The MACD indicator formed a bearish crossover and plunged sharply, suggesting that bearish momentum is dominating.
Crude Oil Price – Daily Chart
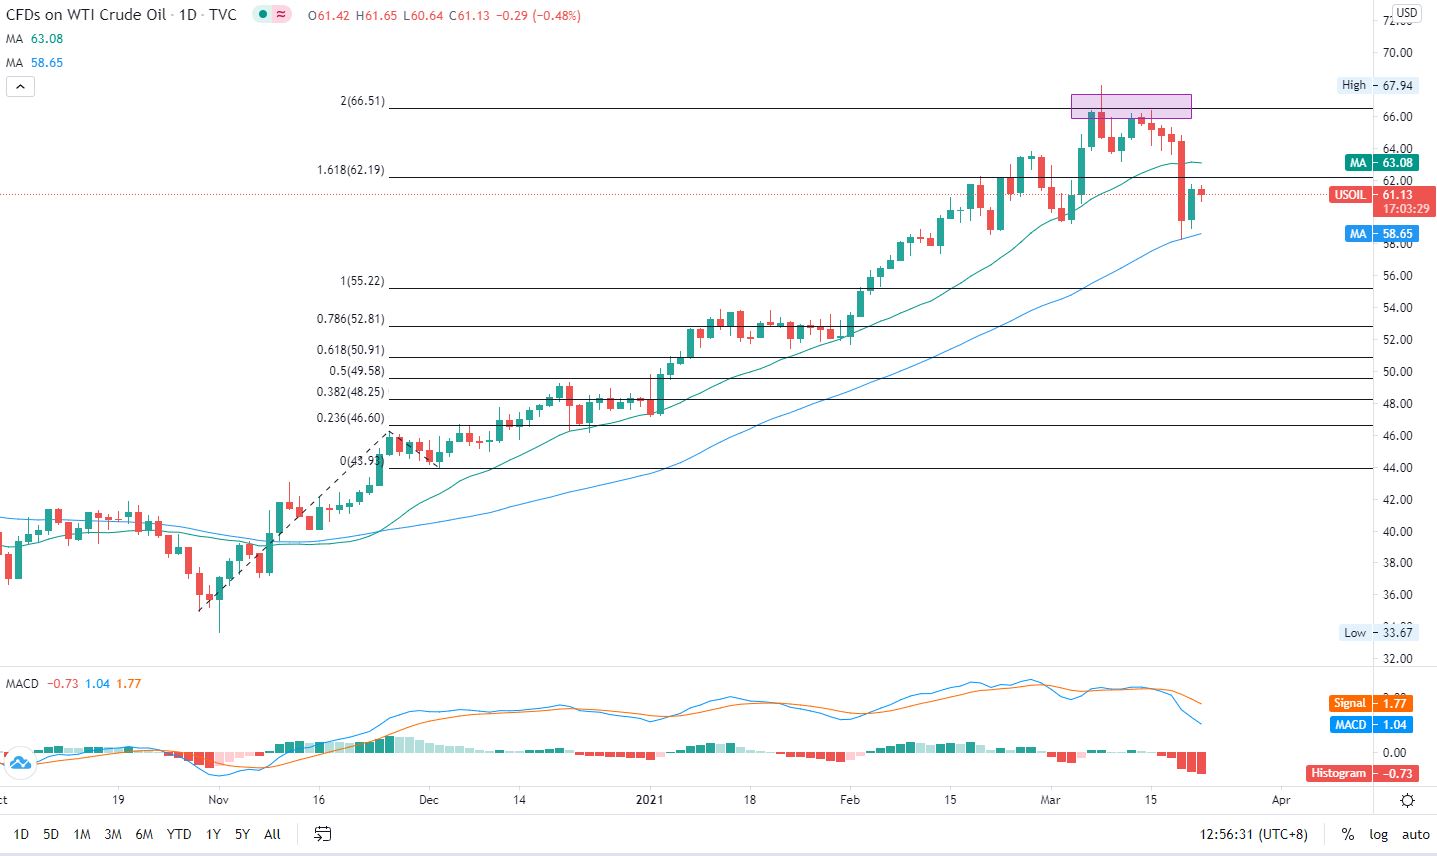
Chart by TradingView
{{GUIDE|BUILDING_CONFIDENCE_IN_TRADING }}
— Written by Margaret Yang, Strategist for DailyFX.com
To contact Margaret, use the Comments section below or @margaretyjy on Twitter
Be the first to comment