

chonticha wat/iStock via Getty Images
The algorithmic portfolio system, or APS, follows trends. It ignores fundamental supply and demand analysis, the news, and all of the noise that surrounds markets across all asset classes. The APS holds ten highly liquid market products, including optionable stocks and ETFs. The SPDR Gold Shares ETF product (GLD) is one of the ten APS products where trends determining the path of least resistance prices are the only criteria for long or short positions. The APS is always long or short the ten assets, so it does not miss a trend. APS is often long at tops and short at bottoms as it seeks to take a substantial percentage from market trends. Market prices tend to rise and fall to illogical, irrational, and unreasonable levels, and the APS looks to capitalize on those price moves. The system never changes from short to long, or vice versa intraday as the system only operates on closing prices.
Gold’s price rose to an all-time high in August 2020 when the nearby COMEX futures contract reached $2063 per ounce. Until recently, gold was digesting the move, corrected lower, and consolidated as the price range narrowed. In February, the price broke out to the upside. The APS was long the GLD ETF on February 25.
Gold breaks out of a wedge formation to the upside
After the August 2020 high, gold corrected, falling to a low of $1673.30 per ounce in March 2021, an 18.9% decline from the $2063 high.
Weekly COMEX Gold Futures (CQG)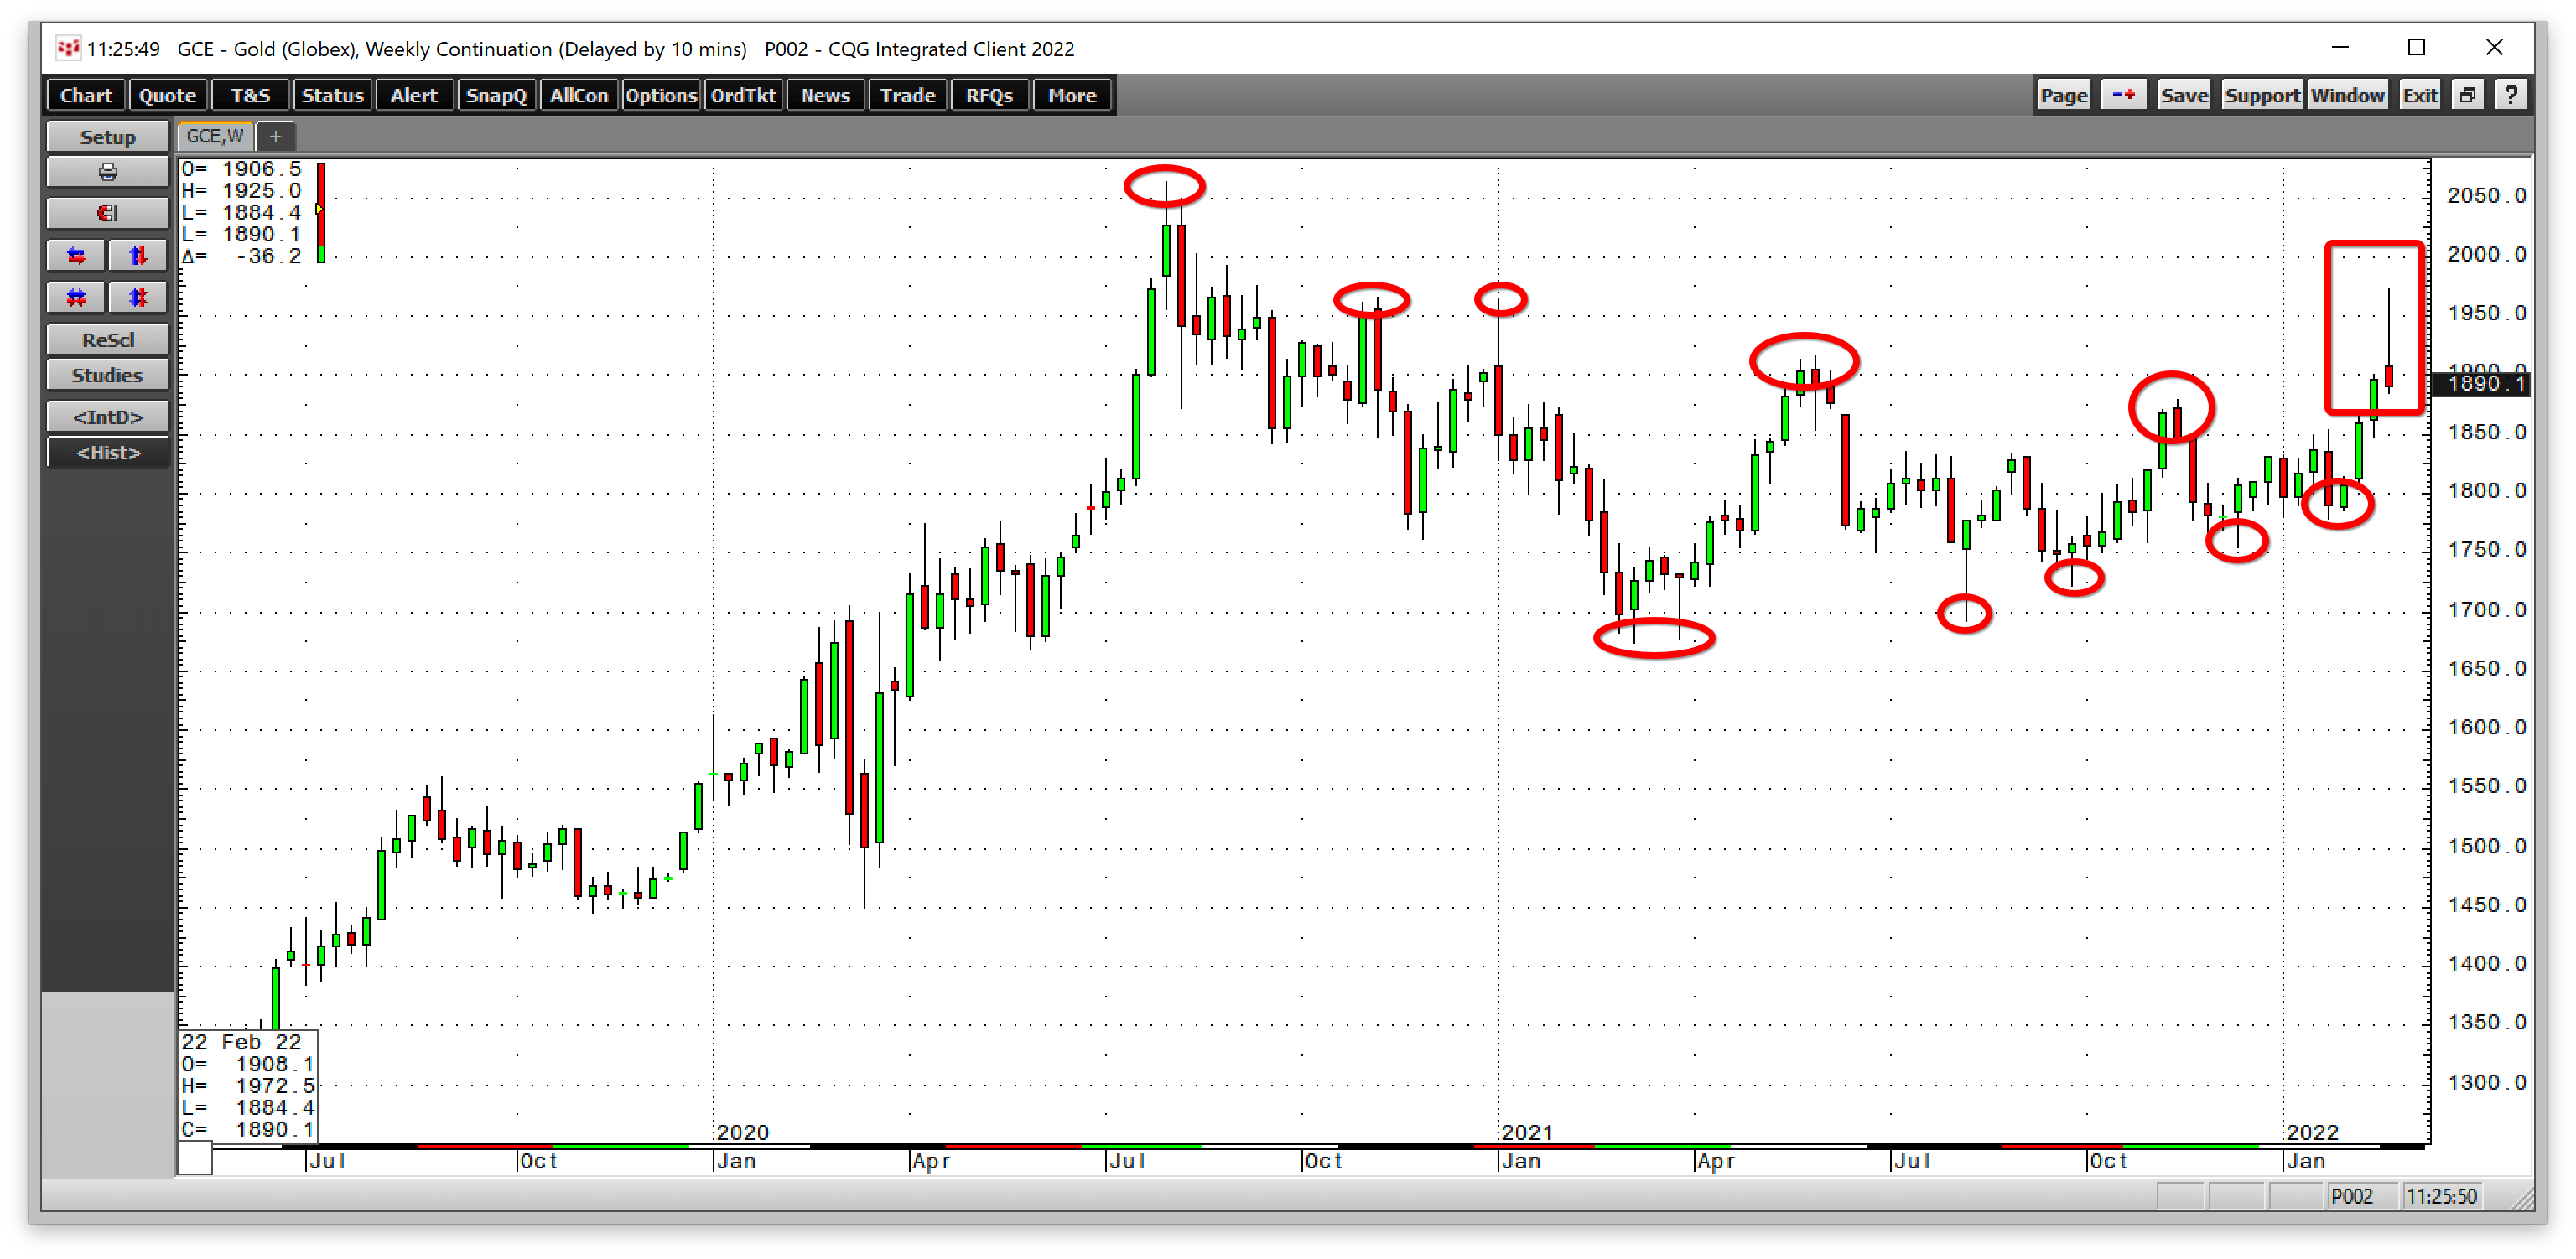
The weekly chart highlights that while gold continued to make lower highs through early February 2022, the price made higher lows starting in March 2021, creating a wedge formation. As the price ranges narrowed, the odds of a break higher or lower rose. During the week of February 14, gold broke out to the upside, eclipsing the first resistance level at the mid-November 2021 $1879.50 high. On February 24, the price rose to the highest level since September 2020, when it peaked at $1972.50 on the continuous futures contract. As the odds favored, the breakout from the wedge formation was to the upside.
Inflation is bullish for gold
Since the start of the global pandemic, unprecedented central bank liquidity and government stimulus ignited the worst inflationary pressures in over four decades. The January US consumer price index rose to 7.5%, with core CPI excluding food and energy moving 6% higher. The January producer price index moved 9.7% higher. Commodity prices have been rising as inflation erodes fiat currency’s purchasing power.
Gold sat around the $1800 pivot point as inflation rose, as the price level became a magnet. Each time gold rose above, it failed, and attempts at a deeper correction gave way to a return to $1800 until February 2022. The highest inflation level in over forty years may not have propelled gold to higher highs because of the prospects of a more hawkish approach to monetary policy. Rising US interest rates increase the cost of carrying gold and support a rising dollar, another historically bearish factor for the precious metal. Meanwhile, geopolitical events could make any monetary policy tightening toothless as they support even higher inflation over the coming months.
President Putin lit a golden bullish fuse
On February 24, 2022, Russian troops attacked Ukraine. President Putin believes Ukraine is western Russia while the US and Europe support Ukraine’s sovereignty as an independent Eastern European country. Russia demanded guarantees that Ukraine would never become a NATO member, and the US and European countries refused to comply. President Putin ordered troops into Ukraine, pushing gold to a high of $1972.50 on February 24 before falling back to around the $1900 level on the active month COMEX futures contract. We could see $1900 per ounce develop into a new pivot point for the precious metal over the coming weeks.
Meanwhile, battling inflation became a lot more challenging on February 24, 2022. Russia is the world’s leading wheat exporter, with Russia and Ukraine supplying approximately one-third of the world’s wheat. War in Ukraine is likely to impact supplies as Ukrainian acreage could become a battlefield. Moreover, exports from Black Sea Ports that border Russia and Ukraine could see dramatic logistical problems in the center of a war zone.
Russia is an influential non-member of the international oil cartel, with the production policy established in Riyadh, Saudi Arabia, and Moscow. Europe depends on Russian oil and gas supplies for energy. While the US and Europe level sanctions on Russia after the Ukrainian invasion, Europe balked at cutting Russia out of the SWIFT payments system and leveling sanctions directly on the Russian leader.
Russia also supplies the world with aluminum, nickel, fertilizers, a host of agricultural products, iron ore, platinum group metals, and other raw materials. The conflict and the potential for tit-for-tat sanctions and embargos increase the odds that inflation continues to rage. Crude oil moved to over $100 per barrel on the nearby Brent and WTI futures contracts on February 24. Nickel rose to over $25,000 per ton, and aluminum to over $3,300 per ton. Palladium peaked at over $2,700 per ounce on February 24, and platinum probed above the $1,100 level. While prices came down from the February 24 high, the events in Ukraine only exacerbate inflationary pressures, making monetary policy secondary.
President Putin is playing a geopolitical chess game with the US and Europe. Meanwhile, China is watching the events as it has stated reunification with Taiwan is on the horizon. Historically, gold thrives in an inflationary environment, and geopolitical tensions also support the yellow metal’s price.
A new all-time high may be on the horizon
After breaking out of the wedge formation at the $1800 level, gold moved within $100 of the all-time high on February 24. The net target is a challenge of the August 2020 all-time high.
Monthly Chart- COMEX Gold Futures (CQG)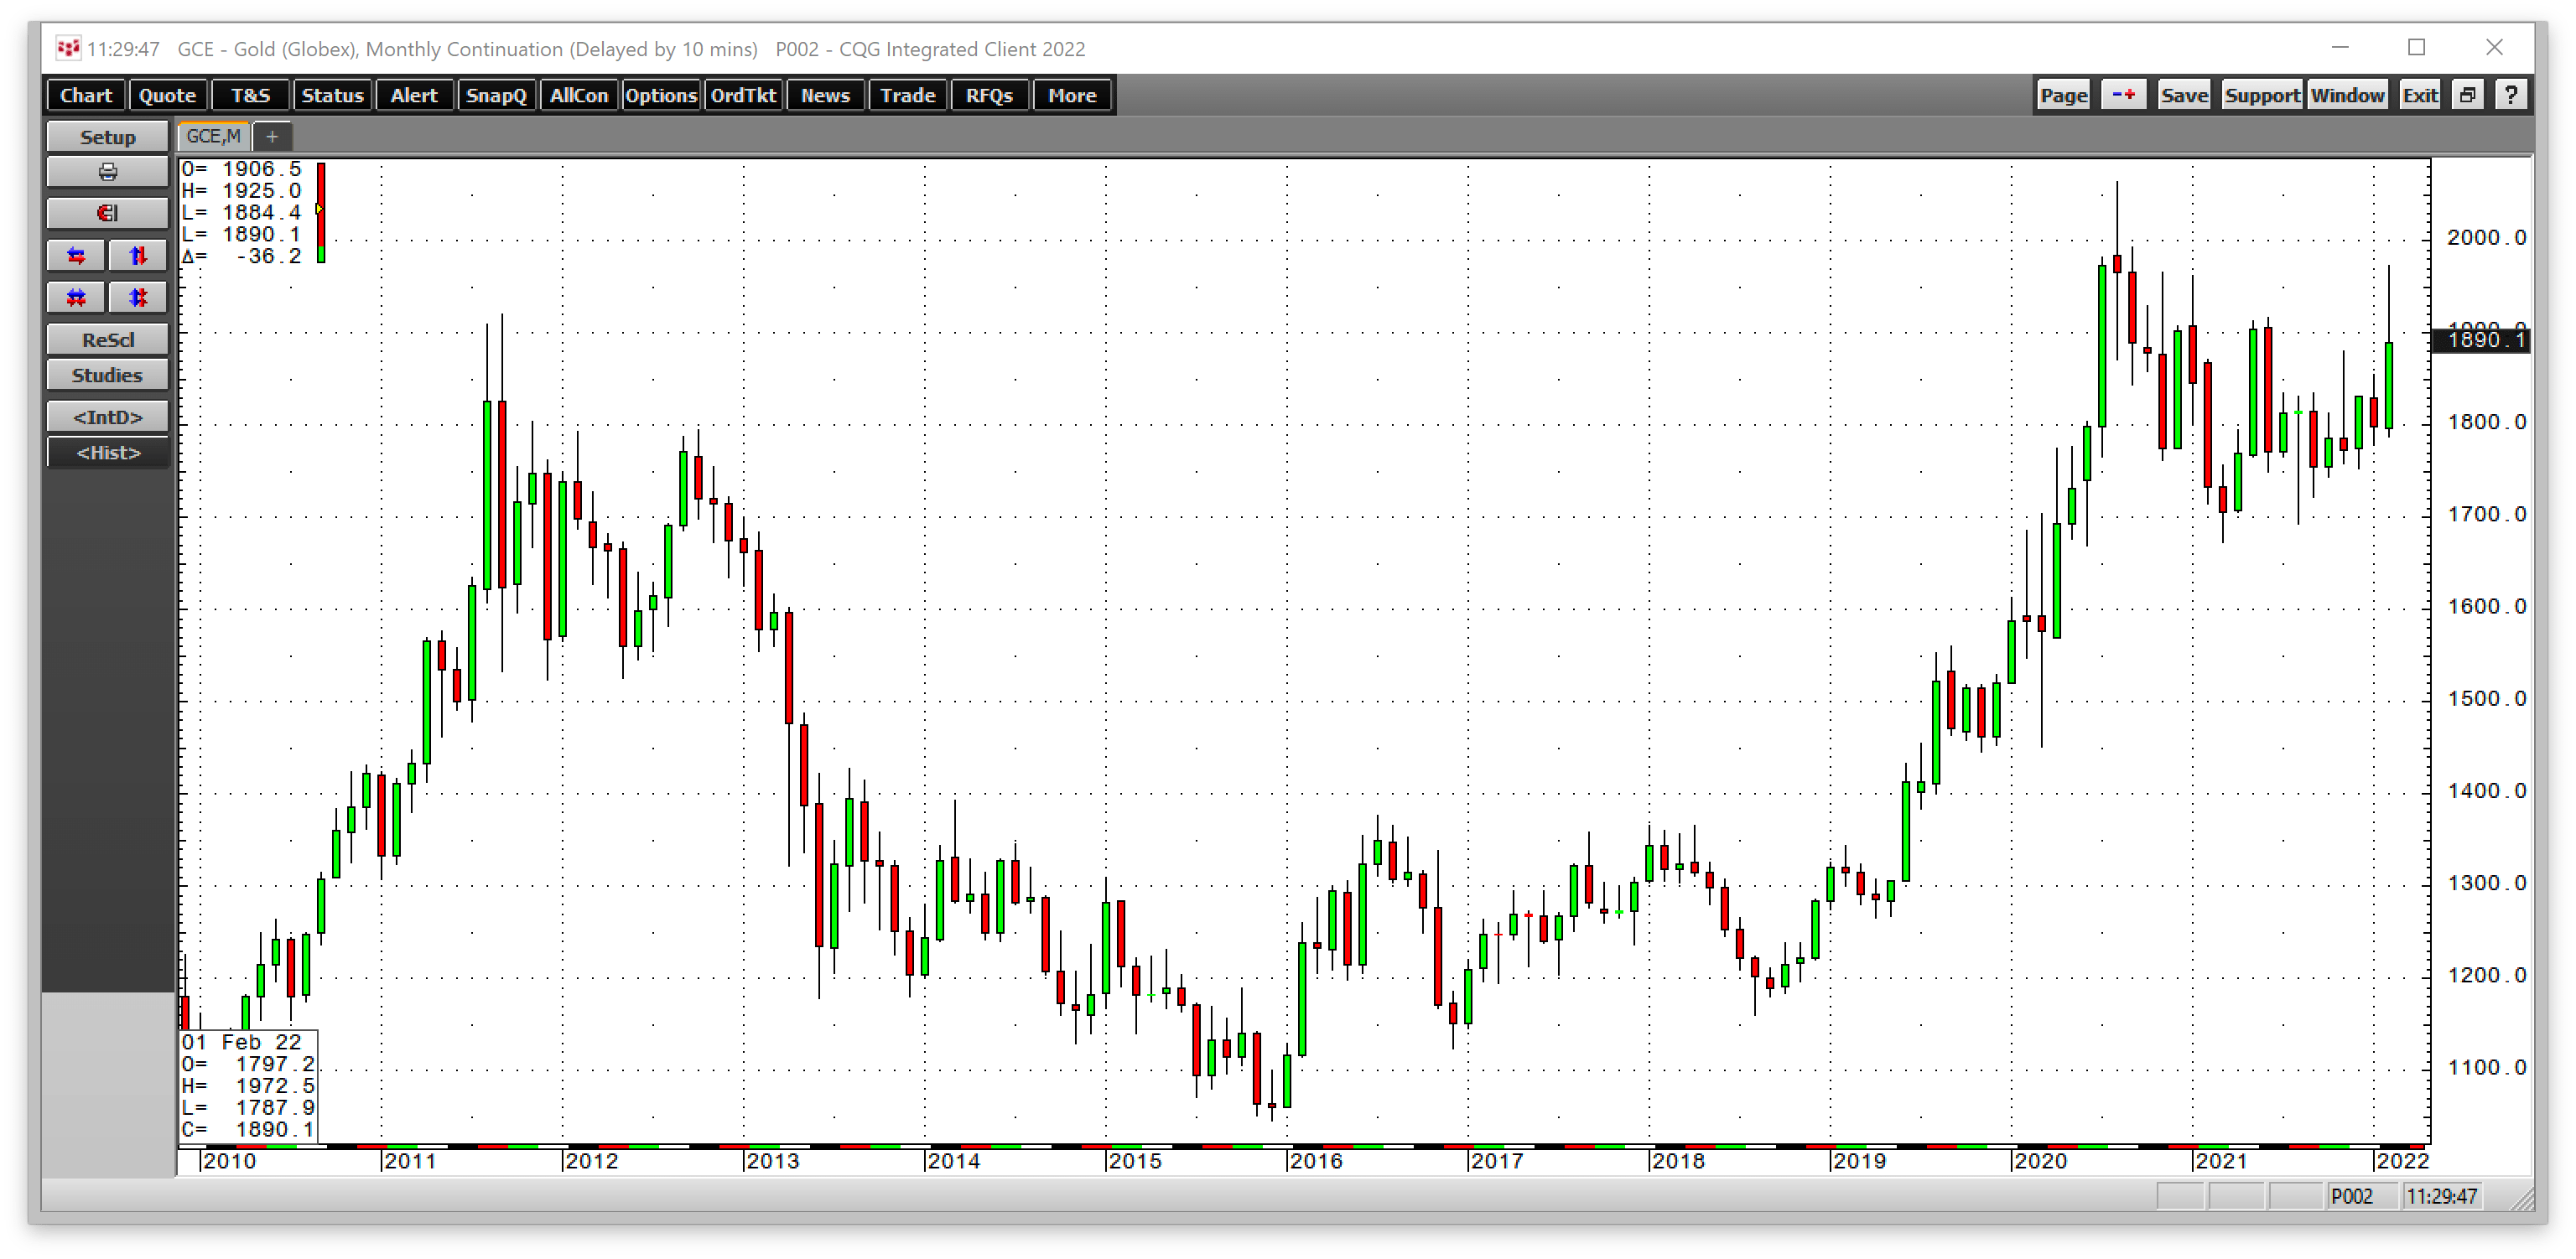
The monthly chart illustrates the explosive move in gold in February 2022. With inflation and geopolitical turmoil as the wind in its sails, it may only be a matter of time before gold rises above the $2063 record peak.
Supply and demand fundamentals are secondary to the market’s sentiment. Investment demand determines the path of least resistance of the metal with a long history as a means of exchange or hard currency. The technical break will likely to cause a flood of buying in the gold market.
Daily Chart of COMEX Gold Futures- Rising Open Interest (CQG)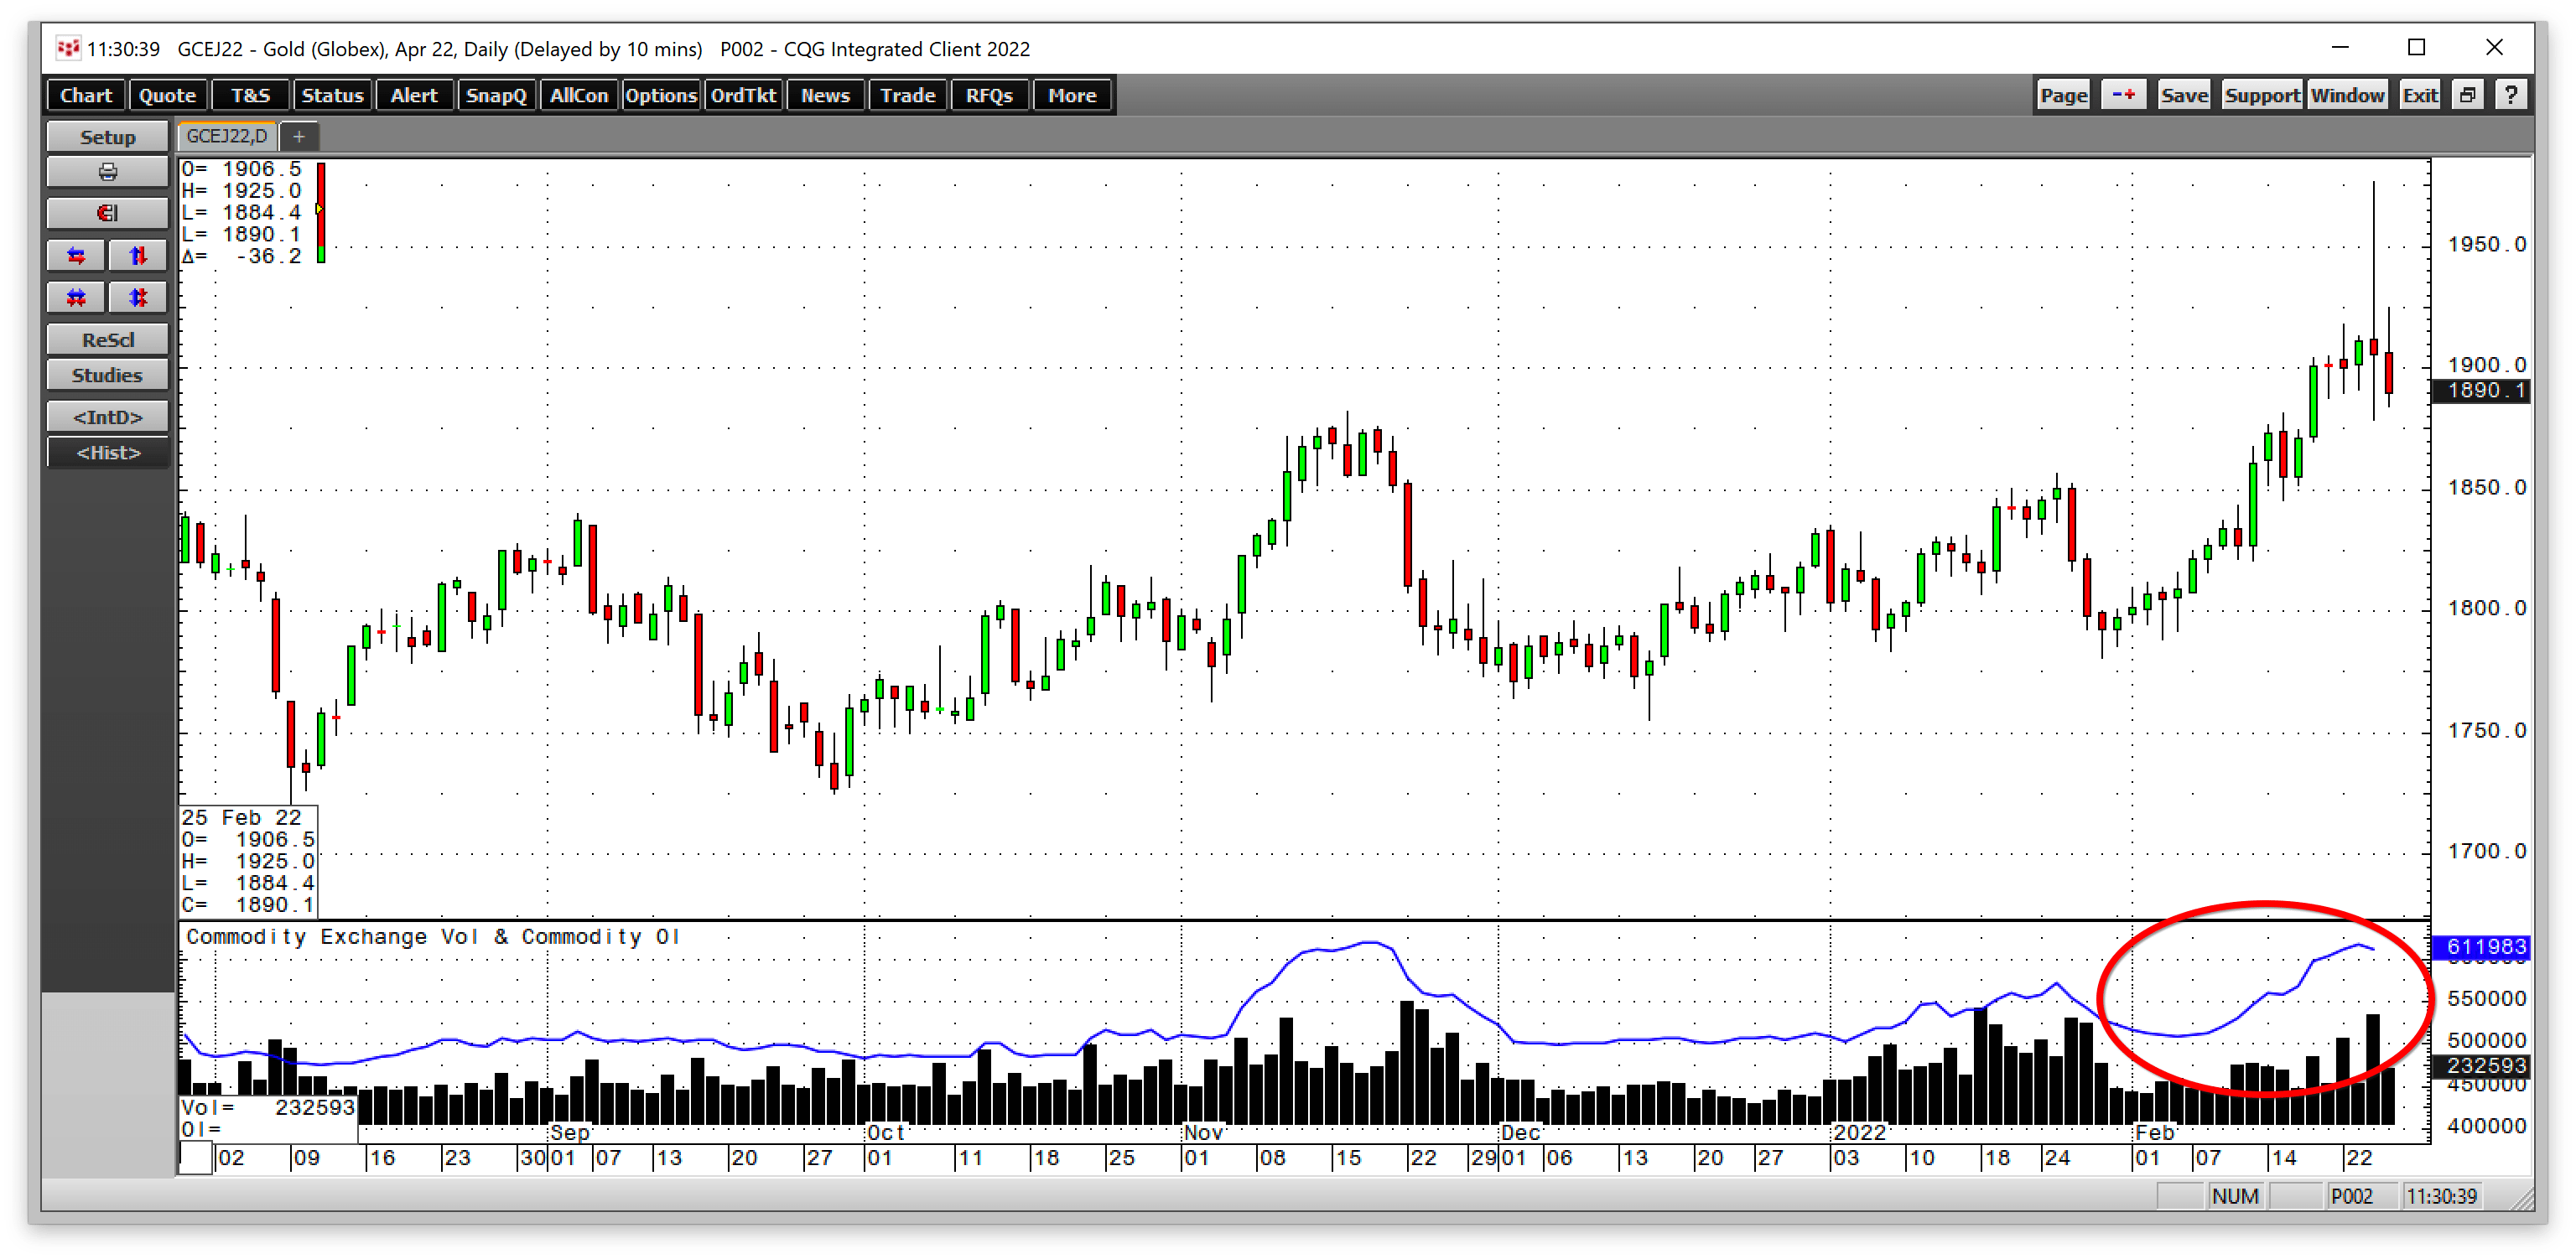
The daily chart shows the total number of open long and short positions in the COMEX gold futures market rose from 508,423 contracts on February 4 when April futures were straddling $1800 per ounce. On February 24, the April contract settled at $1926.30 per ounce. Open interest was at the 611,983-contract level, 20.4% higher. Increasing open interest when the price of a futures contract rises tends to be a technical validation of a bullish trend.
The APS is long GLD – The leading gold ETF product
It is virtually impossible to ignore the news as the Russian invasion of Ukraine has started the first major European war since World War II. However, the news cycle can trigger emotional impulses that cause disastrous trading and investing mistakes and miscalculations. Market prices move higher when buyers are more aggressive and lower when sellers overwhelm buyers. The Algorithmic Portfolio System or APS follows trends, and APS is always long or short its ten highly liquid components.
SPDR Gold Shares ETF product (GLD) is the most liquid gold EFT product with over $63 billion in assets under management. GLD trades an average of over 12.8 million shares each day and charges a 0.40% management fee.
As of February 25, 2022, the APS was long the GLD ETF, which follows the gold price. When the trend bends, and our algorithm turns negative, we will close our long and go short the GLD.
Following trends via an algorithmic system requires strict adherence to rules. We do not attempt to pick bottoms or tops in any markets and are typically short at bottoms and long at tops. However, taking the most significant percentage out of trends requires removing emotional impulses from trading and investing. We ignore fundamentals, news, and all of the daily noise. Our signals are never intraday; they can only change at the end of a session. Our system does not get caught up in the daily frenetic trading activity.
The price of any asset is always the correct price because it is the level where buyers and sellers meet in a transparent environment, the marketplace. Crowd behavior that determines trends can be the optimal market approach across all asset classes. As of February 25, the crowd’s wisdom points to a bullish trend in the GLD ETF product.
Be the first to comment