Tempura/E+ via Getty Images
The Cambria Global Momentum ETF (BATS:GMOM) is an actively managed fund that incorporates a quantitative trend-following strategy. The idea here is based on academic research going back decades suggesting winning assets from previous periods, on average, continue to outperform going forward. GMOM takes a cross-asset class approach by incorporating ETFs covering U.S. and foreign equities, fixed income, currencies, and commodities exhibiting “momentum”. Favorably, GMOM has been able to deliver a positive return this year thus far in contrast to the broader market that has been in a deep selloff.
The strategy’s tilt toward energy and natural resources has contributed to its outperformance highlighting the fund’s appeal. That being said, the question becomes how the fund will perform in the next stage of the market cycle. In particular, some of the fund’s current top holdings have corrected lower from recent highs and there is some ambiguity in the rebalancing process. GMOM has had a good year and can work as a portfolio diversifier but there are reasons to expect higher volatility going forward.
What is the GMOM ETF?
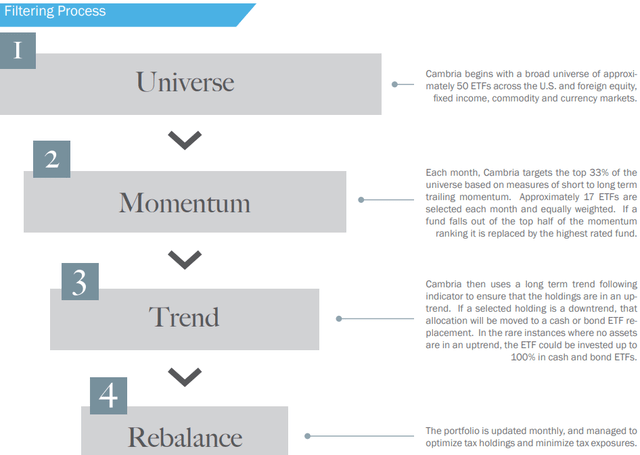
According to Cambria Global, GMOM selects from a universe of approximately 50 exchange-traded funds that each capture the high-level trends and themes from key market segments. From there, the fund invests in the top third best performing funds based on measures of short and long-term trailing momentum through an equal-weighted methodology.
What’s interesting here with the actively-managed approach is that the strategy has some flexibility to make regular adjustments. While there is a scheduled monthly rebalancing that replaces an underlying holding that falls out of the top half of the momentum ranking, GMOM can also move out of a position and into cash as a risk management tool.
Management explains that in such a scenario where no assets are in an uptrend, GMOM could theoretically be invested up to 100% in cash and bond ETF. Going back to a previous point, it’s unclear exactly what levels of a correction warrant the loss of the momentum classification.
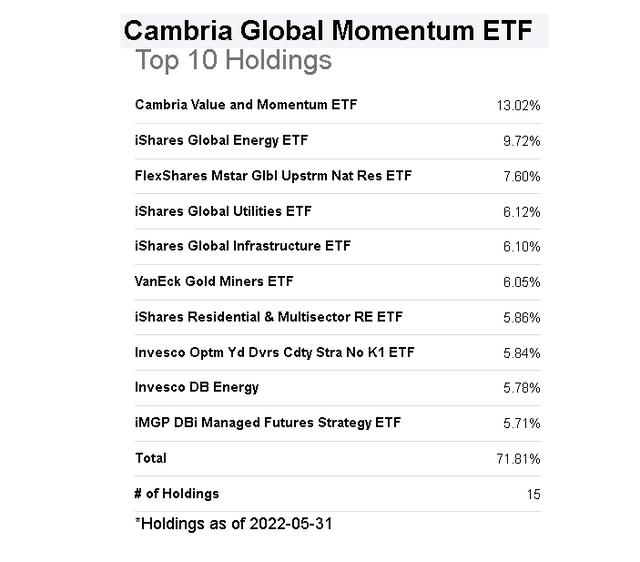
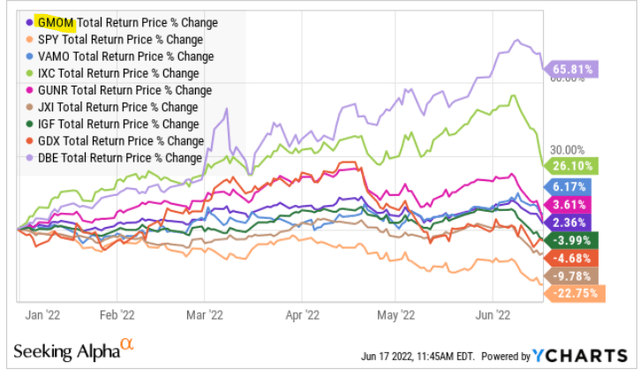
Taking a look at the current portfolio of 15 holdings, GMOM uses its “sister fund”, the Cambria Value and Momentum ETF (VAMO), which is based on just U.S. stocks, as its top holding with a 13% weighting to represent exposure to the U.S. equity market. Notably, VAMO has also been a winner this year, up about 5% which considers its underlying exposure to the outperforming sectors.
Down the line, energy and commodity-specific ETFs are well represented including the iShares Global Energy ETF (IXC) at 10% of the fund, followed by the FlexShares Morningstar Global Upstream Natural Resources Index Fund (GUNR) at 8%. There is also the Invesco DB Energy ETF (DBE) which has exposure to a basket of energy futures. Other top-10 holdings include the iShares Global Utilities ETF (JXI), and iShares Global Infrastructure ETF (IGF) which together have been a relatively defensive segment in 2022.
GMOM Performance
Upwards of 60% of GMOM is positioned in funds related to natural resources which makes sense considering this is the area of the market that has benefited from trending high-level macro the themes like record inflation, supply chain disruptions, and geopolitical uncertainties.
Compared to a 23% decline in the S&P 500 (SPY) year to date, GMOM is clinging to a 2% return benefiting from some exceptional momentum winners like the DBE ETF up 66% tracking the price of oil and gas futures. The iShares Global Energy ETF has also contributed to the outperformance with a 26% gain although we note the broader energy sector has faced higher volatility in recent weeks, well off its highs.
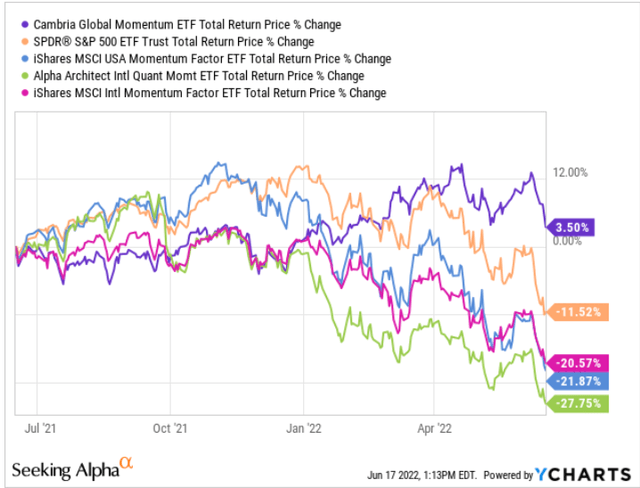
The other strong point here is that GMOM has been able to outperform some other comparable “momentum” strategy ETFs. With a 3.5% return over the past year, GMOM is beating out the iShares MSCI USA Momentum Factor ETF (MTUM) down by 12%, the iShares MSCI International Momentum Factor ETF (IMTM) down 21% focusing on foreign stocks, and the Alpha Architect International Quantitative Momentum ETF (IMOM) down 28% over the period.
The spreads here reflect differences in the underlying quantitative strategy with GMOM getting an edge with its actively managed approach. Note that MTUM, IMTM, and IMOM only invest across equities while GMOM is unique with a cross-asset approach through ETF holdings.
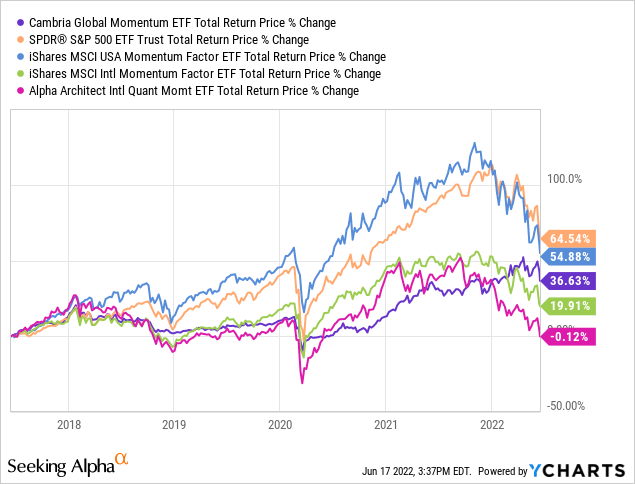
So what we have here is that while 2022 has been good to GMOM, it doesn’t tell the whole story. Over the past 5-years, the fund has returned a cumulative 37% on a total return basis which is above the 20% gain from IMTM, but not alpha-generating compared to the 65% return in the S&P 500 or even the 55% return from MTUM, the largest ETF in this category with $10 billion in AUM.
Cambria Global’s marketing material with data through the last quarter end confirms that it has lagged its benchmark which is the “S&P Balanced Equity & Bond Index” in terms of annualized returns since inception.
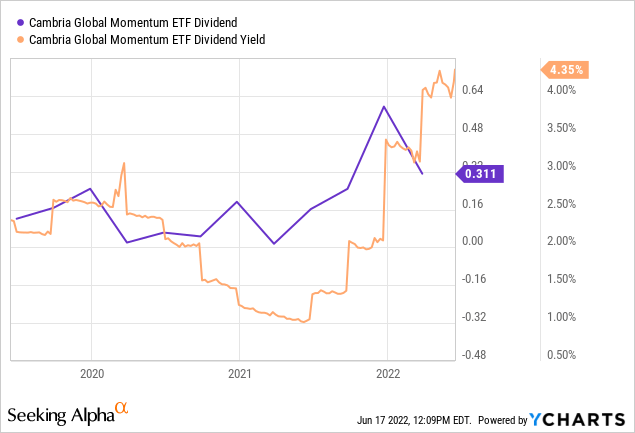
It’s worth mentioning GMOM distributes a quarterly dividend based on the underlying income. The current yield of 4.35% has climbed from a low near 1% in 2021. This shift reflects the positions in the energy and materials sectors that typically distribute high payouts in contrast to the momentum winners of 2021 when the fund was more concentrated in growth-type sectors. Recognizing the high turnover of the strategy, it’s hard to estimate what the “forward” yield on the fund is but shareholders can expect distributions to continue.
GMOM Price Forecast
The best-case scenario for GMOM right now based on its current portfolio holdings is that energy and materials sector stocks continue to rally higher. This is a scenario that has a lot going for it considering the headlines of tight oil and gas supplies still reeling from pandemic-era production disruptions on top of the Russia-Ukraine war developments of this year. On the other hand, we highlight what has been some new volatility with the energy sector selling off in recent weeks based on a concern that slower global economic growth could end up pressuring prices on the demand side.
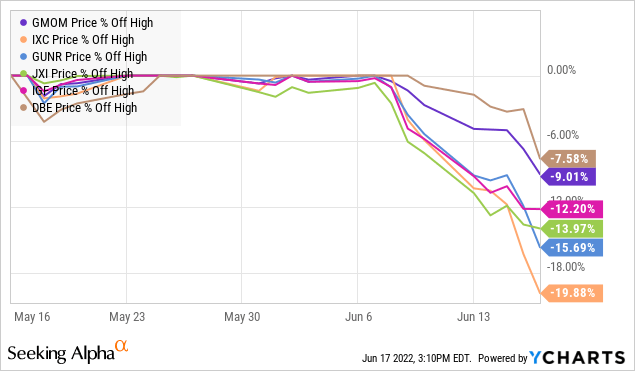
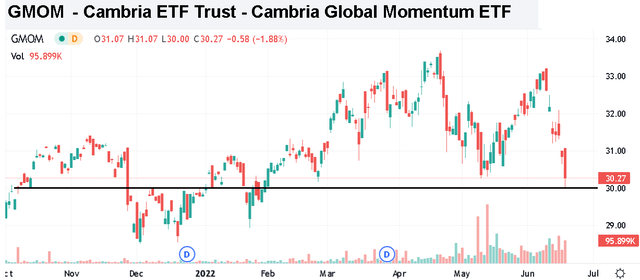
From a high on June 9th, GMOM is down approximately 9% over the period dragged lower by a 20% drop in the iShares Global Energy ETF and a similar decline in other top fund holdings. We bring this up because it’s unclear how the actively-managed strategy is dealing with these positions based on its flexibility to move into cash. Again, the fund has a defined monthly rebalancing process but there is a possibility that the proprietary methodology no longer considers some of these funds as “momentum” based on these latest moves.
The result is that investors are left in the dark regarding how GMOM will look like next week or this time next month. This point highlights a broader challenge with the momentum approach in that it works best in a trending market. Extreme volatility seen in all asset classes over the last few weeks isn’t conducive to positive returns.
We get into a scenario where GMOM moves more into cash and could be left flat-footed as other areas of the market turn higher. At some point, lagging sectors like growth and technology names will find a bottom and reverse higher. We’re not saying this is going to happen today or next week, but eventually, GMOM will find itself on the wrong side of the trade and need to play catchup.
Verdict
We rate GMOM as a hold reflecting an otherwise neutral view. It crossed our radar based on the positive year-to-date return but we’ll skip this one at the current level. Taking a deep dive, it’s a mixed bag when looking at the long-term returns and performance metrics. Any investor holding the fund over the past year will have enjoyed at least some preservation of capital compared to a broad stock market index. Still, the strategy doesn’t appear to generate sustained excess returns.



Be the first to comment