

Tom Merton/OJO Images via Getty Images
This ETF review series aims at evaluating products regarding their strategies, portfolios and past performances. As holdings and weights change over time, updated reviews are posted when necessary.
SPFF strategy and portfolio
The SuperIncome Preferred ETF (NYSEARCA:SPFF) is a high yield fund paying monthly distributions. It has 50 holdings, a yield of 6.96% and a total expense ratio of 0.58%. It started investment operations on 07/16/2012, and tracks the S&P Enhanced Yield North American Preferred Stock Index.
According to Global X ETFs website, eligible securities are U.S. and Canada traded preferred stocks with at least US$ 250 million in total market capitalization and US$ 1 million in average daily volume. The top 25 highest yielding securities are included in the index. Current index constituents ranked within the top 75 remain in the index until the count reaches 50. The index uses a capped market cap weighting methodology. The maximum number of securities per issuer is 3 and the maximum weight per issuer is 5% on every semi-annual reconstitution.
The fund is heavy in financial companies, especially in the banking industry. The next table lists the top 10 holdings with their weights and issuers’ fundamental ratios. The portfolio is quite concentrated: these top 10 names represent about 33% of asset value (the fund doesn’t hold the tickers below, but preferred stocks issued by these companies).
|
Ticker |
Name |
Weight% |
Preferred |
EPS growth% TTM |
P/E TTM |
P/E fwd |
|
Becton, Dickinson & Co. |
5.18 |
BDX 6 06/01/23 |
-12.54 |
40.80 |
20.48 |
|
|
JPMorgan Chase & Co. |
5.04 |
JPM 6 PERP |
-25.07 |
11.11 |
11.41 |
|
|
Duke Energy Corp. |
3.65 |
DUK 5 3/4 PERP |
27.82 |
20.22 |
18.79 |
|
|
Bank of America Corp. |
3.16 |
BAC 6 PERP |
-5.69 |
10.47 |
10.40 |
|
|
ATH |
Athene Holding Ltd |
3.04 |
ATH 6.35 PERP |
N/A |
N/A |
N/A |
|
The Charles Schwab Corp. |
2.81 |
SCHW 5.95 PERP |
25.29 |
24.46 |
20.54 |
|
|
State Street Corp. |
2.81 |
STT 5.9 PERP |
3.82 |
10.54 |
10.40 |
|
|
The Goldman Sachs Group, Inc. |
2.65 |
GS 6 3/8 PERP |
-38.07 |
9.66 |
10.62 |
|
|
Citigroup, Inc. |
2.54 |
C 10.7847 10/30/40 |
-31.74 |
6.16 |
6.30 |
|
|
Annaly Capital Management, Inc. |
2.43 |
NLY 8.66714 PERP |
3.22 |
2.61 |
4.94 |
Performance
Since inception in 2012, SPFF with dividends reinvested has lagged the S&P 500 by 10.4 percentage points in annualized return, and a 60/40 portfolio by 5.8 percentage points. Risk metrics are mixed: volatility is low, but the maximum drawdown is deep. Anyway, the risk-adjusted performance (Sharpe ratio) is inferior to both benchmarks by a wide margin.
|
Total Return |
Annual Return |
Drawdown |
Sharpe ratio |
Volatility |
|
|
SPFF |
30.55% |
2.60% |
-40.19% |
0.27 |
8.20% |
|
SPY |
255.40% |
13.00% |
-32.05% |
0.86 |
14.30% |
|
60% SPY + 40% BND |
131.42% |
8.42% |
-21.80% |
0.85 |
9.25% |
The next chart compares the prices adjusted of dividends (total returns) of SPFF with four other preferred stocks ETFs (PFF, PGX, PSK, PFXF) since July 2012. SPFF is the worst performer of this group.
SPFF vs. Competitors since 2012 (Portfolio123)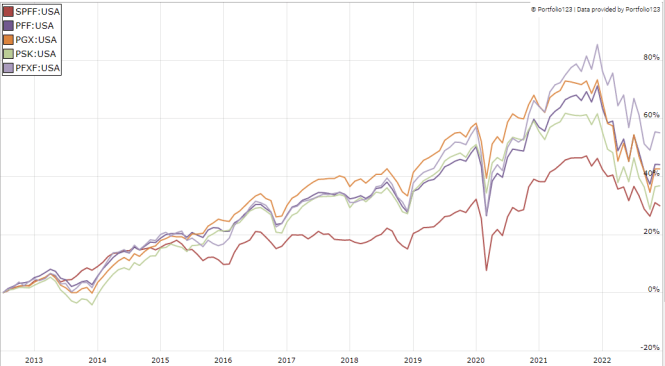
However, it has been the best one in the last 12 months:
SPFF vs. Competitors last 12 months (Portfolio123)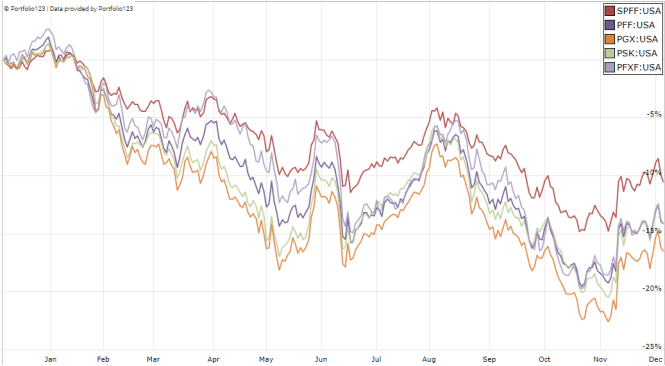
As reported in the previous table, the annualized return reinvesting all distributions since July 2012 is far below the distribution rate. This is a clue of capital decay. In fact, the share price (without dividend) has lost about 35% since inception:
SPFF share price (without dividends) (Trading View on Seeking Alpha)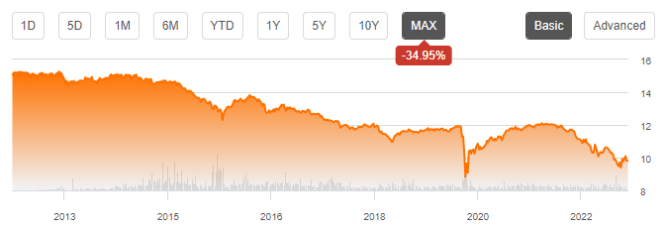
Capital decay also means income stream decay: the yield cannot go up continuously to offset the loss in asset value. The average monthly distribution went down from $0.0895 in 2013 to $0.0565 in 2021. This is a loss in income stream of about 37%, without taking inflation into account.
SPFF may be an interesting instrument for swing trading or tactical allocation, but I can’t imagine it in a sustainable retirement plan. This issue is not specific to SPFF: securities with yields above 6% suffer from capital decay, on average (there are rare exceptions). Even for excellent fund managers, it’s difficult to make a good recipe with bad ingredients.
How to manage capital decay in high yield securities
Capital and income decay is an issue in many closed-end funds, like in high yield ETFs. However, it can be avoided or mitigated by rotational strategies, instead of using funds as buy-and-hold instruments. I designed a 5-factor ranking system in 2016 and monitored its performance during several years. I started publishing the eight best-ranked CEFs in Quantitative Risk & Value (QRV) after the March 2020 meltdown. The list is updated every week. Its average dividend yield varies around 7%. It’s not a model portfolio: trading the list every week is too costly in spreads and slippage. Its purpose is to help investors find funds with a good entry point. In the table and chart below, I give the hypothetical example of starting a portfolio on 3/25/2020 with my initial “Best 8 Ranked CEFs” list and updating it every 3 months since then, ignoring intermediate updates. Return is calculated using closing prices, with holdings in equal weights and reinvesting dividends at the beginning of every 3-month period.
|
since 3/25/2020 |
Total Return |
Annual Return |
Drawdown |
Sharpe ratio |
Volatility |
|
Best 8 CEFs quarterly |
128.53% |
35.78% |
-20.60% |
1.59 |
20.25% |
|
SPFF |
30.55% |
10.37% |
-16.90% |
0.69 |
10.42% |
|
SPY |
66.96% |
20.89% |
-26.29% |
0.98 |
18.49% |
This simulation is not a real portfolio and not a guarantee of future return (Chart: author: data: Portfolio123)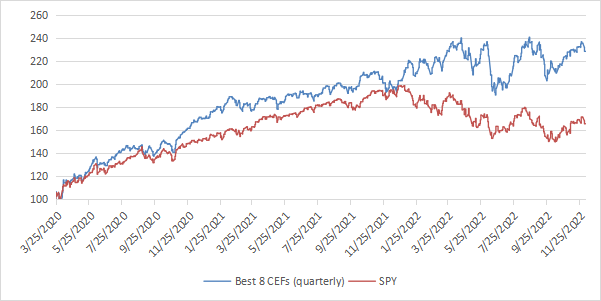
Of course, past performance (real or simulated) is not representative of future return. The “Best 8” list is unlikely to perform as well in the near future as since March 2020. The 2020 meltdown and 2022 volatility resulted in price dislocations and exceptional opportunities in the CEF universe. However, I think a time-tested rotational strategy in CEFs has a much better chance to protect both capital and income stream against erosion and inflation than a high-yield passive investment.
Be the first to comment