

chonticha wat/iStock via Getty Images
Over the past month we have seen a rare occurrence in the gold sector, with gold mining stocks rallying despite gold prices falling. The VanEck Vectors Gold Miners ETF (NYSEARCA:GDX) took out its March 10 high on Friday despite gold remaining 6% below its March peak. I have three points to note on GDX following the recent divergence:
1: In the short term there is nothing to stop the GDX posting further gains even if gold prices remain soft.
2: Even after the recent outperformance of the GDX relative to both gold and the broader stock market, the gold sector remains attractive on a relative basis.
3: From a longer-term perspective, gold appears to be the better risk-reward opportunity than gold mining stocks.
The GDX ETF
The VanEck Vectors Gold Miners ETF is the oldest, largest and most liquid gold mining ETF which tracks the performance of the NYSE Arca Gold Mining Index. The underlying index has a market capitalization of over USD365bn, larger than the alternative markets tracked by its peers such as iShares MSCI Global Gold Miners ETF (NASDAQ:RING), allowing investors greater diversification. While both GDX and RING are dominated by Newmont (NYSE:NEM) and Barrick Gold (GOLD), their weighting in GDX is a combined 26% versus 40% for RING. Similarly, GDX’s top 10 holdings make up 64% of the index versus 76% for RING. The GDX charges an annual expense ratio of 0.52% versus RING’s 0.39%.
As I have written on a number of previous occasions over recent years, the GDX has a strong tendency to outperform during periods of gold strength. This reflects the way in which mining sector profits are leveraged to the gold price, meaning that a 1% increase in gold prices deliver a much greater percentage increase in sector profits. This has been on display since the January 28 low in the GDX, since when the ETF has risen by 35% versus gold’s 11%.
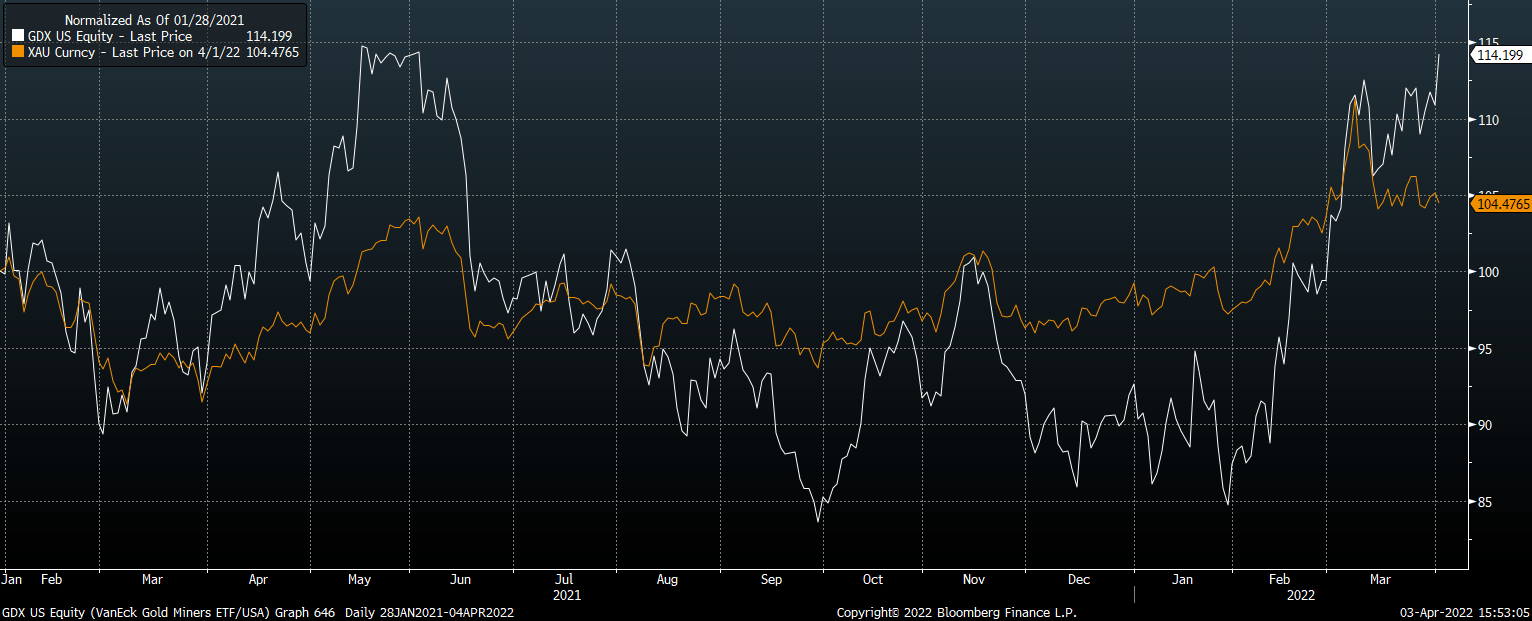
GDX Vs Gold Price (Bloomberg)
What has been surprising, however, is the price action over the past month. The GDX has actually risen while gold prices have fallen, which is a very rare occurrence. Below I will go through what I think this means for the GDX over the short and long term.
GDX Appears To Be Breaking To The Upside Despite Gold Weakness
Despite softer gold prices in recent weeks, the rally in GDX shows no sign of ending, with the ETF appearing to trigger a bullish continuation pattern on Friday. In the context of the hold above key downtrend resistance from the 2020 high, the chart pattern looks particularly positive.
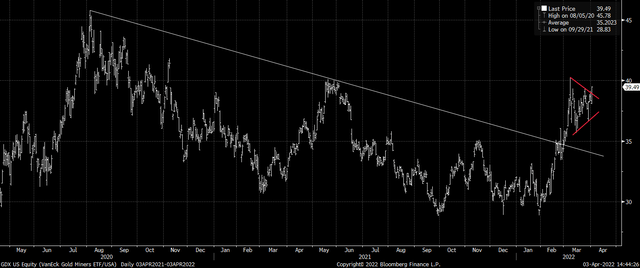
GDX ETF Price (Bloomberg)
The following chart shows periods when the GDX has traded within 1% of its 3-month highs while the gold price has been 5% or more below its 3-month highs. While it is true that such occurrences have marked a number of short-term tops in the GDX, the most recent episode in April 2021 gave way to a further 15% rally over the following month.
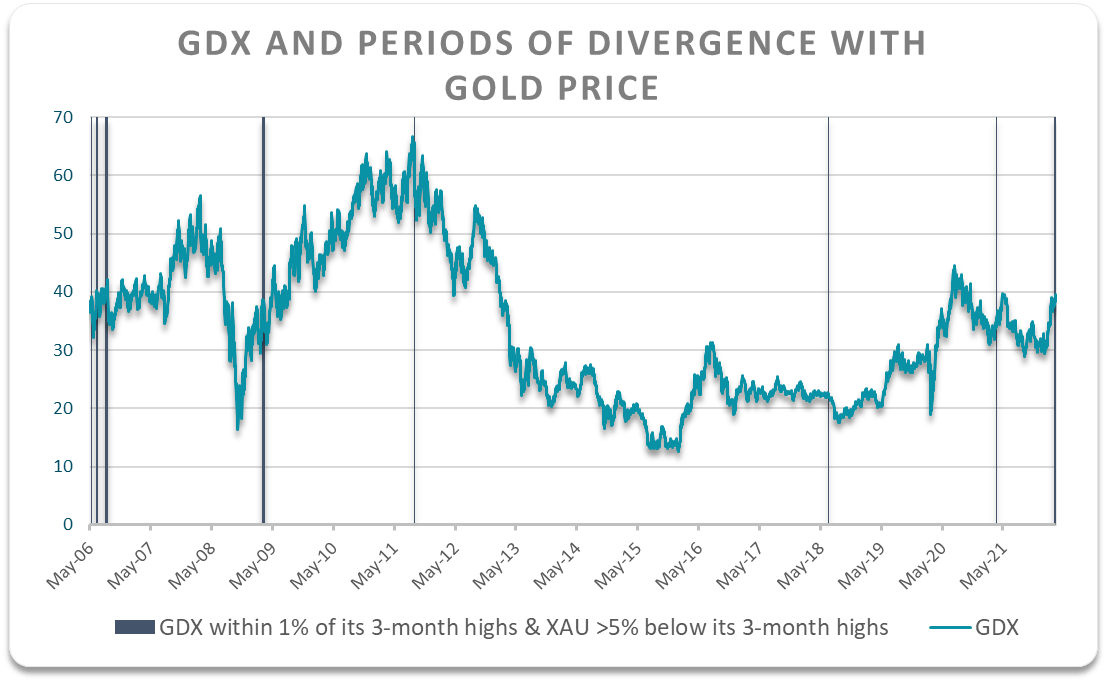
Bloomberg, Author’s calculations
GDX Remains A Bargain Relative To The Bubbly U.S. Stock Market
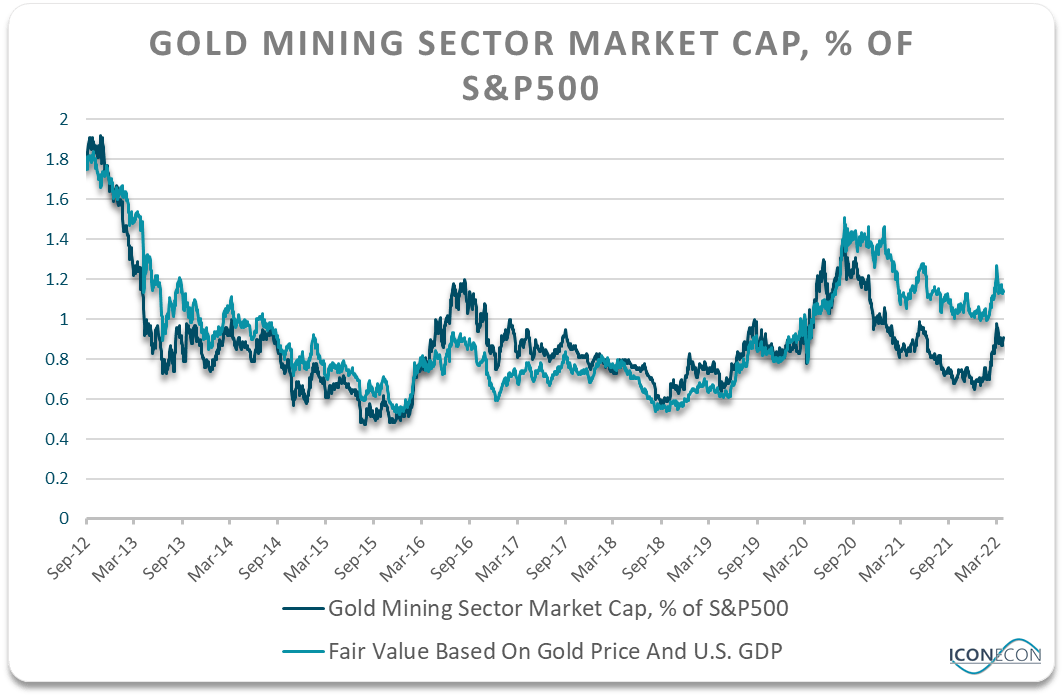
Last August in ‘GDX: Gold Miners Priced To Dramatically Outperform’ I argued that based on the prevailing gold price and U.S. GDP, the GDX was significantly undervalued relative to the S&P500. Since then, despite the GDX outperforming the S&P500 by 24% and nominal U.S. GDP growing by over 10%, the higher gold price continues to justify a significantly higher level of GDX versus the S&P500.
This can be seen in the chart below, which shows the market capitalization of the GDX’ underlying NYSE Arca Gold Mining Index as a share of the S&P500, versus the ‘fair value’ based on its correlation with the gold price relative to nominal GDP. Based on the past 10 years of data with an r-squared of 0.7, the market cap of the NYSE Arca Gold Mining Index remains roughly 20% below this measure of fair value.
Bloomberg, Author’s calculations
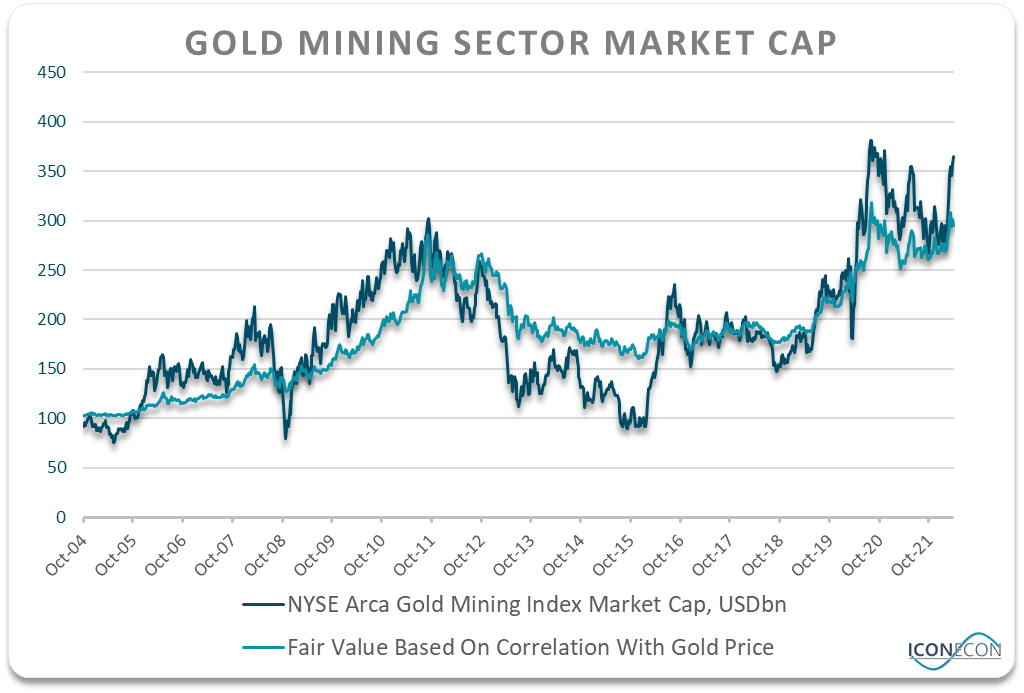
The Risk-Reward Outlook Favors Gold Over GDX
The undervaluation of gold mining stocks relative to the S&P500 now entirely reflects the overvaluation of the latter, as gold miners are no longer cheap relative to the price of gold. Therefore, I believe that gold itself is offers a superior risk-reward trade-off relative to the GDX. The chart below shows the market cap of the NYSE Arca Gold Mining Index relative to its fair value based on its historical correlation with gold prices. The recent rally in gold miners has left the sector around 20% overvalued on this metric.
Bloomberg, Author’s calculations
While a rise in the gold price would be extremely likely to result in outperformance of the GDX, it is also the case that weakness in gold would likely cause underperformance in the GDX. What really matters when deciding whether to invest in gold or gold mining stocks is the probability that gold miners fall amid rising gold prices and vice versa. Notwithstanding the near-term bullish outlook for the GDX as noted above, the longer-term outlook has deteriorated following recent outperformance. It is also worth noting that if we see a crash in U.S. stocks from current extreme overvalued levels, this has the potential to drag down the GDX as was the case during the two previous major market declines in 2008/9 and 2020.
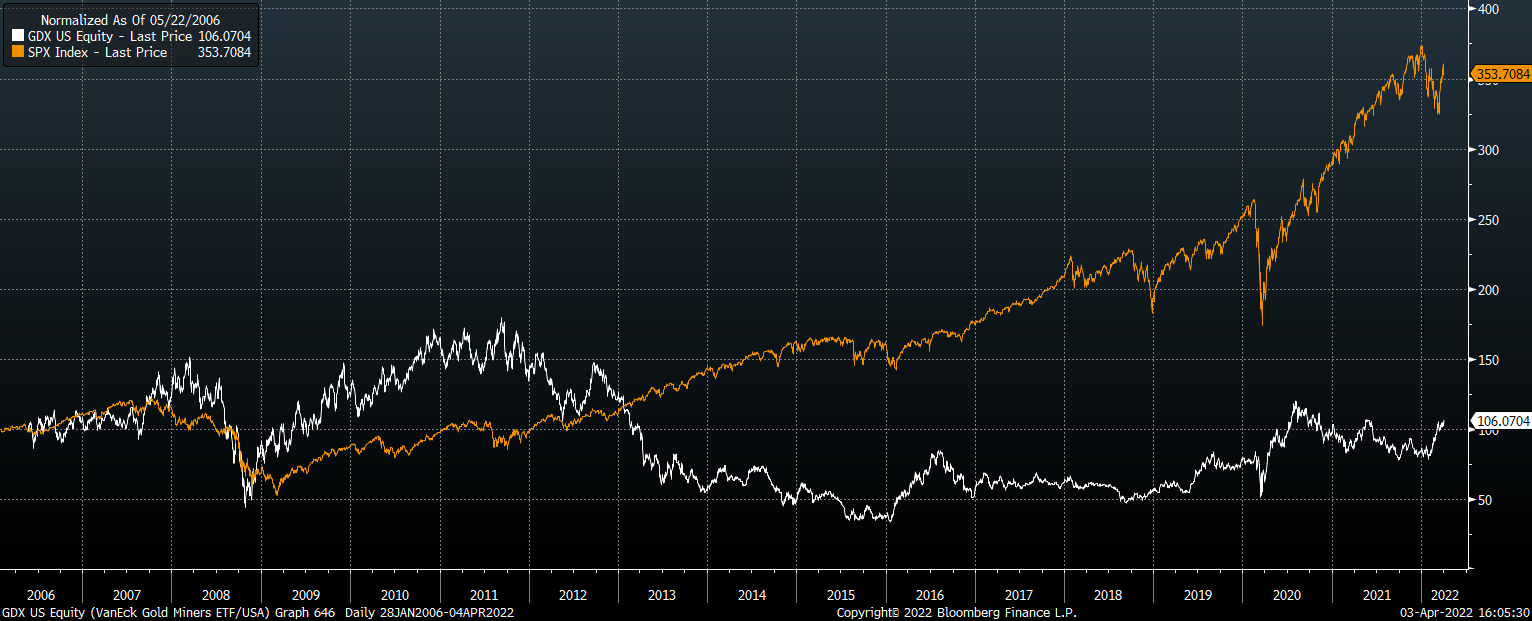
S&P500 Vs GDX (Bloomberg)
Summary
The GDX has been on a tear over the past few months, even continuing to rise despite gold prices falling significantly from their highs. In the near term, the strong technical pattern on the GDX suggests we could well see further gains. The GDX also remains significantly undervalued relative to the broader U.S. equity market and should be expected to outperform. That said, after such a strong period of GDX outperformance relative to the price of gold, the risk-reward outlook now favors the metal itself, particularly given the rising risk of a U.S. equity market crash.
Be the first to comment