


Darren415/iStock via Getty Images
Written by Nick Ackerman, co-produced by Stanford Chemist. A version of this article was originally published to members of the CEF/ETF Income Laboratory on April 1st, 2022.
Gabelli Dividend & Income Trust (NYSE:GDV) is one of those closed-end funds that doesn’t get too much attention, aside from my regular updates. It isn’t the highest yield, the sexiest portfolio with all the names that could make you rich overnight. Instead, it is a steady monthly payer with a reasonable and sustainable payout level. Boring and steady is sometimes exactly what I’m looking for. While holding some of those familiar mega-cap tech names, the top names are also differentiated from others. I believe that can provide some better diversification.
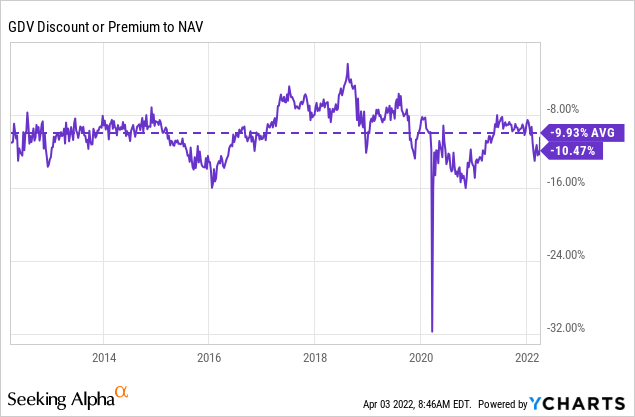
The fund regularly trades at a discount. In fact, the only time it traded at a premium was at its launch. That only happened because when closed-end funds were launched in earlier years, the expenses for launching a fund came directly out of the assets raised. Therefore, the price would come out at $20, but the NAV would be $19.06. That was the exact case with GDV, as it launched in 2003. That being said, the latest discount is unusually wide compared to the last several years.
The Basics
- 1-Year Z-score: -0.51
- Discount: -10.47%
- Distribution Yield: 5.31%
- Expense Ratio: 1.26%
- Leverage: 11.5%
- Managed Assets: $3.1 billion
- Structure: Perpetual
GDV is described as “a diversified, closed-end management investment company whose objective is to provide a high level of total return.” Their investment policy is “under normal market conditions, the Fund invests at least 80% of its assets in dividend-paying or other income-producing securities. In addition, under normal market conditions, at least 50% of the Fund’s assets will consist of dividend-paying equity securities.”
Overall, they are pretty free to invest how they see fit with a tilt towards owning a fairly substantial dividend-paying stock weighting. That would generally help fund the distribution. However, the preferred dividends take a large portion of the fund’s net investment income.
On the other hand, with the preferred dividends, their leverage expenses aren’t going to be rising as interest rates rise. The majority of their preferred is fixed-rate. The downside here is that it is more expensive to issue in the first place. Though they also have some small exposure to the “auction market” preferred that will have a variable payout.
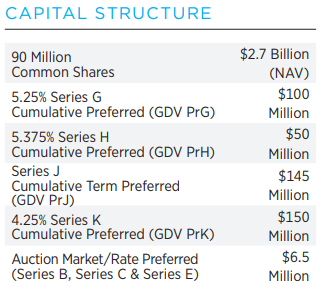
GDV Capital Structure (Gabelli)
It is important to note that the Series G Cumulative Preferred has been redeemed. This is worth noting as I went over how they have filed an N-2 in our previous article.
One final important update that I don’t want to get lost in this update is they have an N-2 on file. That is a required filing if a fund is going to issue new shares of either common or preferred. This fund has done rights offerings in the past, so it certainly could happen again. Additionally, they have preferred shares outstanding for their leverage, so that is entirely possible.
Their 5.25% Series G Cumulative Preferred (GDV.PG) has become callable after July 1st, 2021, which could be a good reason to call that and issue new preferred shares at a lower coupon. This seems to be exactly what they are thinking, as they just announced on November 17th that they were redeeming all the outstanding series G shares. The actual redemption date will be “announced at a later date.” Interestingly, the preferred are still trading a bit above par.
At this time, it has all been redeemed, and no shares are trading. However, they haven’t filed anything new in terms of what they will be doing to replace that or raise additional capital through common shares.
Performance – Discount Appealing
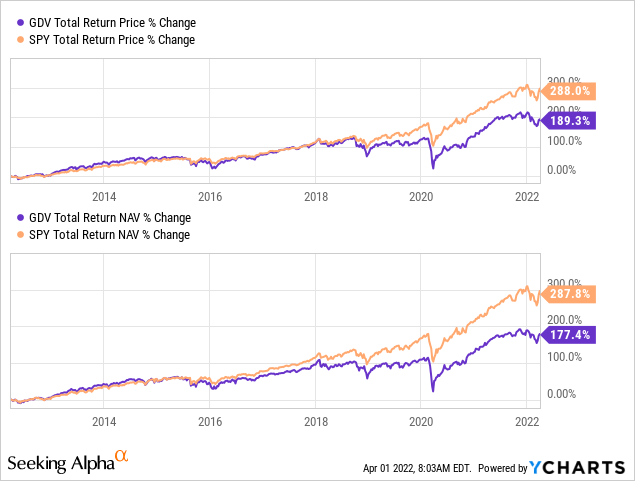
The fund has delivered fairly attractive returns over the last decade. Though that might not be saying much since many equity-oriented portfolios – and just about everything else – also delivered respectable returns.
For GDV, since their portfolio wasn’t filled with an overweight to tech allocations would have underperformed the market. Which is precisely what we see if we compare the fund to the SPDR S&P 500 Trust ETF (SPY). The chart below is for the last ten years. Where we can see that SPY started to really pull away would be around 2019.
YCharts
I believe that is the result of when the mega-cap tech names began to really dominate the overall market. At the end of December 2021, tech made up over 29% of SPY. In fact, the top 5 positions are the mega-cap tech names we hear about all the time. The weighting to those names has become 21% of the entire ETF.
So if we are benchmarking against SPY returns and you want to achieve those, I don’t think GDV would be appropriate. Although, if tech continues to slide or those mega-cap tech stock plays stop working, then GDV could have a chance to outperform going forward.
The negative z-score is what caught my attention the most. It recently touched a discount of 12.84%, translating to a negative z-score of 2.52. That would indicate that GDV is at a particularly attractive discount level where investors could pick up a position. The fund regularly trades at a discount, but it is on the lower end of its usual range.
However, this had quickly changed in one day’s time. Which is consistent with the volatile environment as of late. The current discount is still wider than its ten-year average.
Distributions – Steady Monthly Pay
My other key attraction for GDV is the steady monthly distribution that it has paid out. They had cut twice, and that was in the 2008/09 GFC. I’m certainly willing to look past when a fund is cut during that time. The current monthly distribution is also what they were paying pre-GFC.
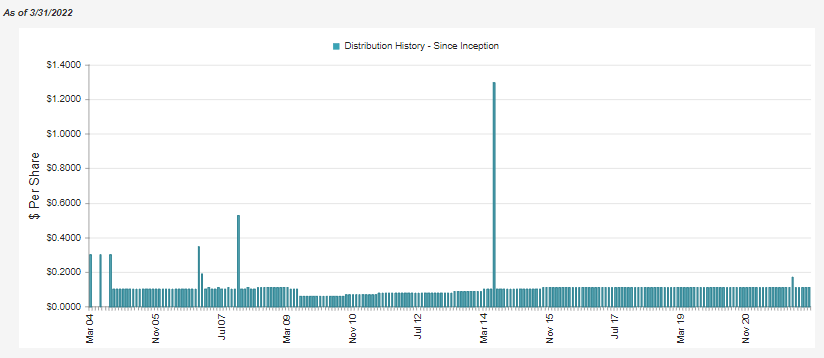
GDV Distribution History (CEFConnect)
The equity markets have been performing quite well over the last few years, which resulted in the fund taking capital gains and paying out a small special in the prior year. It appears that they don’t want to generate too much in the way of realized gains; instead, they just focus on maintaining their current payout. For most investors, this could be seen as quite stingy at current levels.
The current distribution rate works out to 5.31%. On a NAV basis, it works out to 4.75%. I believe they definitely have the capacity to boost their payout to shareholders here. However, it seems they are quite content on the current level.
For the fund to cover its distribution, it does require capital gains. Net investment income had declined year-over-year as well. Though it isn’t necessarily overly alarming. With another series of preferred redeemed, the dividends paid to preferred shareholders should also decline once again. Unless they issue, a new preferred that offsets this sometime in fiscal 2022.
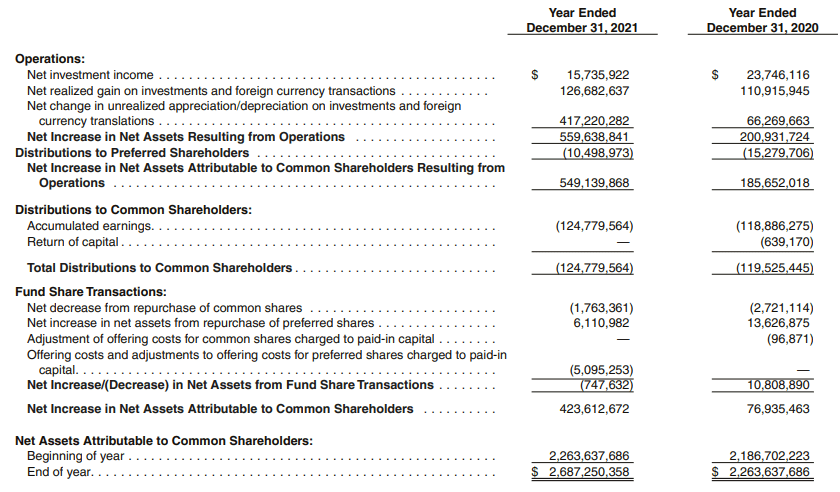
GDV Annual Report (Gabelli)
The distributions paid out to common shareholders increased year-over-year. That would have been the result of the year-end special that they paid.
We see primarily long-term capital gains in the distribution characterization for tax purposes. This is to be expected. The smaller portion that is identified as ordinary income is generally going to be considered qualified dividends too.
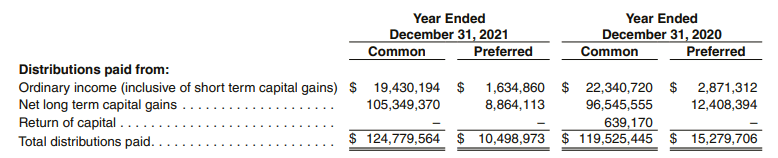
GDV Tax Character (Gabelli)
From my own 1099, GDV’s ordinary dividends were 100% classified as qualified dividends for the last year.
GDV’s Portfolio
The turnover of this portfolio isn’t overly significant. In the last year, they reported a 15.6% rate. One way to keep realized gains lower is that if you don’t trade around your portfolio too significantly, gains stay unrealized.
At the end of 2021, the financial services sector made up the largest exposure. This was followed by healthcare and then food & beverage. We don’t start seeing some tech exposure until the 7.9% allocation to computer software & services.
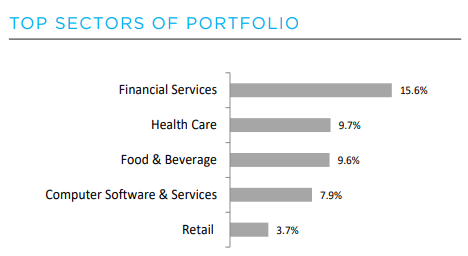
GDV Sector Allocation (Gabelli)
This was similar to when we took a look at the portfolio in our previous update. However, what is also interesting is that exposure to all of these sectors listed – while the same – all declined to some degree. Financial services were previously 17.1%, food & beverage was 10.2%, and healthcare was 10%, just as a few examples. So somewhere in the underlying portfolio, other sector exposure that isn’t presented in the chart above would have presumably increased.
The financial exposure is something that I believe is positive for the fund. I find the more diversified approach appealing. Again, setting itself apart from something like SPY that is way overweight in tech, in my opinion.
Fortunately, they update their portfolio holdings for investors more frequently than they provide portfolio sector weightings. Here are the top ten for the end of March 2022.
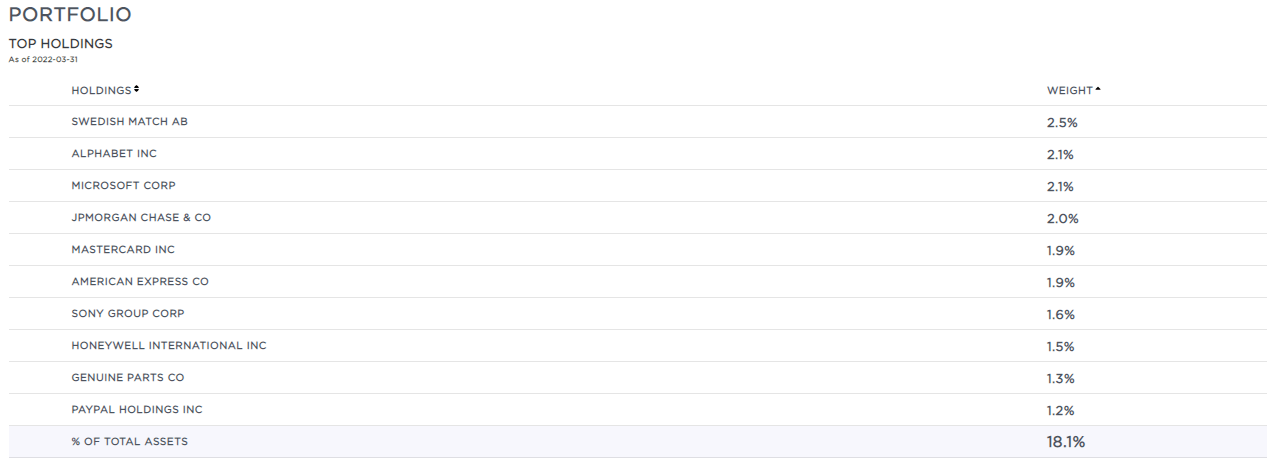
GDV Top Ten (Gabelli)
Swedish Match (OTCPK:SWMAF) remains a significant position in this fund’s portfolio. In fact, it looks like the position has now reclaimed the top spot away from Alphabet (GOOG) again. In our previous update, GOOG topped the SWMAF position. SWMAF trades on the pink sheets, and that can add additional risks to investing in such stocks with a lack of liquidity and fewer reporting standards.
SWMAF is a tobacco company based out of Sweden if you could have guessed it. This is a position that shows up in a lot of Gabelli’s funds. It even shows up as their largest position in the Gabelli Global Utility & Income Trust (GLU).
In the last six months, GOOG has significantly outperformed SWMAF. That could indicate that GDV’s managers are actually adding to their position in SWMAF. Otherwise, the position’s allocation would have decreased since the last time we touched on the fund.
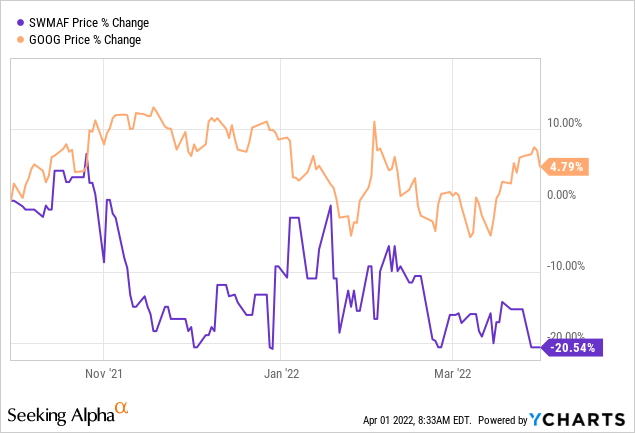
YCharts
At the end of 2021, their Annual Report shows 8.22 million in total shares being held. That was a decrease from the 8.23 million they reported in their Semi-Annual Report. So with this latest update in their top holdings, it will be interesting to see when they report their Q1 2022 full holdings list. Then we would be able to confirm how much they have added to the position.
Conclusion
I continue to find GDV attractive. For investors that wanted to start a position potentially, I believe now could represent a fairly attractive entry level. The significant negative 1-year z-score indicated that the discount is significantly wider than in the last year. With the rapidly changing market, that didn’t last long. On the other hand, it is still wider now than in the previous ten-year discount level. That being said, I also realize GDV won’t be appealing to every investor. I enjoy the steady distributions personally. I wouldn’t mind an increase, but they seem content at the current level.
Be the first to comment